Dakota County stretches south and southeast from the Twin Cities, beginning with a narrow northern section near Mendota Heights, West St. Paul, South St. Paul, and Inver Grove Heights before widening around Eagan, Burnsville, Apple Valley, and Rosemount. Lakeville and Farmington extend the developed area farther south, while Hastings sits well to the east near the river boundary. The county therefore combines a dense suburban north with a much broader southern landscape where cities are farther apart and streams, valleys, and open land become more prominent.
This page compares four views of that geography: a general county map, a simplified major-city map, a terrain-and-water map, and a county-scale elevation map. After reviewing them on screen, you can download the same maps as high-resolution JPG files in one ZIP archive for printing, study, or personal projects. A practical way to read the set is to begin with Eagan, Burnsville, Apple Valley, Lakeville, and Rosemount, then move east toward Hastings and finally compare the Vermillion and Cannon river systems with the elevation surface.
Table of Contents
A dense northern suburb pattern opens into a much larger county
The general map makes the northwestern concentration of cities immediately visible. Mendota Heights, West St. Paul, and South St. Paul occupy the narrow northern end of the county, with Sunfish Lake and Inver Grove Heights directly below. Farther west and south, Eagan and Burnsville cover large adjoining areas, Apple Valley fills another large block below them, and Rosemount occupies a broad area to the east. The close spacing of city boundaries in this part of the map contrasts sharply with the larger unbroken areas farther south.
Minneapolis and St. Paul appear outside the county and provide useful regional orientation. St. Paul lies just beyond the northern river boundary, while Minneapolis is farther to the northwest. This placement shows why the upper part of Dakota County functions as the southern side of the Twin Cities metropolitan area. The county is not centered around a single town in the middle; instead, its most continuous urban pattern is concentrated near the top and upper-left portion of the outline.
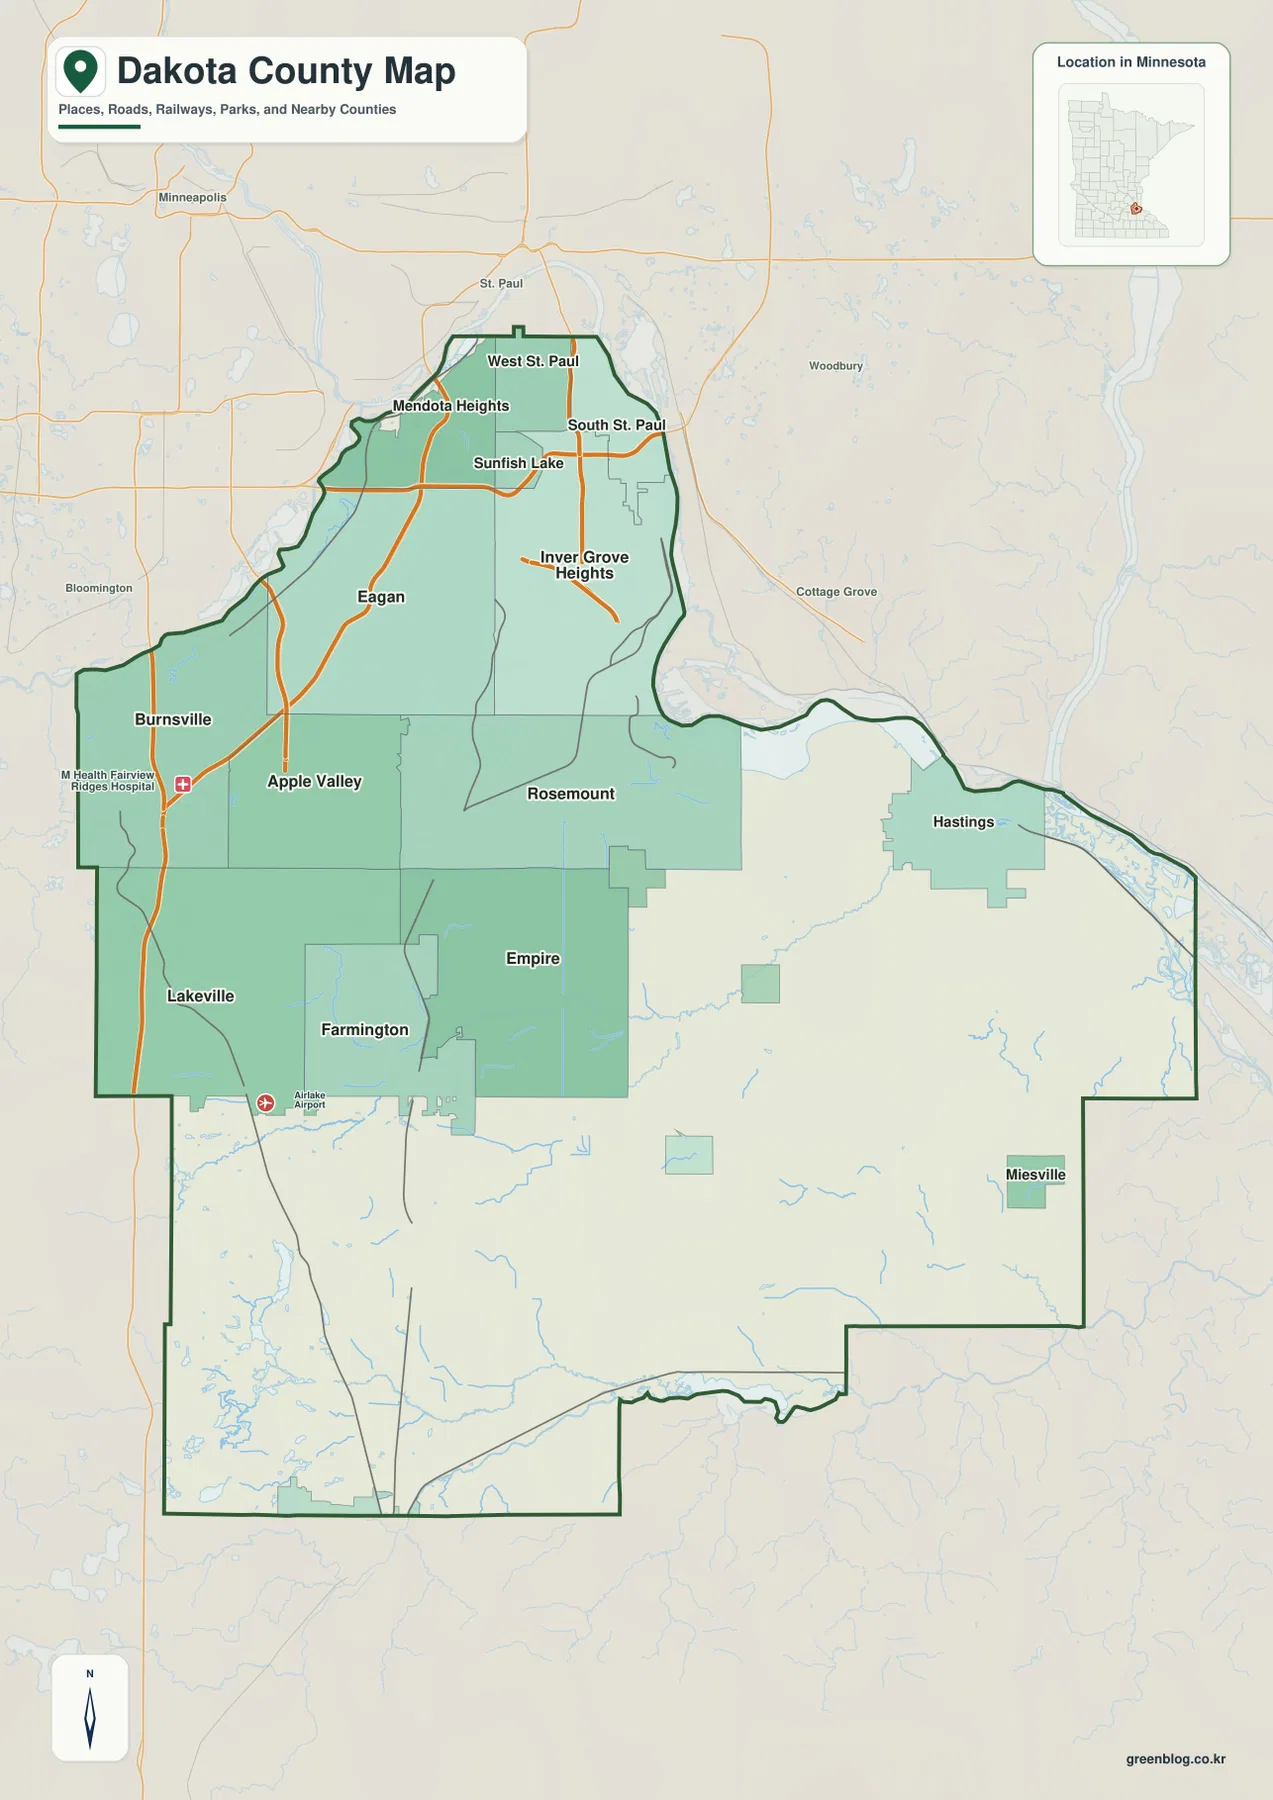
South of the main suburban cluster, Lakeville extends along the western side and Farmington appears farther east. Empire lies between the Farmington and Rosemount areas, while Hastings stands apart in the eastern arm of the county. Miesville is shown near the southeastern side. These labels help reveal how settlement becomes more dispersed as the county widens toward the south, where large areas contain few major-city labels compared with the compact northern half.
The outline itself is useful to study. The northern end is narrow and bounded by large river corridors, the central portion widens around the major suburbs, and the southern half forms a broad block with several irregular edges. The eastern side reaches toward Hastings along a river bend before turning south. Because of that shape, a simple north-south description is not enough; identifying the northern urban neck, the central suburban belt, the southern interior, and the Hastings side provides a clearer mental map.
Six major cities show the northwest-to-southeast spread of development
The simplified city map highlights six places: Lakeville, Eagan, Burnsville, Apple Valley, Inver Grove Heights, and Rosemount. The ranking on the map places Lakeville first, Eagan second, Burnsville third, Apple Valley fourth, Inver Grove Heights fifth, and Rosemount sixth. More important than the ranking itself is the geography. Eagan and Burnsville form a close northwestern pair, Apple Valley sits just to their south, Lakeville extends farther southwest, and Inver Grove Heights and Rosemount shift the pattern eastward.
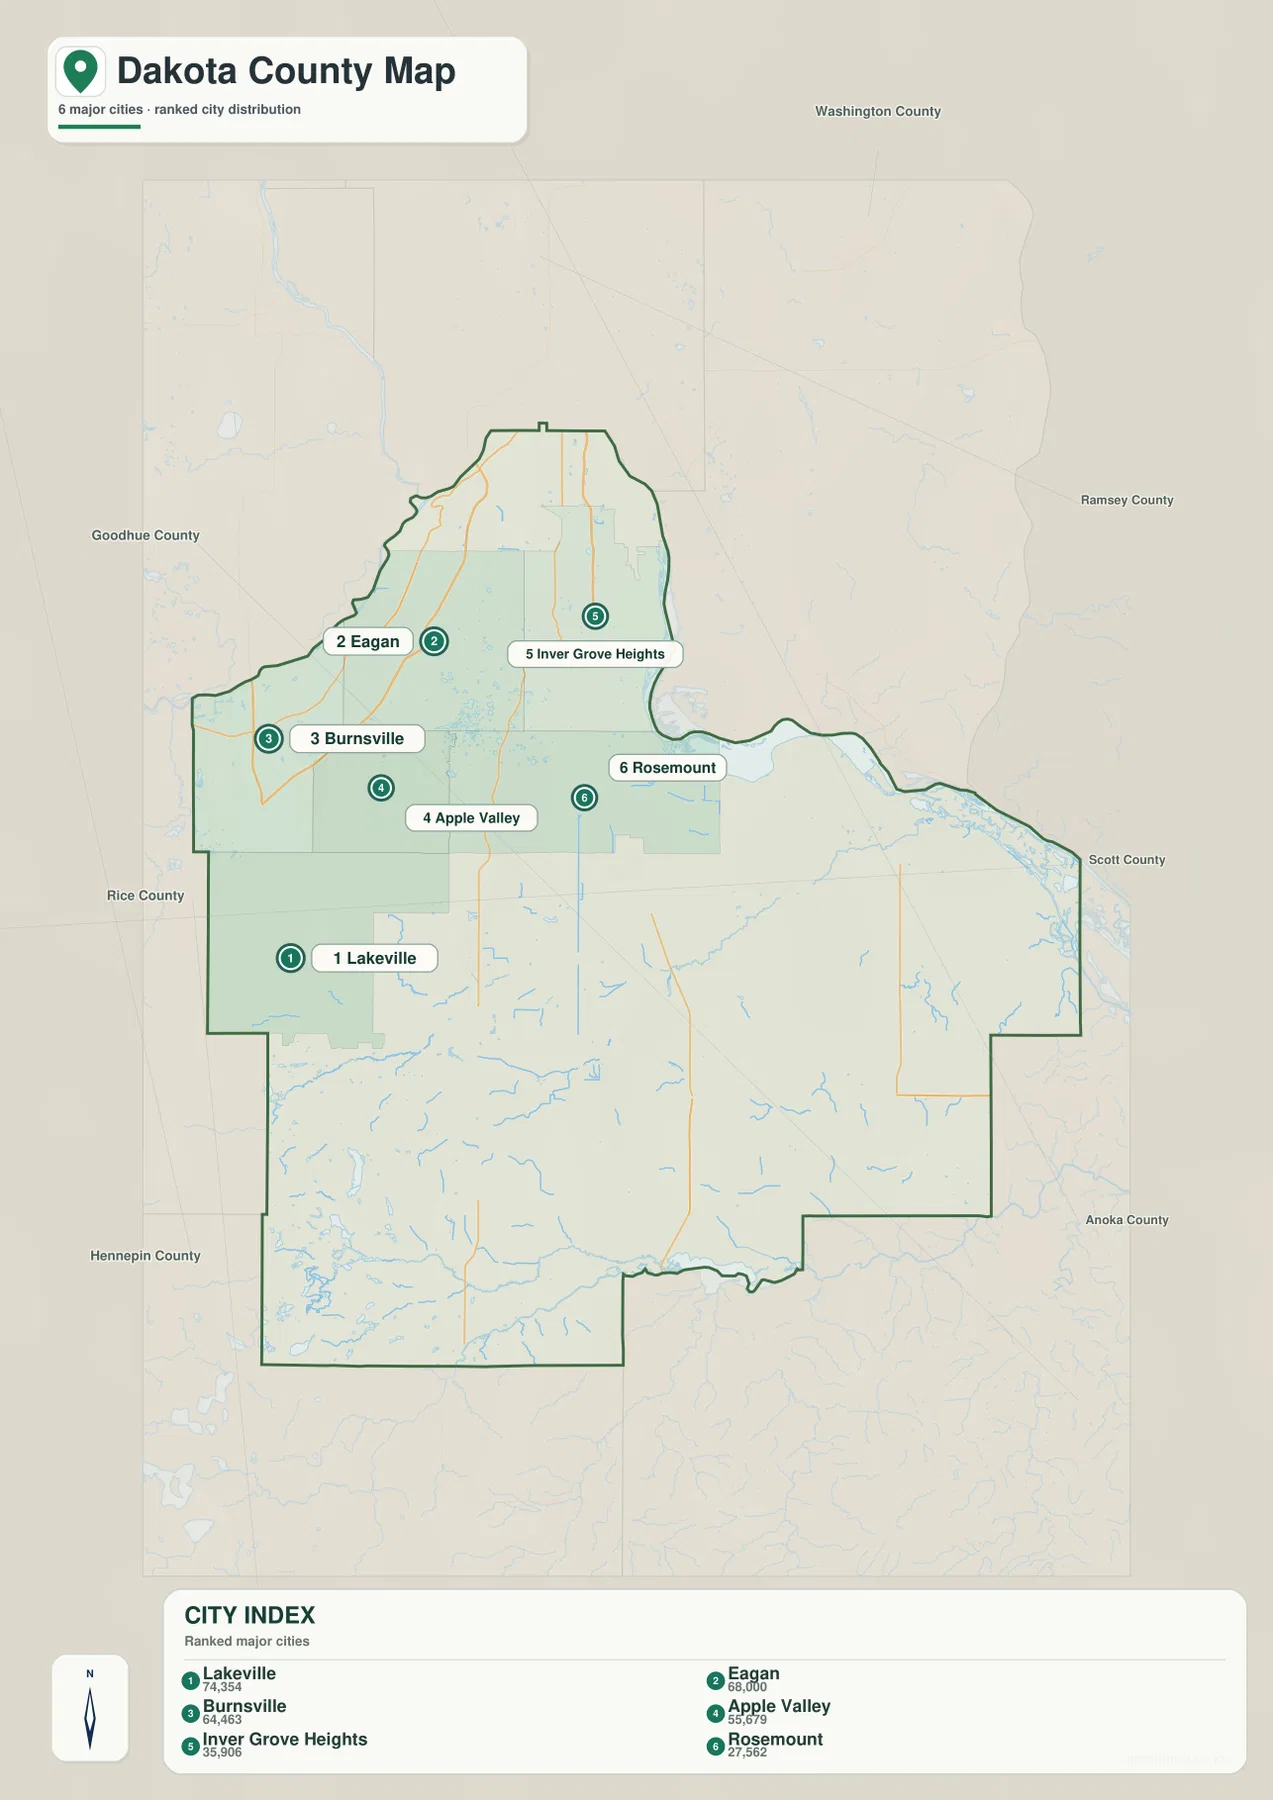
This simplified view is especially useful for recognizing that the largest mapped communities do not occupy the entire county. All six highlighted cities are in the northern half, leaving a large southern area without a comparable major-city marker. That visual pattern matches Dakota County planning documents, which describe population as concentrated in the northern part of the county while much of the southern portion remains more rural in character.
Lakeville is the southernmost of the six highlighted places and therefore works as a transition point between the metropolitan north and the broader southern landscape. Rosemount occupies a similar transitional position farther east. Inver Grove Heights is set closer to the northern river corridor, while Eagan and Burnsville are nearest the northwestern side. Looking at the city map before studying the water and elevation maps makes it easier to see how development sits within a landscape shaped by large rivers along the county edges.
The values printed in the city index should be treated as the ranking figures used for this map rather than a replacement for the newest population estimates. Population estimates can change from year to year, and exact municipal boundaries also matter when comparing places. For this page, the city map is most valuable as a geographic summary showing where the major population centers are relative to one another.
Major boundary rivers frame the county while the Vermillion crosses the interior
Dakota County’s official comprehensive plan identifies the Minnesota River along the northwestern side and the Mississippi River along the northeastern side. Those broad river corridors are easy to recognize on the supplied water map, where the northern end of the county is surrounded by low river valleys. Hastings lies farther east near another major river bend, reinforcing the importance of water to the county’s outer shape. The rivers are not merely isolated blue lines; they help define the boundary and create visible lowlands along the edge.
Inside the county, the Vermillion River is the most prominent named system. It runs generally from west to east across the central portion, with the North Branch Vermillion River and South Branch Vermillion River joining the network from the west and southwest. This waterway crosses the broad zone between the northern suburbs and the more open southern area. When viewed beside the city map, it becomes easier to place Farmington, Empire, Rosemount, and the eastern interior in relation to the river.
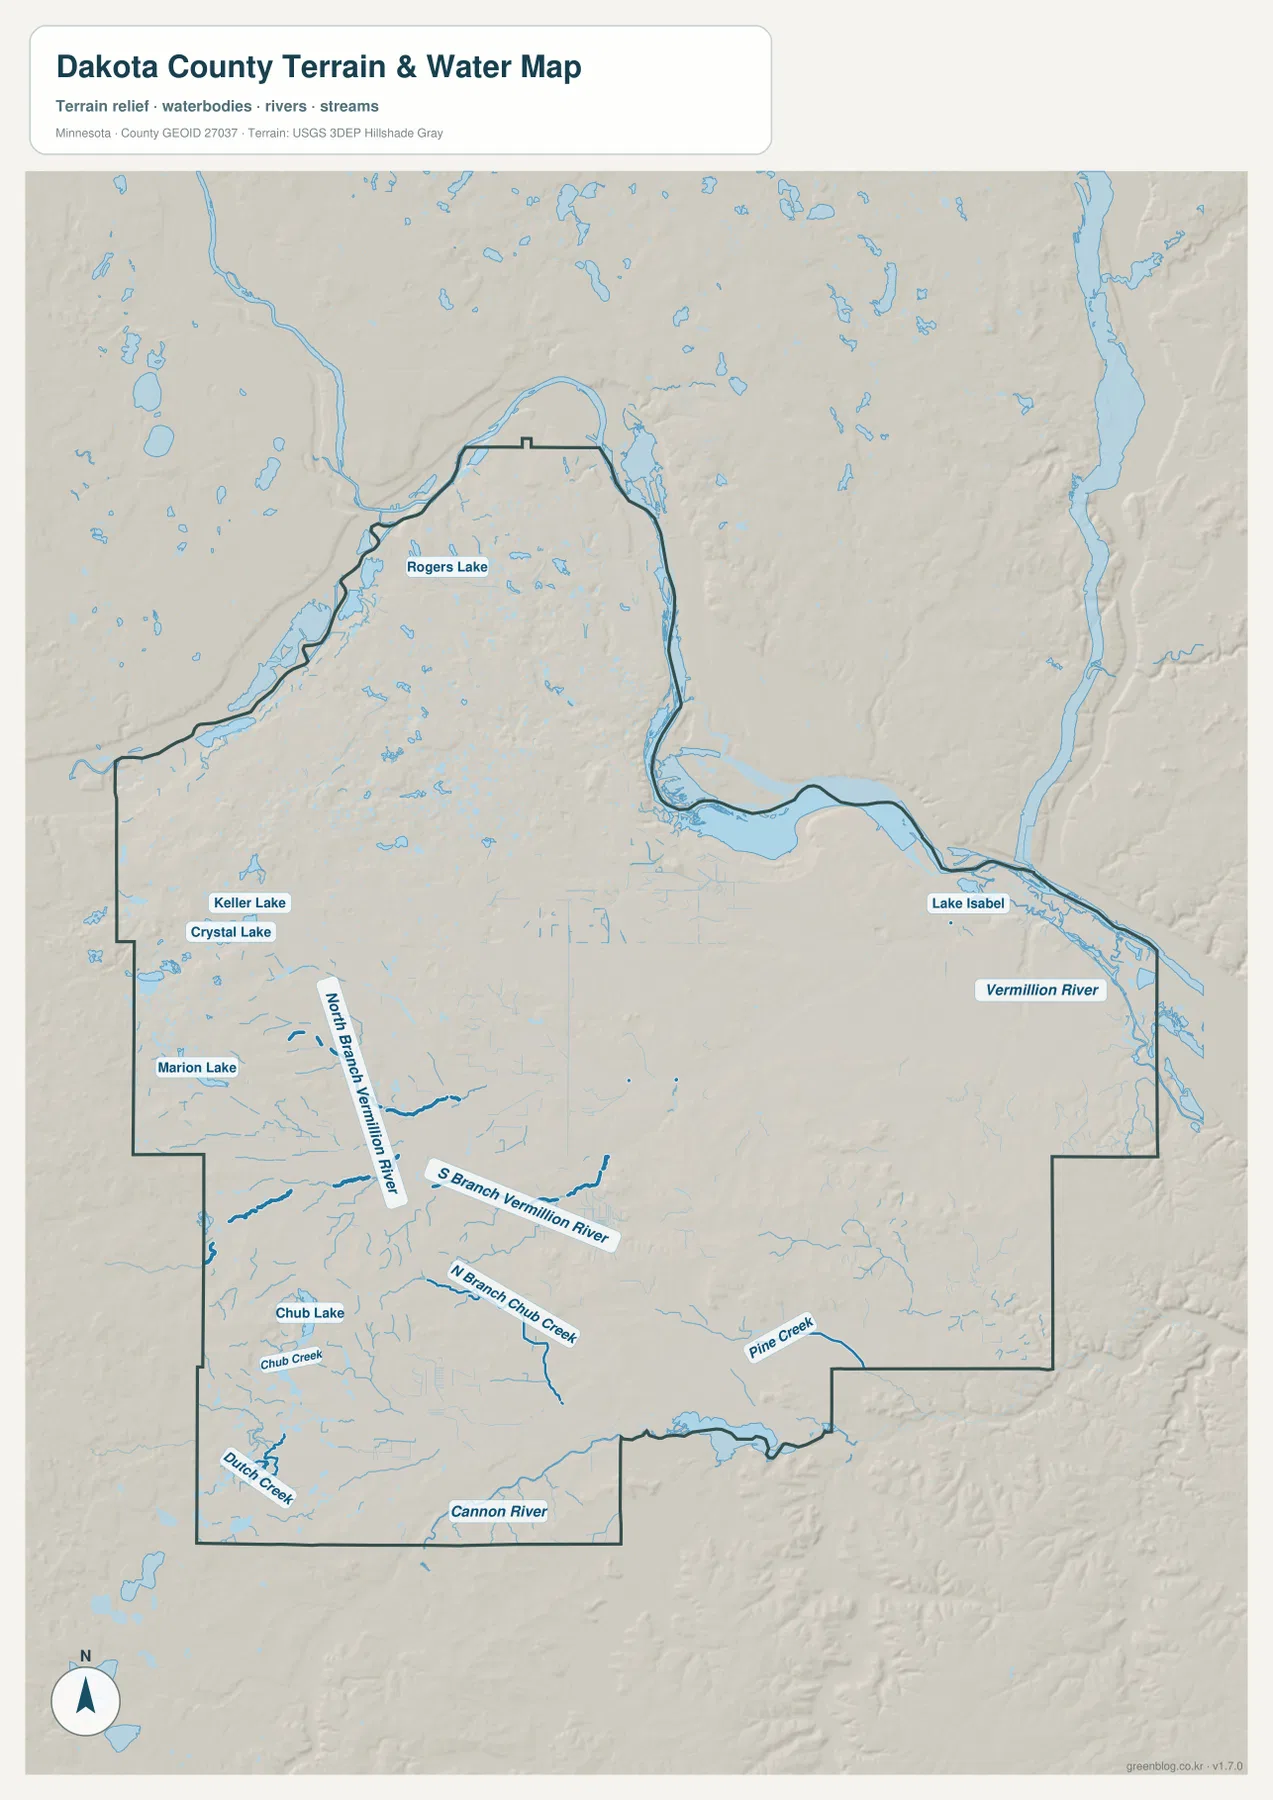
Several smaller streams become more noticeable in the southern half. Chub Creek and North Branch Chub Creek appear in the south-central area, Pine Creek is farther southeast, and Dutch Creek reaches toward the southern boundary. The Cannon River follows part of the southern edge. Compared with the broad rivers along the north and east, these smaller waterways create a finer network of valleys through the southern interior.
Named lakes add another layer of local reference points. Rogers Lake is near the northern area, Keller Lake and Crystal Lake sit in the western urban zone, and Marion Lake lies farther south. Lake Isabel appears on the eastern side near the Vermillion River, while Chub Lake is shown in the south-central portion. The county is not dominated by one large inland lake; instead, smaller lakes and branching rivers are distributed among urban and rural areas.
This water map is intended for geographic comparison, not for legal or engineering decisions. It should not be used by itself to determine flood zones, wetland regulations, navigability, shoreline setbacks, or property boundaries. Dakota County maintains separate water-management and GIS resources for the Vermillion River and other local systems, and those current official sources are the better choice when a project depends on precise regulatory information.
South of Farmington, streams and open land become more prominent
The contrast between north and south becomes strongest below Farmington. In the upper half of the county, city names and municipal blocks nearly touch one another. Farther south, the gaps between major place labels widen and the map gives more visual space to streams, broad land areas, and small communities. This is one of the most useful reasons to keep the full county outline visible: a close-up of the Twin Cities suburbs alone would miss a large part of Dakota County’s geography.
The southeastern area around Miesville is well separated from the Eagan-Burnsville-Apple Valley cluster. On the terrain-and-water map, Cannon River, Pine Creek, Chub Creek, and other channels become stronger reference points than large cities. The elevation map adds ridges and valleys that are difficult to recognize on the basic county map. Together, the maps show why the southern half feels more open even though it remains part of the same county.
This difference matters when choosing a map for a report or presentation. A city-focused graphic can emphasize the northern half because that is where the largest mapped communities are clustered. A water, agriculture, terrain, or countywide geography topic should keep the south in view, because the Vermillion tributaries, Cannon River, and broad changes in elevation occupy a substantial part of the county.
Elevation from about 183 to 362 meters separates river lowlands from uplands
The elevation legend shows an actual countywide range of roughly 183 to 362 meters, with a mean near 278 meters. The map is locally scaled, so its colors are best read as a comparison of higher and lower ground inside Dakota County. In the narrow northern section, brown and tan uplands occupy the interior while green lowlands follow the major river corridors along the edges. The contrast is sharp enough to show that the northern suburbs sit within a landscape of river valleys and higher interior ground rather than on one uniform flat surface.
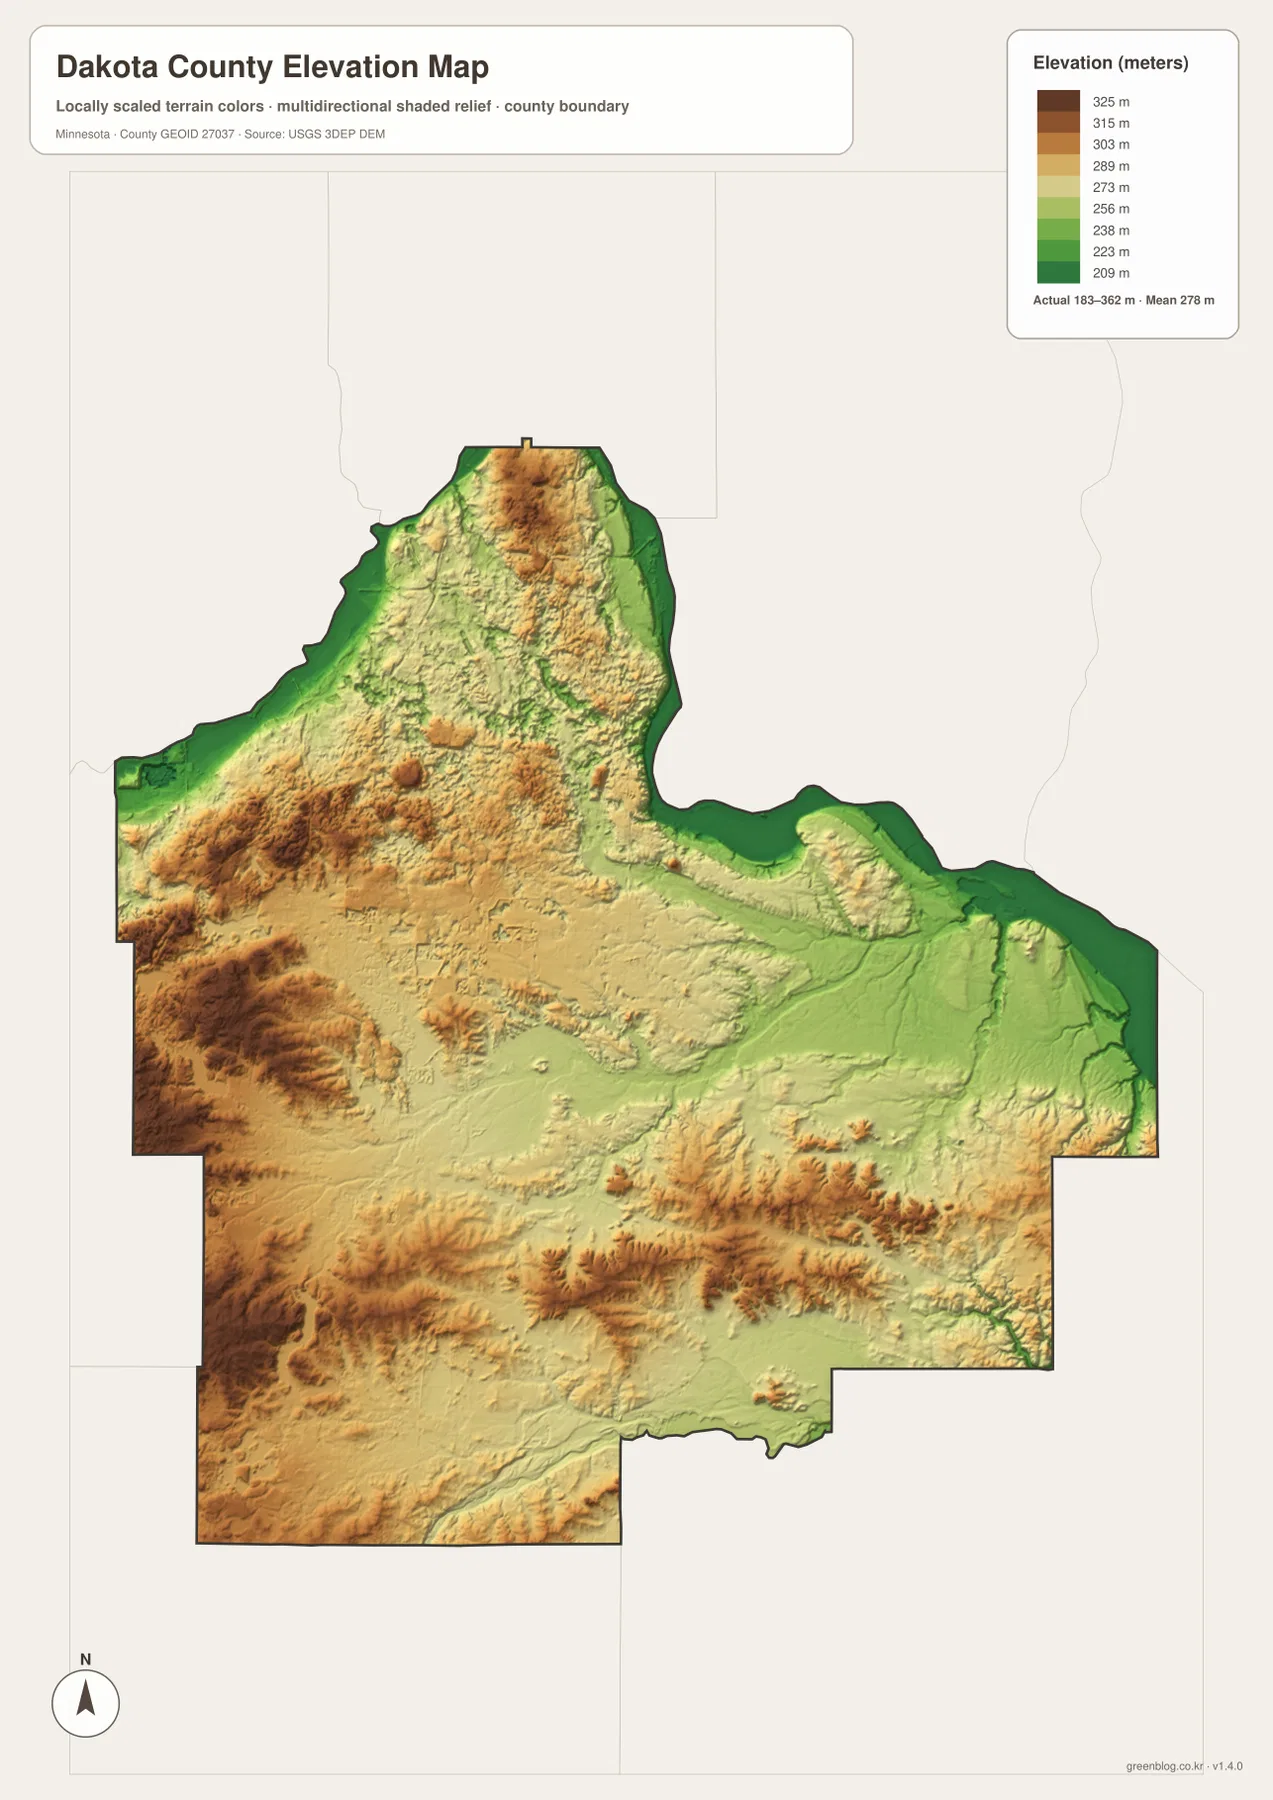
Higher terrain also appears broadly in the west and southwest. The Burnsville-Lakeville side contains many tan and brown areas, while the central portion becomes more moderate. Along the eastern river boundary near Hastings, greener colors mark lower elevations. The southeast contains alternating ridges and lower corridors rather than a single continuous slope, giving that part of the county a more textured appearance.
The Vermillion and Cannon river systems can be traced as lower corridors when the elevation map is compared with the water map. Blue stream lines on one map correspond to green or lower-toned valleys on the other, while adjacent ridges rise into yellows and browns. That relationship helps explain the local shape of drainage without turning the map into an engineering diagram.
The elevation surface is generalized for countywide viewing and is not survey-grade. It cannot provide the exact elevation of a house, road, parcel, culvert, or construction site. Work that depends on precise vertical measurements should use detailed USGS 3D Elevation Program data, local engineering information, and field survey where required. On this page, the map is best used to compare broad river lowlands with higher interior terrain.
A useful reading order: cities first, then rivers, then relief
For a first look at Dakota County, start with the general map and locate Eagan, Burnsville, Apple Valley, Lakeville, Rosemount, Farmington, and Hastings. These places divide the county into understandable sections. Next, use the city map to simplify the northern population pattern and compare the six highlighted cities without the distraction of smaller labels. This establishes the human geography before natural features are added.
The water map should come next. Follow the large river corridors along the northern and eastern edges, then trace the Vermillion River across the interior and the Cannon River along the south. The named lakes and smaller streams fill in local detail. Once those waterways are familiar, the unusual county outline becomes easier to remember because several bends and lowland corridors align with water.
Finally, compare the elevation map with the water map. Higher western and northern ground becomes visually distinct from the green river valleys, and the southern network of streams can be connected with the ridges around it. This step is particularly useful for explaining why two places that look close on a simple city map may sit on different sides of a valley or upland area.
Each map also has a different practical use. The general map is best for a broad location overview, the city map is effective in a slide or classroom handout, the water map works well for river and watershed topics, and the elevation map is useful for terrain context. Because all four cover the same county, placing two maps side by side often communicates more than trying to force every type of information into one crowded graphic.
What these county maps do and do not show
These maps are designed for countywide orientation, printed reference, study materials, and personal projects. They are not a replacement for a full municipal GIS, parcel map, flood insurance map, engineering survey, or navigation system. The amount of detail is intentionally limited so that major cities, rivers, lakes, and elevation differences remain readable at a county scale.
That limitation matters most in the northern suburbs, where city boundaries, local streets, trails, and waterways are dense. A county-scale map may simplify small bends or omit minor features. In the rural south, some small roads and tributaries are also not labeled. The city ranking is a static map element rather than a live population counter, and the water map does not establish legal water boundaries or flood risk.
For more detailed work, the U.S. Census Bureau TIGER/Line files provide official geographic boundary data, USGS National Hydrography provides water features, and the USGS 3D Elevation Program provides elevation data. Dakota County’s comprehensive plan is also useful for understanding the official description of the county’s major rivers and the broad urban-rural pattern. These sources can be used alongside the downloadable maps when a project needs more detail than a single static image can provide.
Frequently Asked Questions
Which map is best for locating the main Twin Cities suburbs in Dakota County?
The general county map is the best starting point because it shows Eagan, Burnsville, Apple Valley, Lakeville, Rosemount, Inver Grove Heights, Farmington, and Hastings in one view. The simplified city map is helpful when you want to compare only the six highlighted major cities and see how strongly they are concentrated in the northern half of the county.
Where can I see the Vermillion and Cannon rivers?
Use the terrain-and-water map. The Vermillion River crosses the central part of the county from west toward the east, with north and south branches joining the system. The Cannon River appears near the southern edge. Smaller channels such as Chub Creek, Pine Creek, and Dutch Creek add detail to the southern drainage network.
Can the 183-362 meter elevation range be used for surveying or construction?
No. The elevation range is useful for comparing broad countywide relief, such as low river valleys and higher interior uplands, but it is not a parcel-level survey. Construction, drainage, engineering, and property work should use detailed elevation data and any required professional or field measurements.
Map File Information
The ZIP contains the original high-resolution JPG files for the four Dakota County maps shown on this page.
- Included Files: county map, city map, water map, elevation map
- Printable Size: each JPG is 2572 × 3638 px
- File Type: ZIP containing four JPG images
Related Maps
Sources and References
- Dakota County 2040 Comprehensive Plan – background on major rivers, land use, and county geography
- U.S. Census Bureau TIGER/Line Shapefiles – official geographic boundary data
- USGS National Hydrography – river, stream, and waterbody data
- USGS 3D Elevation Program – elevation and terrain data
Green Map creates custom-edited map images using open geographic data sources such as geoBoundaries, Natural Earth, OpenStreetMap, and government open data. These maps are edited visual materials, not raw data files, and are provided for education, documents, presentations, and graphic reference.