UNESCO Institute for Statistics (UIS) indicator ETOIP.0.PR.M reports the percentage of male enrolment in early childhood education programmes that is in private institutions. The 2024 extract contains 78 reported country and area observations, all measured in percent. The median is 51.13% and the mean is 51.77%. Those summary values are close, but the underlying distribution has a distinctive shape: most observations are packed tightly around 50%, while a very small number extend far upward.
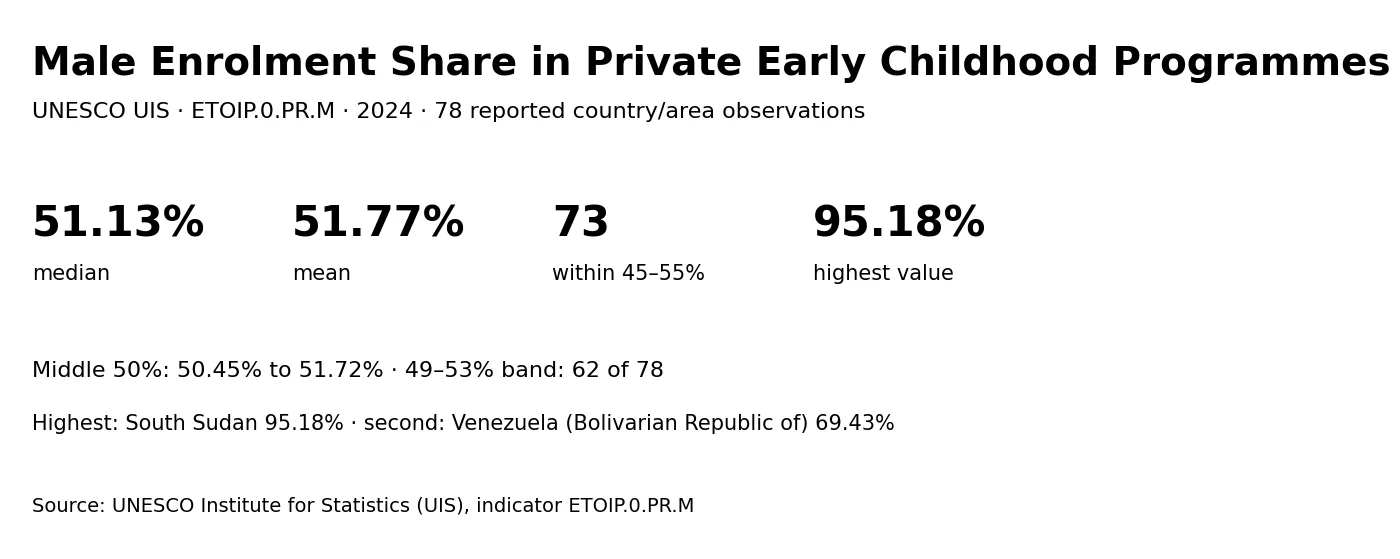
Of the 78 observations, 73 lie between 45% and 55%, and 62 are within the narrower 49–53% band. The highest observation, South Sudan at 95.18%, is far outside that dense center. Venezuela (Bolivarian Republic of), the second-highest, is 69.43%, leaving a gap of 25.75 percentage points. That upper outlier matters because it raises the mean even though most countries and areas remain close to the median.
Table of Contents
The middle of the distribution is unusually compact
The first quartile is 50.45% and the third quartile is 51.72%. The central half of the reported observations therefore spans only 1.28 percentage points. This is a narrow interquartile range for a cross-country dataset. It means that rank differences in the middle can look more substantial than the numeric gaps really are: several positions may separate two countries whose values differ by less than one percentage point.
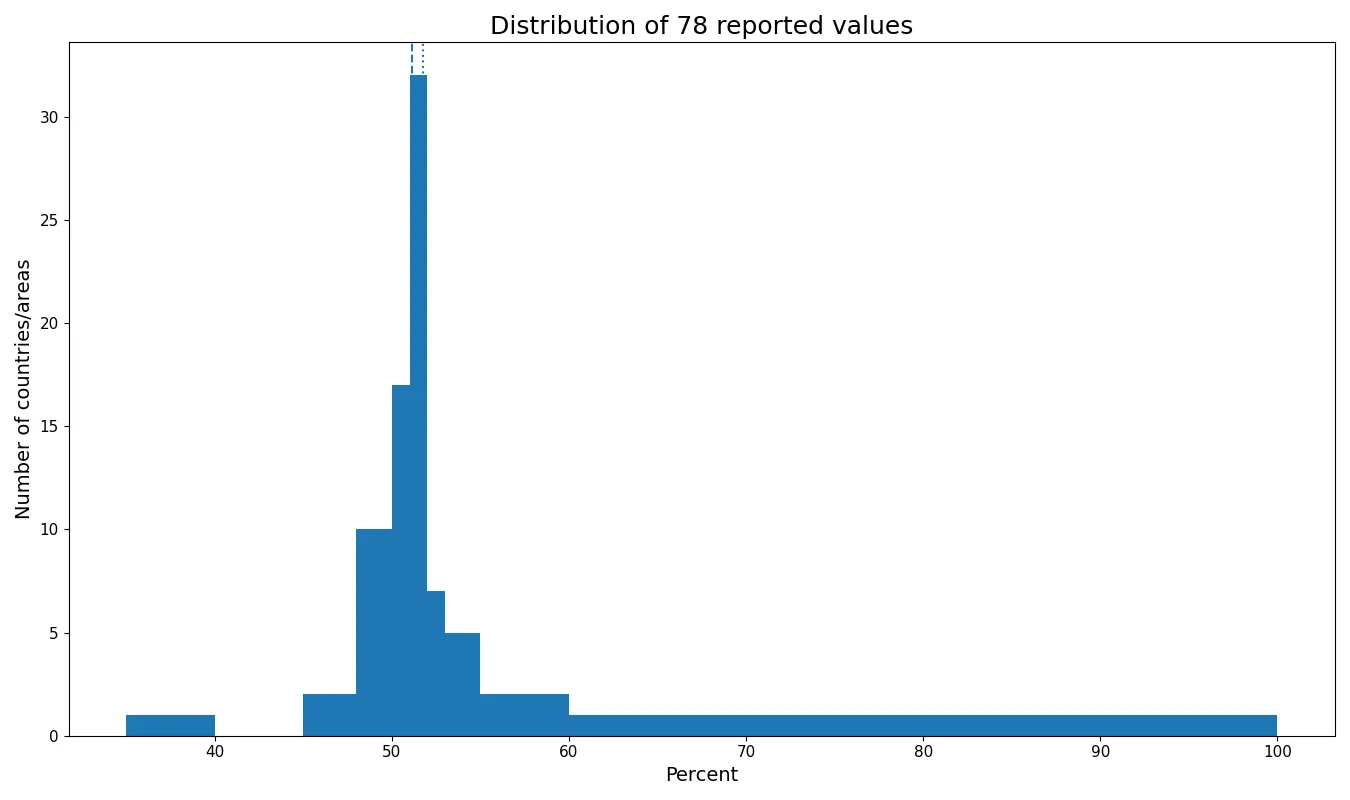
The band counts make the concentration clearer. There is only 1 observation below 45%. Another 12 fall from 45% to under 50%, while 49 are between 50% and under 52%. A further 12 lie from 52% to under 55%, 2 from 55% to under 60%, and only 2 reach 60% or more. The 50–52% interval alone contains well over half of the reported observations.
The mean of 51.77% is about 0.63 percentage points above the median. If the highest observation is removed, the mean of the remaining 77 falls to 51.20%, almost matching the median. This illustrates why the mean should not be treated as a complete description. A single extreme value can shift the average without changing the fact that the typical observation is tightly clustered around 51%.
South Sudan is a clear upper outlier in the 2024 data
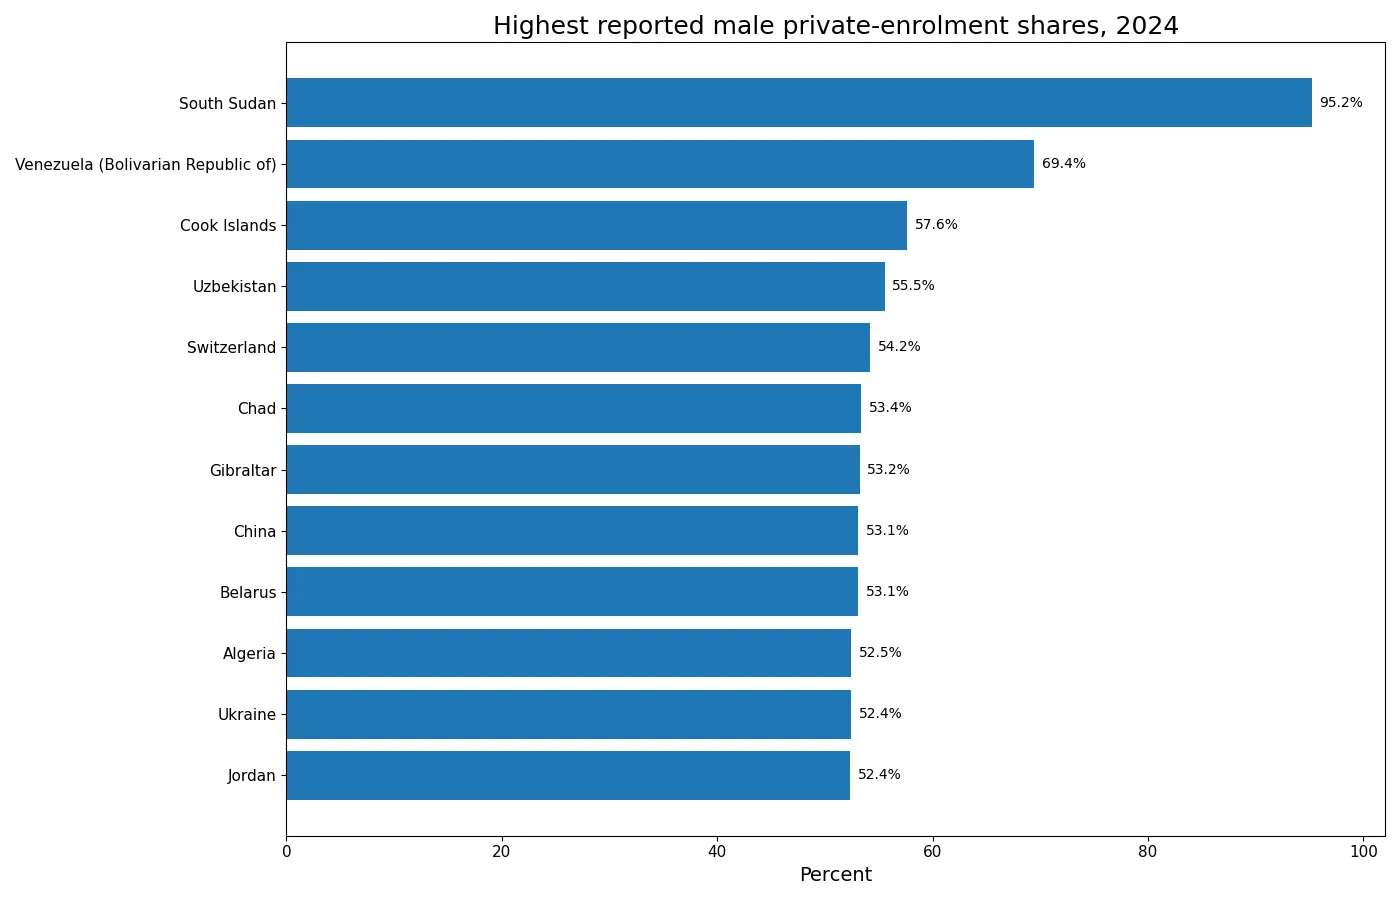
South Sudan has the highest reported value at 95.18%. Venezuela (Bolivarian Republic of) follows at 69.43%, then Cook Islands at 57.63%, Uzbekistan at 55.55%, and Switzerland at 54.17%. The 25.75-percentage-point gap between first and second is much larger than the spacing among most other observations.
| Country or area | 2024 value |
|---|---|
| South Sudan | 95.18% |
| Venezuela (Bolivarian Republic of) | 69.43% |
| Cook Islands | 57.63% |
| Uzbekistan | 55.55% |
| Switzerland | 54.17% |
| Chad | 53.38% |
| Gibraltar | 53.21% |
| China | 53.07% |
| Belarus | 53.06% |
| Algeria | 52.46% |
These values should not be read as a ranking of education quality or access. A high percentage means that a large share of male enrolment in early childhood education programmes is in private institutions. It does not show whether more boys participate in early childhood education overall, whether programmes are affordable, or whether learning conditions are stronger. Those questions require different measures.
The role of private providers can also differ considerably across education systems. In some places, non-government providers may account for a large share of early childhood provision; elsewhere, public institutions may dominate. Two countries with similar percentages can still have very different numbers of children, financing arrangements, regulatory systems, and mixes of public and private providers. The percentage captures composition, not the full institutional context.
The lower end is much less dispersed than the upper tail
Armenia has the lowest reported value at 38.16%. San Marino follows at 46.55%, Seychelles at 47.26%, Senegal at 48.08%, and Bahamas at 48.12%. Except for Armenia, even the lowest observations are above 45%. The low end is therefore relatively compressed, while the high end contains the much larger departures from the central cluster.
| Country or area | 2024 value |
|---|---|
| Armenia | 38.16% |
| San Marino | 46.55% |
| Seychelles | 47.26% |
| Senegal | 48.08% |
| Bahamas | 48.12% |
| Monaco | 48.31% |
| Côte d'Ivoire | 48.79% |
| Dominican Republic | 49.44% |
| Honduras | 49.52% |
| Pakistan | 49.54% |
A low value does not mean low participation in early childhood education. The denominator is male enrolment in early childhood education programmes, and the numerator is the portion of that enrolment in private institutions. A value of 40%, for example, says that four in ten enrolled boys are in private institutions under the indicator definition. It does not say that 40% of all boys are enrolled in early childhood education.
The same distinction applies to absolute numbers. A large country with a private share near 50% can have far more boys in private early childhood programmes than a small territory with a share above 60%. The percentage alone cannot identify where the largest number of privately enrolled boys is located. That would require male enrolment counts in both private institutions and the full early childhood system.
The sorted profile shows how flat the center really is
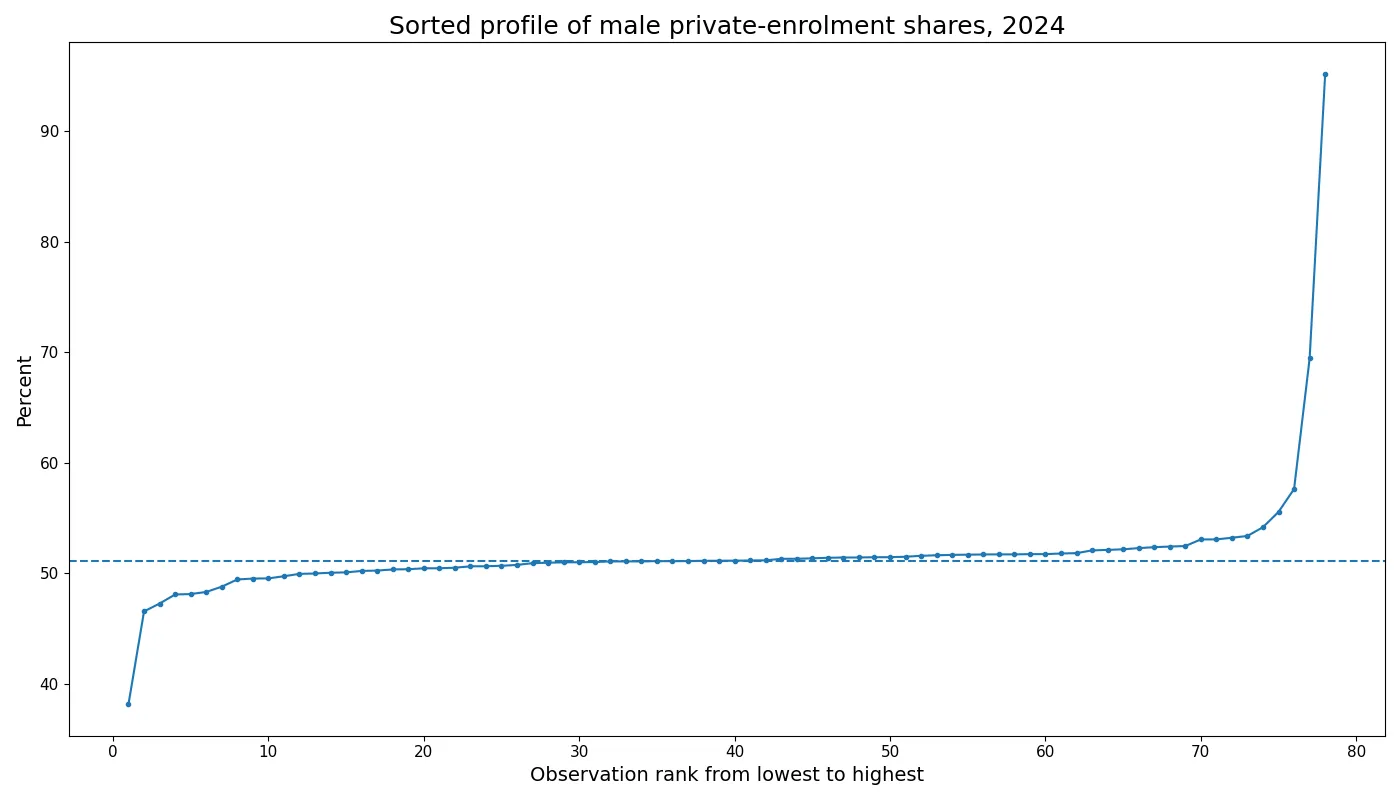
When the observations are sorted from lowest to highest, the curve rises fairly quickly from Armenia into the upper 40s, then becomes almost flat through a long stretch around 50–52%. It rises gradually through the low-to-mid 50s before turning sharply upward at the final observations. The graph therefore separates two facts that a simple range cannot: the total range is wide, but the typical values are not widely dispersed.
This pattern also cautions against over-interpreting rank positions near the center. A country at 51.0% and another at 51.3% may be separated by several places in a list, yet the difference is only three-tenths of a percentage point. The data do not contain uncertainty intervals or institutional explanations that would establish whether such a small numeric difference is substantively important.
No reported row is zero or missing, but coverage is incomplete
All 78 reported rows contain numeric values, and there are no official zero observations in the 2024 extract. However, the UIS catalogue contains countries and territories that do not have a reported value in this set. Those absent units must remain unreported rather than being assigned zero. Zero-filling would create artificial low values and distort the distribution.
Coverage also affects the language used for extremes. It is accurate to say that South Sudan is highest and Armenia is lowest among the 78 reported observations. It would be stronger than the evidence to call them the highest or lowest in the entire world because countries without reported 2024 values are outside the comparison.
A male-only indicator cannot establish a gender gap by itself
The final M in the indicator code denotes the male series. A value near 51% must not be interpreted as saying that males make up 51% of all enrolment and females 49%. The statistic instead describes the private-institution share within male enrolment. A gender comparison would require the corresponding female measure defined for the same programme level, institutional category, geography, and year.
Matching definitions is particularly important in early childhood statistics because adjacent UIS series can refer to different programme levels or population groups. Comparing the male value from one series with a female value from a different education level would create a misleading gender contrast. The 2024 male cross-section is useful on its own for describing institutional composition, while gender balance requires a separate paired analysis.
A single 2024 cross-section cannot establish a trend
The data compare countries and areas in one reference year. They cannot show whether the private share of male enrolment is increasing or decreasing. A trend would require observations from multiple years of the same ETOIP.0.PR.M series, with attention to any changes in definitions or reporting coverage.
A change in percentage also should not be confused with a change in the number of enrolled boys. The private share can rise while the total number of male enrolments falls, or remain stable while total enrolment expands. Time-series analysis is strongest when percentage composition and underlying enrolment counts are considered together.
Source and the main 2024 pattern
The values are from UNESCO Institute for Statistics indicator ETOIP.0.PR.M for 2024. The source observations are available through the UNESCO UIS Data API. The comparison keeps the published percentage values as reported and does not substitute zeros for countries without a 2024 observation.
The main pattern is a dense center combined with a pronounced upper outlier. The median is 51.13%, the middle half lies between 50.45% and 51.72%, and 73 of 78 observations are between 45% and 55%. At the same time, the maximum reaches 95.18%. Reading both the central concentration and the exceptions gives a more accurate picture than relying on the mean or the full range alone.
Frequently Asked Questions
What does ETOIP.0.PR.M measure?
It is the percentage of male enrolment in early childhood education programmes that is in private institutions, reported by UNESCO UIS.
Does a value of 51% mean 51% of all boys attend early childhood education?
No. It means about 51% of boys already enrolled in early childhood education programmes are in private institutions under this indicator.
Should countries without a reported 2024 row be treated as zero?
No. Unreported countries must remain missing rather than being converted to zero.
Why compare the median with the mean?
The mean is 51.77% and the median is 51.13%. The very high South Sudan observation raises the mean, so the median and quartiles better describe the dense center.
Related Articles
Green Map creates custom-edited map images using open geographic data sources such as geoBoundaries, Natural Earth, OpenStreetMap, and government open data. These maps are edited visual materials, not raw data files, and are provided for education, documents, presentations, and graphic reference.