How different are female and male student-mobility rates when students leave their home country to study in the Pacific region? UNESCO Institute for Statistics (UIS) data for 2023 provide a country-level answer through the adjusted gender parity index (GPIA) for the outbound mobility ratio to the Pacific. The index is designed to show the relative balance between female and male values, not the overall volume of international students.
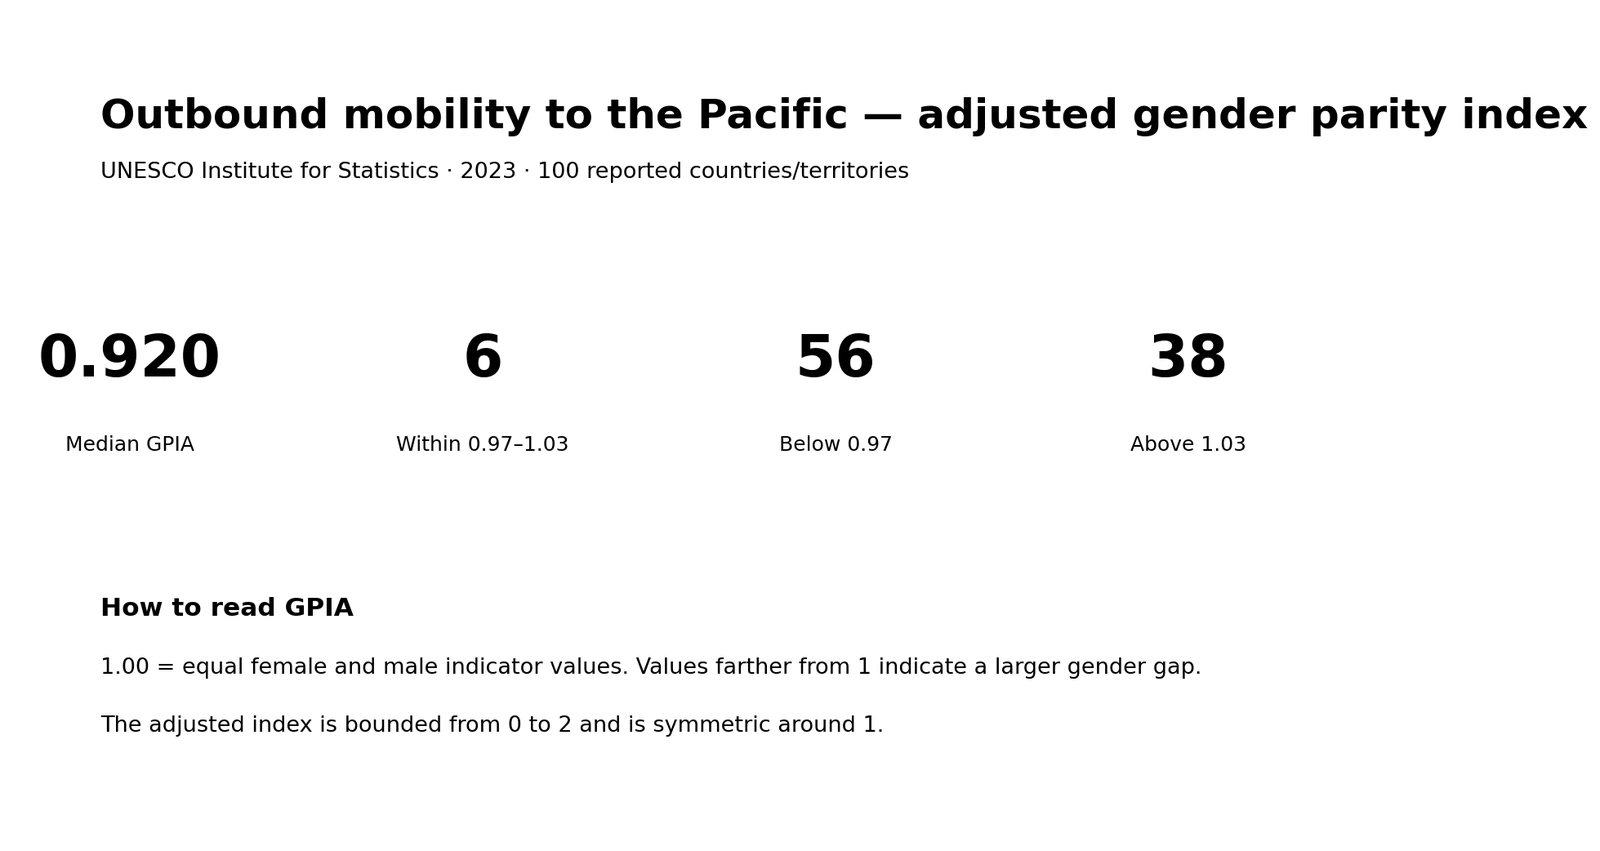
The file contains 100 reported countries and territories, all for 2023. There are no missing values within those 100 rows, but the dataset does not cover every country in the UIS catalogue. Places that are absent from the file should therefore remain unreported rather than being treated as zero. Five rows do contain an official value of zero, and those zeros are preserved as observations.
Table of Contents
What this GPIA actually measures
UIS defines the outbound mobility ratio as the number of students from a given country who study abroad, expressed as a percentage of total tertiary enrolment in their country of origin. The measure can be disaggregated by sex and by destination region or continent. The indicator used here narrows the destination to the Pacific and then compares the female and male outbound-mobility ratios.
A conventional gender parity index compares the female value of an indicator with the male value. UIS uses an adjusted parity formulation because an ordinary ratio is not symmetric around 1. When a female-to-male ratio is above 1, the adjusted method transforms it so that equal-sized gaps on either side of 1 have equal distance. The resulting GPIA is bounded from 0 to 2. A value of 1 means equal female and male values; a value below 1 points to a lower female outbound-mobility ratio, while a value above 1 points to a higher female outbound-mobility ratio.
That interpretation is deliberately narrow. GPIA does not tell us how many students study abroad, how large the underlying mobility ratios are, or whether a high or low level of mobility is desirable. Two countries can have very different outbound-mobility levels and still have similar GPIA values if the female and male rates are balanced in a similar way.
Only six reported countries fall inside the 0.97–1.03 parity band
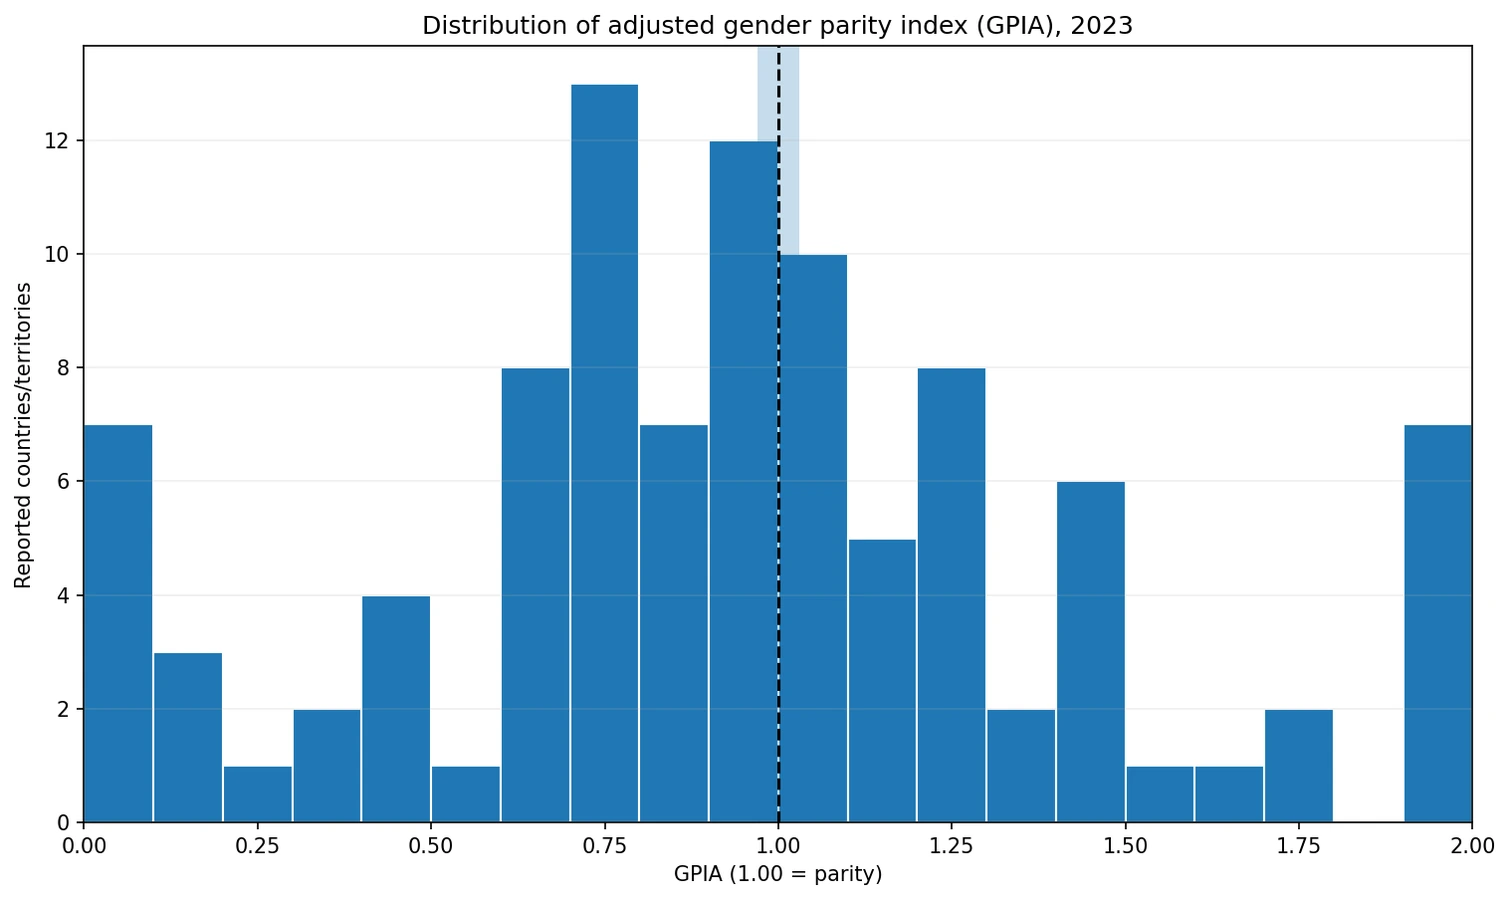
Across the 100 observations, the median GPIA is 0.920 and the mean is 0.945. Both sit below 1, but the median is the more useful quick summary because the adjusted index has boundary values at 0 and 2. The middle of the reported distribution therefore lies on the side where the female outbound-mobility ratio is lower than the male ratio.
Using the 0.97–1.03 range that UIS commonly uses as a practical parity interval, six reported countries are inside the band. Fifty-six are below 0.97 and 38 are above 1.03. In other words, 94 of the 100 reported observations lie outside that narrow parity interval. The important point is not that one side is universally dominant; rather, country experiences are dispersed on both sides of 1, with relatively few observations clustered very close to parity.
The countries closest to 1 provide the clearest parity examples
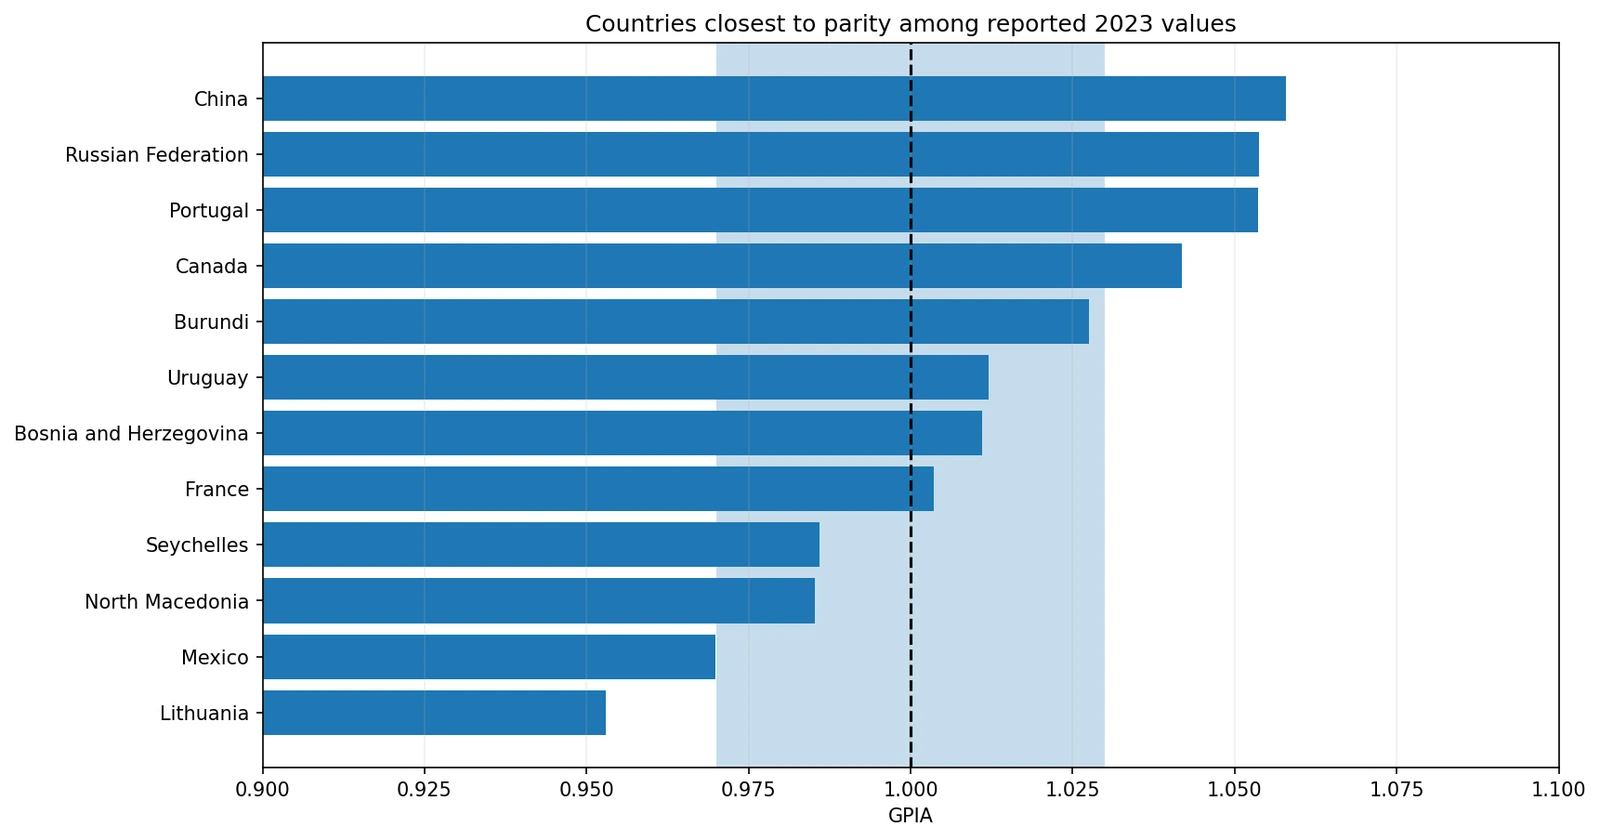
Because this is a parity index, ranking countries from “highest” to “lowest” would be misleading. The more informative comparison is distance from 1. France is closest in the 2023 file at 1.0035. Bosnia and Herzegovina follows at 1.0111, then Uruguay at 1.0121. Seychelles, at 0.9860, and North Macedonia, at 0.9852, are also very close to the parity point.
| Country | 2023 GPIA | Distance from 1 |
|---|---|---|
| France | 1.0035 | 0.0035 |
| Bosnia and Herzegovina | 1.0111 | 0.0111 |
| Uruguay | 1.0121 | 0.0121 |
| Seychelles | 0.9860 | 0.0140 |
| North Macedonia | 0.9852 | 0.0148 |
| Burundi | 1.0276 | 0.0276 |
These values do not mean that the listed countries have the highest outbound student mobility to the Pacific. They mean that the female and male mobility ratios are relatively similar. A country with very low mobility for both sexes could have a GPIA near 1, and a country with high mobility for both sexes could sit far from 1 if the two rates differ substantially.
Why some observations sit at 0 or 2
The 2023 data contain five observations at 0 and six at 2. Those are the lower and upper boundaries of the adjusted index. A boundary value signals a very large difference in the underlying female and male indicator values, but it should not be interpreted as “no international students” or as a direct percentage.
The dataset used for this analysis contains the GPIA result, not the two underlying sex-specific mobility ratios. That prevents a responsible reconstruction of the exact female and male rates from the index alone. A value at 0 or 2 is therefore best treated as an extreme parity result that should be followed up with the underlying sex-disaggregated series before explaining the mechanism behind it.
The distribution is broad on both sides of parity
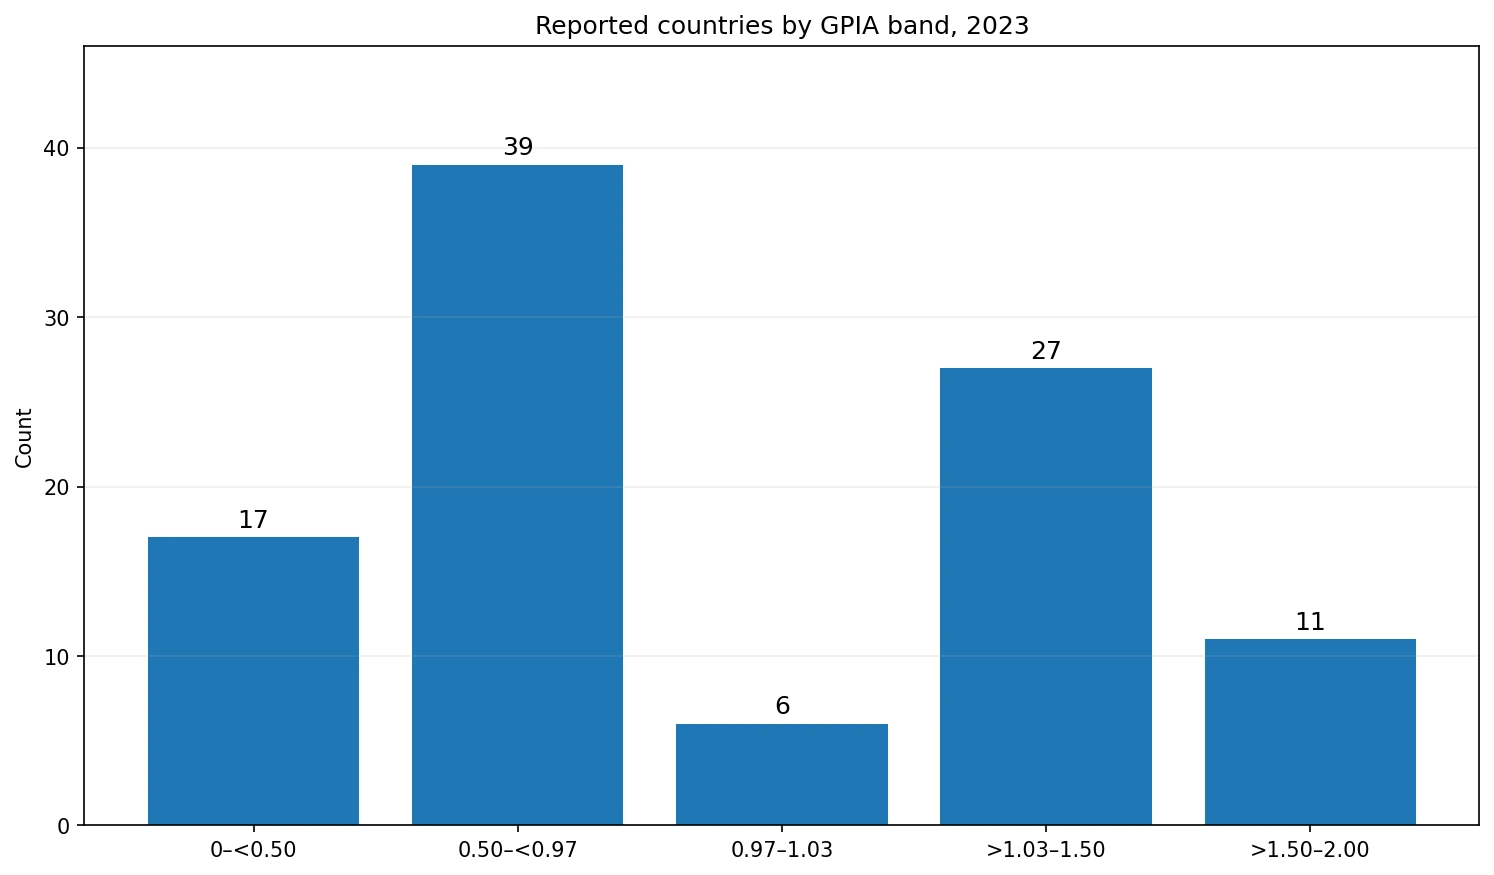
Seventeen observations fall from 0 to below 0.50, and another 39 fall from 0.50 to below 0.97. The 0.97–1.03 parity band contains six. On the other side, 27 observations are above 1.03 and up to 1.50, while 11 are above 1.50 and up to 2.00. The single largest group is therefore the 0.50–0.97 band, but the upper side of the distribution is also substantial.
This shape matters for interpretation. It would be inaccurate to summarize the data as if all countries shared one direction of gender difference. The reported set includes sizable gaps below 1, sizable gaps above 1, a small group close to parity, and several values at the index boundaries. The main geographic conclusion is heterogeneity rather than a single global pattern.
What the index can tell us
The index is useful for identifying where female and male outbound-mobility ratios toward the Pacific are relatively balanced and where they differ sharply. Because every observation in this file refers to 2023, cross-country comparisons do not mix different observation years. That is an advantage over “latest available value” tables in which each country may come from a different year.
It is also useful for screening cases that deserve deeper study. Countries close to 1 can be examined to see whether parity is achieved at high or low mobility levels. Countries far from 1 can be checked against the underlying female and male series, destination choices, tertiary enrolment structures, and student-flow counts. GPIA helps identify the question; it does not supply all of the explanatory variables.
What the index cannot explain on its own
GPIA does not identify destination countries within the Pacific, fields of study, degree levels, scholarship access, household income, migration policy, or institutional recruitment. It also cannot distinguish whether a change in parity came from the female rate moving, the male rate moving, or both. Those questions require the original sex-specific mobility ratios and other contextual data.
The denominator also matters. The outbound mobility ratio is expressed relative to total tertiary enrolment in the origin country. A small tertiary system with a large share of students abroad can have a very different mobility profile from a large system even when their parity indices are identical. GPIA standardizes the gender comparison, not the broader educational context.
Coverage and zero values require careful handling
The 100-row file is a reported-data subset, not a complete world census. Many catalogue countries and territories are absent. Those absent units are not zero and should remain “no reported value” in any map or table built from this series. By contrast, the five explicit zeros in the file are official observations and should not be discarded merely because they look unusual.
This distinction is especially important for visualization. Filling missing countries with zero would create artificial extreme disparities and could make a world map look far more polarized than the underlying data support. The charts here use only the 100 reported observations and preserve official zeros exactly as supplied.
Official source and interpretation notes
The numeric series comes directly from the UNESCO UIS Data API for indicator MOR.5T8.40516.GPIA. UIS defines the outbound mobility ratio as students from a country studying abroad as a percentage of total tertiary enrolment in that origin country. The symmetry and 0–2 range of the adjusted parity index follow the UIS parity-index methodology.
The safest way to use this indicator is to separate two questions: “How balanced are female and male mobility ratios?” and “How much student mobility is there?” GPIA answers the first question. The underlying mobility ratios and student counts are needed for the second.
Frequently Asked Questions
What does a GPIA of 1 mean?
It means the female and male values of the underlying outbound-mobility indicator are equal. The farther the value is from 1, the larger the relative gender difference.
Why use the 0.97–1.03 range?
UNESCO UIS commonly uses this narrow interval as a practical parity band. Six of the 100 reported 2023 observations in this dataset fall inside it.
Should countries missing from the file be treated as zero?
No. An absent country is unreported, not zero. Only the five rows that explicitly contain an official value of zero should be treated as zero observations.
Does a high GPIA mean a country has high student mobility?
No. GPIA describes the balance between female and male mobility ratios. The underlying mobility ratios or student counts are needed to measure the overall level of mobility.
Related Articles
Green Map creates custom-edited map images using open geographic data sources such as geoBoundaries, Natural Earth, OpenStreetMap, and government open data. These maps are edited visual materials, not raw data files, and are provided for education, documents, presentations, and graphic reference.