The share of upper-secondary teachers who have received the minimum organized teacher training required in their country varies widely across economies. World Bank indicator SE.SEC.TCAQ.UP.ZS provides 128 latest available country and territory observations. The median is 89.81% and the simple mean is 79.81%. Burundi has the lowest latest value at 5.99% in 2020, followed by Madagascar at 15.89% in 2019 and Togo at 27.70% in 2021. At the other end, 36 economies report exactly 100%.
The World Bank definition of a trained teacher is specific: the teacher has received the minimum organized teacher training—pre-service or in-service—required for teaching at the relevant level in that country. The indicator therefore does not directly measure academic degrees, years of teaching experience, classroom quality, subject knowledge, or student achievement. National minimum requirements can also differ, which makes the percentage unsuitable as a simple international ranking of teacher quality.
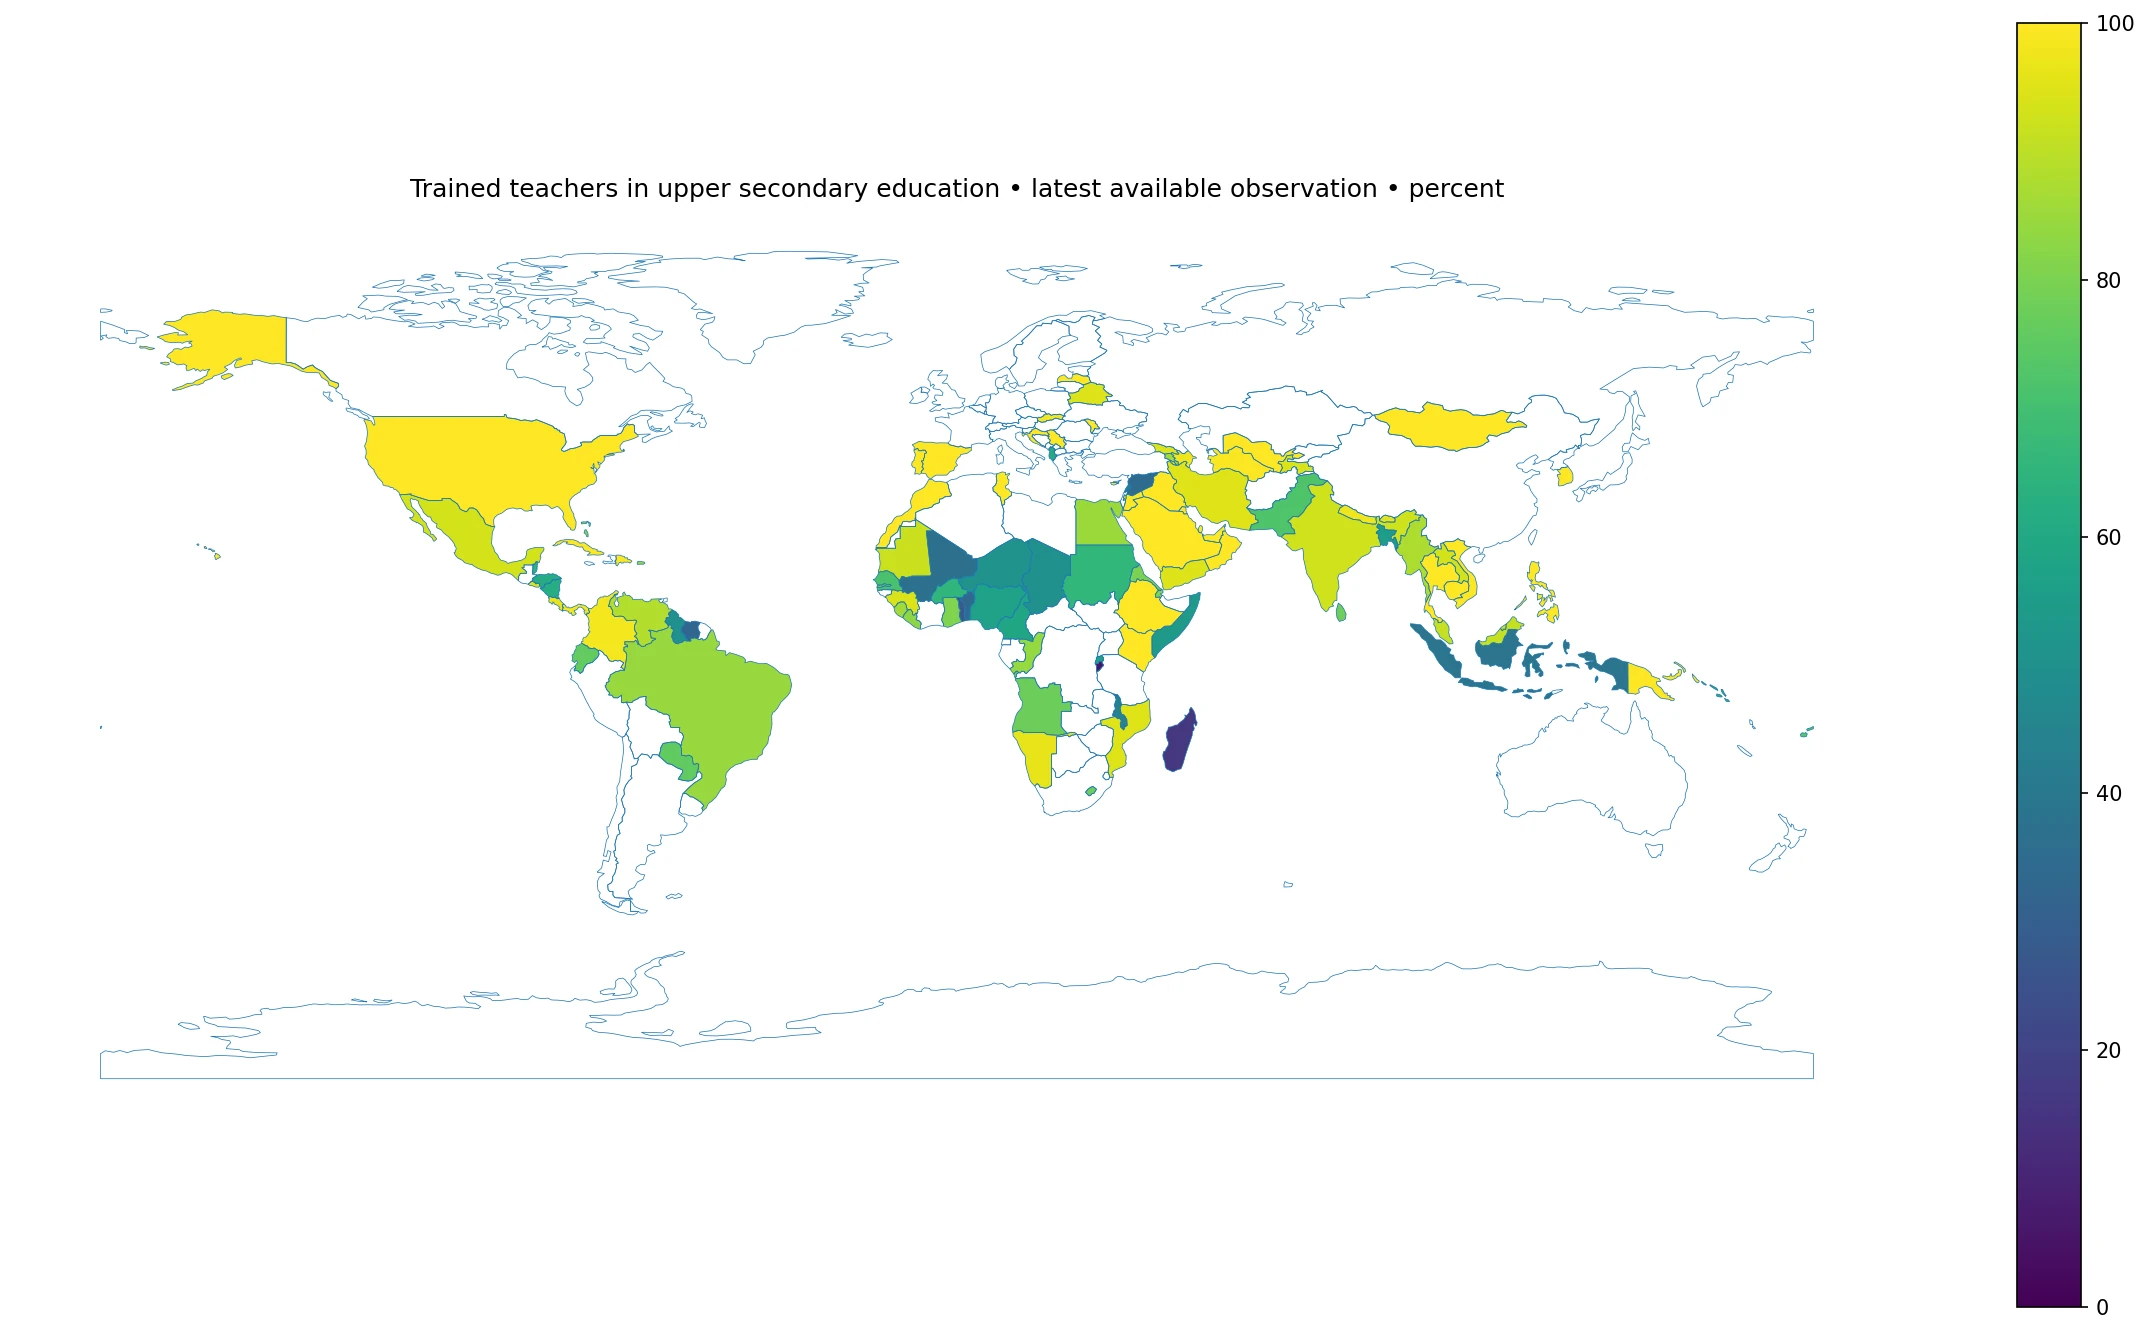
Table of Contents
The median latest observation is 89.81%
The first quartile is 62.76% and the third quartile is exactly 100%. That places the middle half of observations between roughly 62.8% and 100%. Sixty-four economies are at or above 90%, exactly half of the dataset. Fifty-one are at or above 95%, while 19 are below 50%, 28 are below 60%, and 38 are below 70%.
The mean of 79.81% is about ten percentage points below the median because the lower tail extends far downward while the upper tail is capped at 100%. A small set of observations near 6% to 50% pulls the average down substantially. The median and threshold counts therefore describe the typical position more clearly than the mean alone.
Thirty-six economies report exactly 100%
A value of 100% means all upper-secondary teachers included in the indicator are reported as having met the country’s minimum organized teacher-training requirement. Several recent observations are at 100%, including Nauru, Thailand, and Uzbekistan in 2025 and a number of economies in 2024.
It does not mean that every country with 100% applies the same training standard. One system may require a long pre-service professional program, while another may recognize a different route or minimum organized in-service preparation. The percentage measures compliance with a national requirement, not equivalence of credentials across borders.
Many economies sit just below 100%
| Country or territory | Observation year | Trained upper-secondary teachers |
|---|---|---|
| Viet Nam | 2022 | 99.86% |
| Turkmenistan | 2024 | 99.53% |
| Maldives | 2022 | 99.13% |
| Slovak Republic | 2022 | 98.50% |
| Colombia | 2022 | 98.38% |
| Panama | 2014 | 98.08% |
| Azerbaijan | 2024 | 97.92% |
| Nepal | 2025 | 97.67% |
| Gibraltar | 2017 | 96.67% |
| Costa Rica | 2020 | 96.58% |
| Namibia | 2024 | 96.17% |
| Bhutan | 2023 | 95.95% |
The group immediately below 100% contains many values in the high nineties. Differences such as 99.8% versus 100% should not be converted into precise claims about classroom effectiveness. Administrative coverage, teacher definitions, data-reporting practices, and national qualification rules can all affect the observed share.
The indicator also stops distinguishing once the minimum requirement is met. It does not record how much additional training a teacher received, whether professional development is recent, or whether training is aligned with the subject taught. A near-100% share is therefore best understood as broad coverage of the minimum national requirement.
The lowest latest observations show much larger gaps
| Country or territory | Observation year | Trained upper-secondary teachers |
|---|---|---|
| Burundi | 2020 | 5.99% |
| Madagascar | 2019 | 15.89% |
| Togo | 2021 | 27.70% |
| Micronesia, Fed. Sts. | 2021 | 30.35% |
| Suriname | 2023 | 32.78% |
| Benin | 2000 | 33.25% |
| Syrian Arab Republic | 2024 | 34.52% |
| Mali | 2023 | 37.25% |
| Kiribati | 2024 | 37.83% |
| Tonga | 1998 | 37.89% |
| Indonesia | 2025 | 39.00% |
| Malawi | 2011 | 43.46% |
Burundi’s latest value is 5.99% in 2020. Madagascar records 15.89% in 2019, Togo 27.70% in 2021, the Federated States of Micronesia 30.35% in 2021, and Suriname 32.78% in 2023. Benin’s latest observation is 33.25% from 2000, the Syrian Arab Republic is 34.52% in 2024, and Mali is 37.25% in 2023.
A low percentage means a large share of upper-secondary teachers does not meet the minimum organized teacher-training requirement used by that country. The indicator alone cannot explain why. Teacher shortages, rapid enrollment growth, rural staffing, emergency recruitment, qualification reforms, fiscal capacity, and the use of temporary or untrained staff are possible contextual factors that require separate evidence.
Observation-year differences are the dataset’s biggest limitation
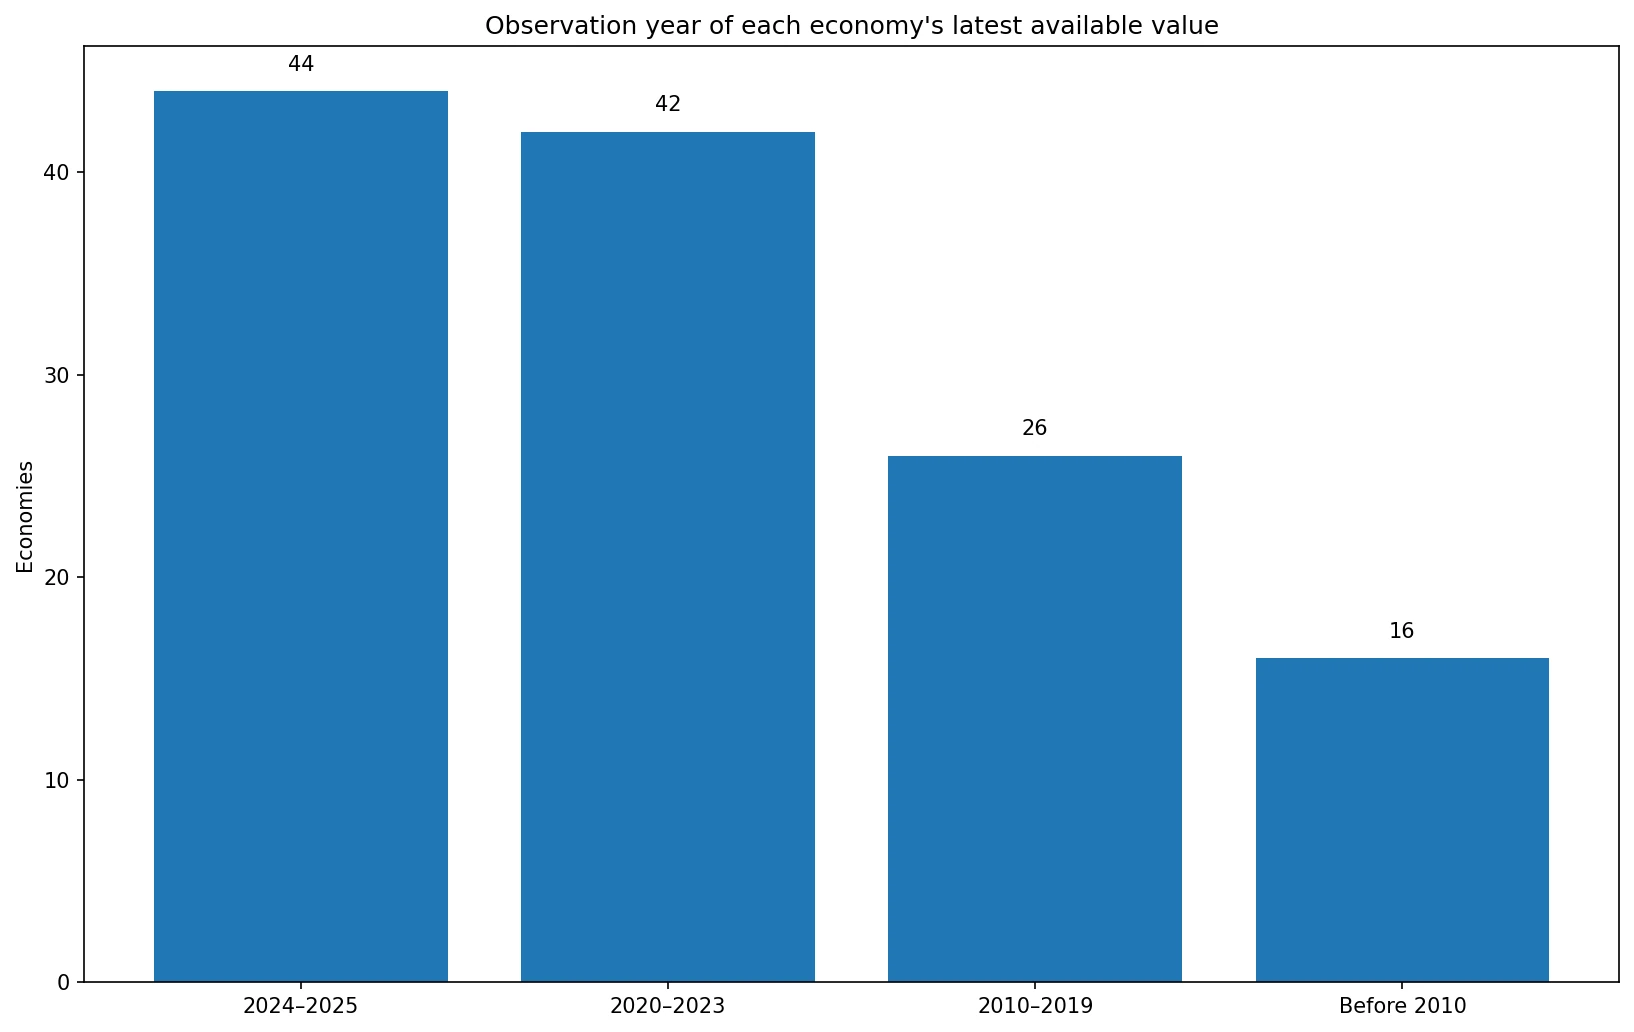
Only 37 latest observations are from 2024 and seven are from 2025. Sixteen are from 2023, ten from 2022, nine from 2021, and seven from 2020. In total, 86 of 128 observations are from 2020 onward. Another 29 are from 2010–2019, while 13 are from before 2010.
The oldest latest observation is from 1998. That means the global map is a latest-available coverage view, not a synchronized picture of the world’s teacher workforce in 2025. A 1998 value and a 2025 value should not be interpreted as if they describe education systems at the same moment.
The 2024 subset has a median of 91.32%
Restricting the data to the 37 economies observed in 2024 gives a median of 91.32% and a simple mean of 83.94%. The first quartile is 72.92% and the third quartile is 100.00%. The lowest 2024 value is 34.52% and the maximum is 100%.
| Lowest 2024 observations | Trained upper-secondary teachers |
|---|---|
| Syrian Arab Republic | 34.52% |
| Kiribati | 37.83% |
| Niger | 51.27% |
| Barbados | 53.61% |
| Bangladesh | 55.23% |
| Rwanda | 58.53% |
| Belize | 64.38% |
| Burkina Faso | 65.33% |
| Pakistan | 72.07% |
| Fiji | 72.92% |
The same-year subset improves temporal comparability, but it covers only 37 economies and is not a representative global sample. Countries appear in the subset because they have a 2024 observation, not because they were selected to mirror the world’s regions or income groups.
Only seven economies have a 2025 observation
The 2025 subset is too small for a broad world ranking. Its median is 97.67% and its mean is 84.60%. Indonesia is lowest at 39.00%, Tuvalu is 62.86%, India 92.66%, Nepal 97.67%, and Nauru, Thailand, and Uzbekistan are at 100%.
A same-year comparison among seven observations is legitimate for those seven economies, but it should not be described as the global situation in 2025. The trade-off is clear: latest-available data increase geographic coverage but mix years, while a strict 2025 filter keeps the date consistent and removes most countries.
Trained teachers is not the same as teachers with university degrees
A teacher can hold a university degree and still fail to meet a country’s organized teacher-training requirement if the degree did not include the required professional preparation. Conversely, a teacher can meet the nationally defined minimum training requirement through a recognized route that is not identical to a particular academic degree.
Questions about teacher qualifications therefore need multiple measures: academic attainment, professional certification, pedagogical preparation, teaching experience, subject specialization, and ongoing professional development. SE.SEC.TCAQ.UP.ZS captures only the minimum organized training component.
The indicator is specific to upper secondary education
The series covers teachers in upper secondary education. It should not be generalized automatically to primary or lower-secondary teachers. Teacher supply, qualification rules, subject specialization, and staffing shortages can differ sharply across education levels within the same country.
A country with near-universal training among upper-secondary teachers could still have lower coverage at another education level, or the reverse. Cross-level comparisons require the corresponding World Bank or UNESCO indicator for each level.
A high share does not directly guarantee stronger student learning
Teacher preparation can matter for classroom practice, but this country-level percentage does not establish a causal relationship with student achievement. Curriculum quality, school resources, class size, learning time, student socioeconomic conditions, leadership, teacher motivation, and assessment systems all influence outcomes.
A serious learning-outcome analysis would combine teacher-training coverage with student assessment data and school-system characteristics. The current indicator is better suited to describing the institutional reach of minimum teacher preparation.
Continuous professional development remains separate
Teachers who already meet the minimum requirement may still need continuing professional development as curricula, technology, assessment methods, and student needs change. The indicator does not show how often teachers receive refresher training or whether professional development is high quality.
This distinction matters especially in countries reporting 100%. Universal compliance with an entry or minimum standard does not mean the professional-development system is complete, current, or equally effective.
Data vintage can be as important as the percentage itself
Benin’s latest observation is from 2000, Tonga’s from 1998, and several other economies have latest values from the 2000s or early 2010s. Education systems can change substantially over such periods through certification reforms, teacher hiring, donor programs, and expansion of secondary schooling.
For current policy comparison, it is often more defensible to restrict the sample to observations from 2020 onward. For maximum country coverage, the full latest-value map is still useful as long as the observation year is shown and older values are not presented as current conditions.
Small economies may not appear clearly on the map
Of the 128 official observations, 100 match directly to polygons in the low-resolution world boundary layer. Some small islands and territories do not have separate polygons or use geographic representations that do not match the layer. Their data remain in the tables and summary statistics.
This matters because some of the 100% observations belong to small states or territories. A map alone can understate the number of economies at the top of the distribution, so exact comparisons should use the tables as well.
Data source and calculation method
The source is World Bank indicator SE.SEC.TCAQ.UP.ZS, ‘Trained teachers in upper secondary education (% of total teachers).’ It is defined as the percentage of upper-secondary teachers who have received the minimum organized teacher training, pre-service or in-service, required for teaching at that level in a given country. The dataset contains the most recent non-empty official observation for each of 128 economies.
The mean, median, quartiles, threshold counts, ranking tables, and observation-year distribution are calculated directly from the 128 official values. Missing values are not replaced with zero. ISO3 country codes are joined to a low-resolution world boundary layer for the map, while unmatched small economies remain in all statistical calculations.
Frequently Asked Questions
Does 100% trained teachers mean teacher quality is identical across countries?
No. It means all covered teachers meet the minimum organized teacher-training requirement defined by their country. National standards and training content can differ.
Is this the percentage of teachers with university degrees?
No. It measures whether teachers received the minimum organized pre-service or in-service teacher training required for teaching at that level.
Are all country values from the same year?
No. The series uses each economy's latest non-empty observation, ranging from 1998 to 2025. Only 37 are from 2024 and seven from 2025.
Related Articles
Green Map creates custom-edited map images using open geographic data sources such as geoBoundaries, Natural Earth, OpenStreetMap, and government open data. These maps are edited visual materials, not raw data files, and are provided for education, documents, presentations, and graphic reference.