Crawford County lies in the forested interior of northern Michigan’s Lower Peninsula, with Grayling serving as the clear settlement and transportation center. The county has relatively few large communities, but it contains an extensive river network, scattered inland lakes, and pronounced uplands in the north and northwest. Lower river valleys become much more visible toward the central and southeastern county.
This page uses the supplied general county, city-distribution, terrain-and-water, and elevation maps to explain those differences. High-resolution JPG originals are available together in a ZIP download for printing, classroom materials, presentations, and detailed reference. The maps are especially useful when read together because Grayling’s road network, the Au Sable and Manistee river systems, and the county’s relief all reinforce one another.
M-72 gives Grayling its main east-west orientation, I-75 provides the north-south corridor, and M-93 continues north from the city. Smaller road labels appear toward the southern boundary, while eastern places such as Lovells sit in a much less urban road environment. The physical landscape becomes more important away from Grayling, where streams and wooded uplands dominate the map.
Table of Contents
Grayling anchors the M-72, I-75, and M-93 road network
Grayling is the strongest road reference on the general county map. M-72 runs east and west through the city, I-75 passes north and south, and M-93 reaches into the northern interior. Roads are relatively concentrated around Grayling, then spread much farther apart as the map moves into forested country.
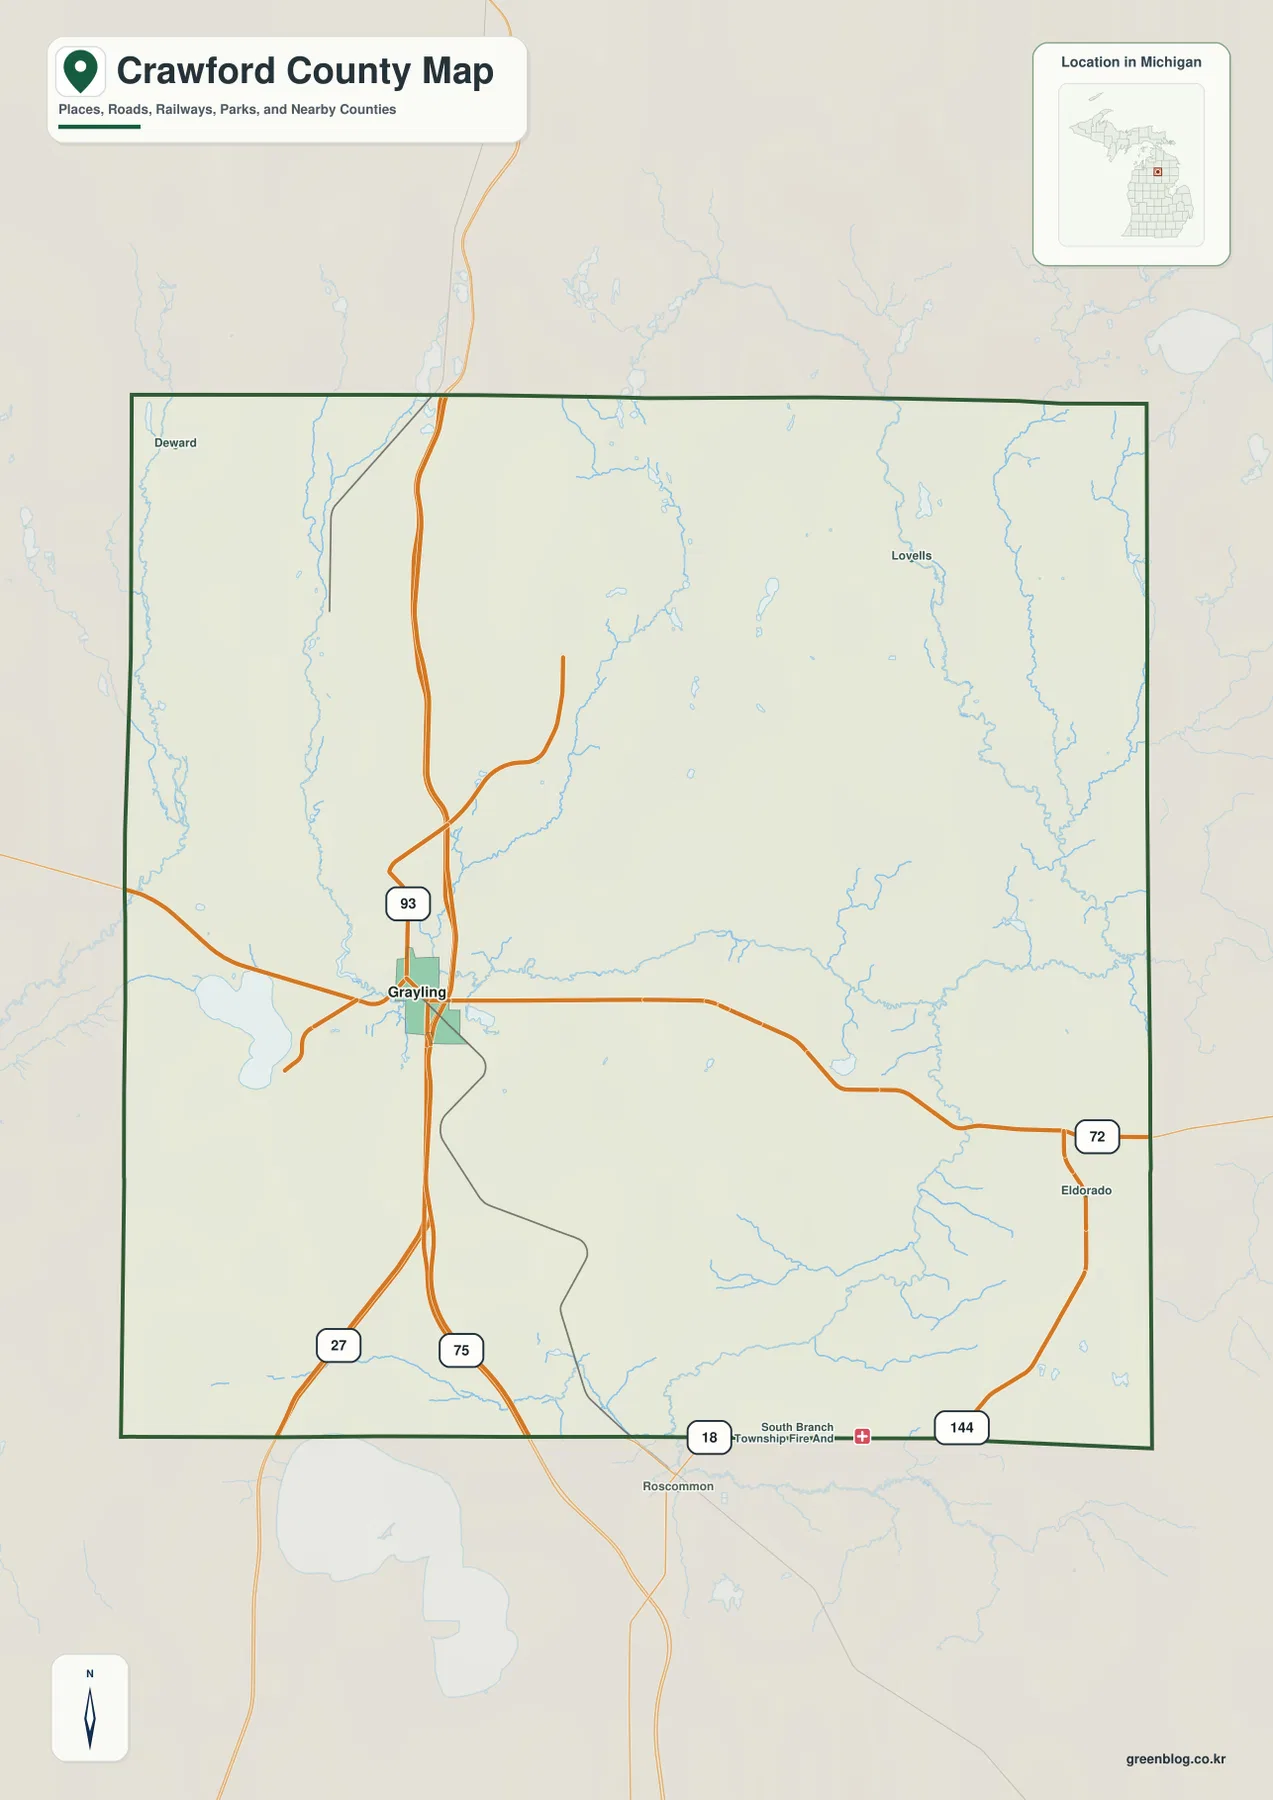
East of Grayling, M-72 continues toward the county boundary while Lovells provides a useful eastern place reference. Settlement labels become sparse in this direction, but stream lines become more numerous. That contrast makes the eastern county feel more like river-and-forest country than an extension of Grayling’s urban road network.
Deward and the northwestern interior show another low-density road setting. M-93 and local routes provide the main orientation, while a rail line offers another north-south reference. When roads are widely spaced, nearby waterways and the direction from Grayling become more useful for understanding location.
South of Grayling, I-75 continues toward Roscommon County and several additional route labels appear near the boundary. The southern map is easier to navigate by major highways than by town names because settlement remains sparse. This general map is a regional reference rather than a live navigation product, so current traffic, construction, and seasonal restrictions should be checked separately.
Grayling stands out as the county’s single highlighted city
The city-distribution map highlights only Grayling. Instead of comparing several ranked communities, it emphasizes how strongly one settlement stands out within a large rural county. There are no connector lines or distance measurements, so the map should be used to understand Grayling’s relative location rather than to estimate travel distance.
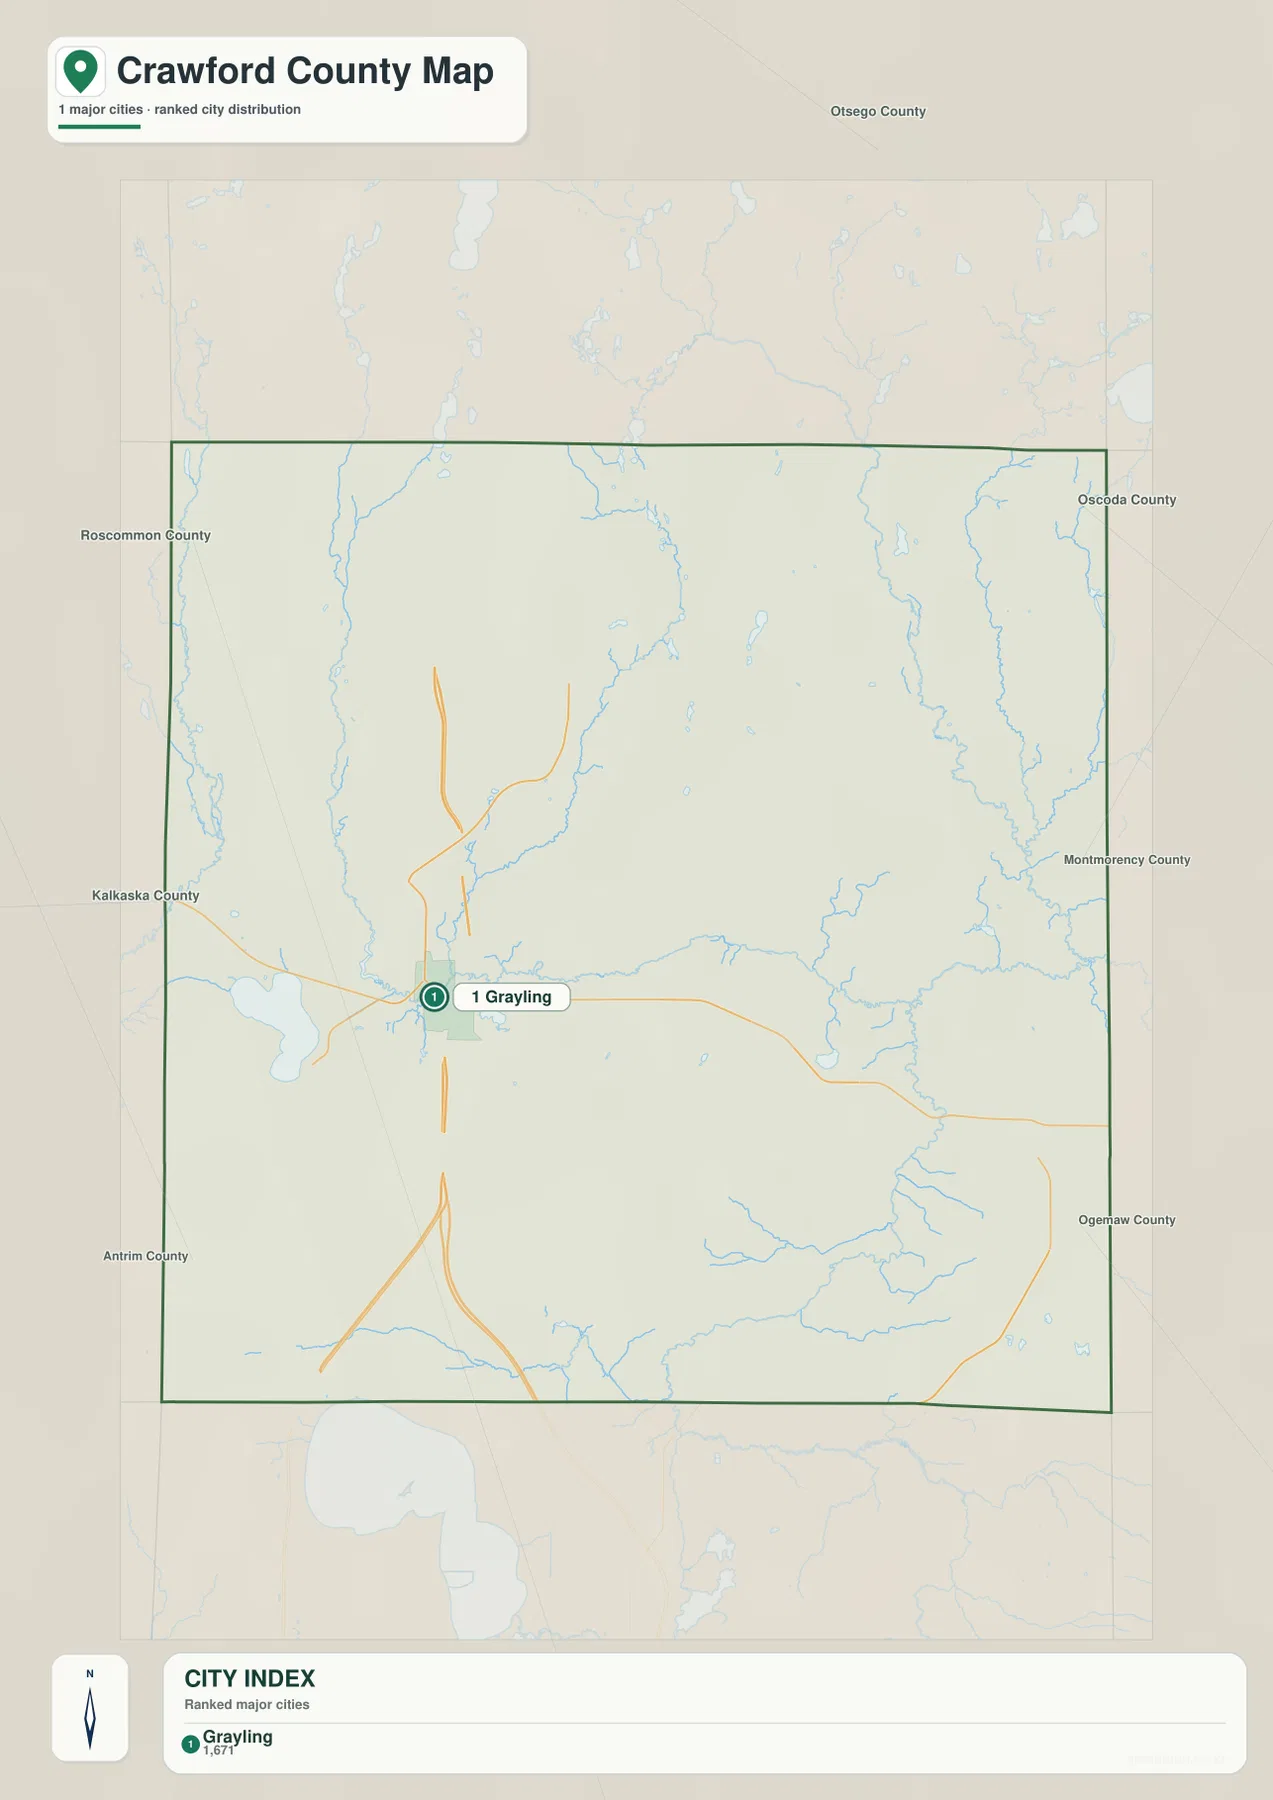
The CITY INDEX lists a reference value of 1,671 for Grayling. That number is best treated as the ranking value used for the map rather than as the latest official population count. Current population estimates should be checked in the relevant U.S. Census Bureau release.
Grayling also aligns with the densest road concentration on the general map. The water map places the city close to Au Sable River drainage, while the elevation surface shows that the city sits below many of the stronger northern uplands. The combined maps therefore explain why transportation and settlement concentrate here.
Lovells, Deward, and other local references appear on the general map but are not ranked as major cities in the simplified city view. Use the city map for the county’s main settlement focus, then return to the general or water map when smaller places and landscape features matter.
Au Sable River branches and the Manistee River define the drainage pattern
The Au Sable River system is the dominant water feature across the central and eastern county. East Branch Au Sable River runs through the interior, while South Branch Au Sable River becomes especially prominent in the southeast. Their tributaries create broad low corridors that match the green valleys on the elevation map.
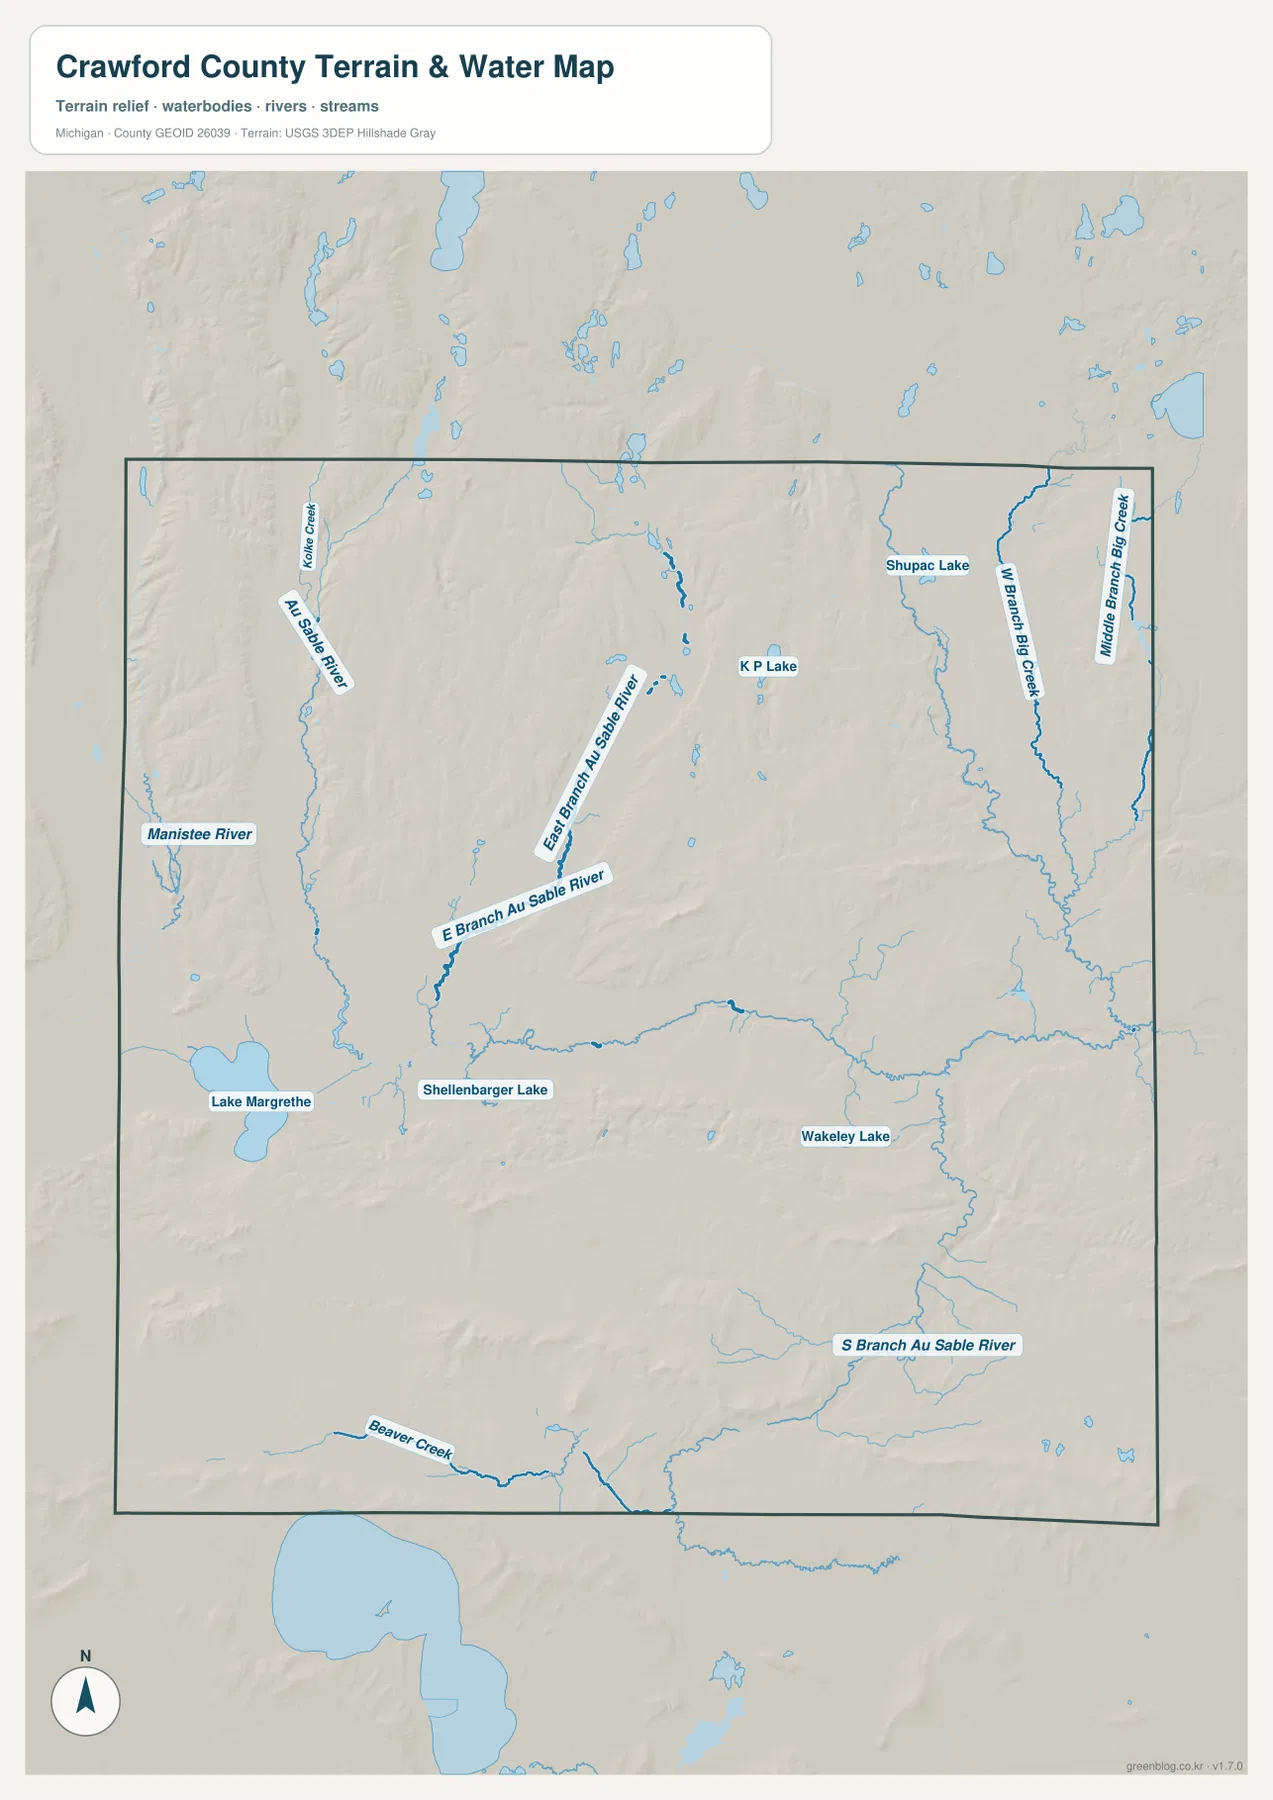
Manistee River occupies the western side near the county boundary, creating a separate major drainage reference from the Au Sable system. Kolka Creek and smaller western tributaries add to that network, while North Branch and Middle Branch Big Creek are visible in the northeast.
Lake Margrethe is the most conspicuous lake near the Grayling side, while Shellenbarger Lake, Wakeley Lake, Shupac Lake, and K P Lake are scattered through the interior. The county is therefore not organized around one large inland lake; its water landscape is a mix of branching rivers, narrow creeks, and smaller lakes.
Beaver Creek appears in the southwest and adds another local drainage reference. These separate waterways show that Crawford County is divided among more than one river system. The water map is a geographic reference, not a flood, navigation, depth, water-quality, or legal-access product.
Northern uplands fall into the Au Sable River valleys
The elevation legend reports an actual county range of about 306 to 467 meters with a mean of 369 meters. Dark green marks the lower terrain, lighter green and yellow show intermediate elevations, and orange to brown identifies higher ridges. The colors are locally scaled for Crawford County and are best used for relative comparison within this map.
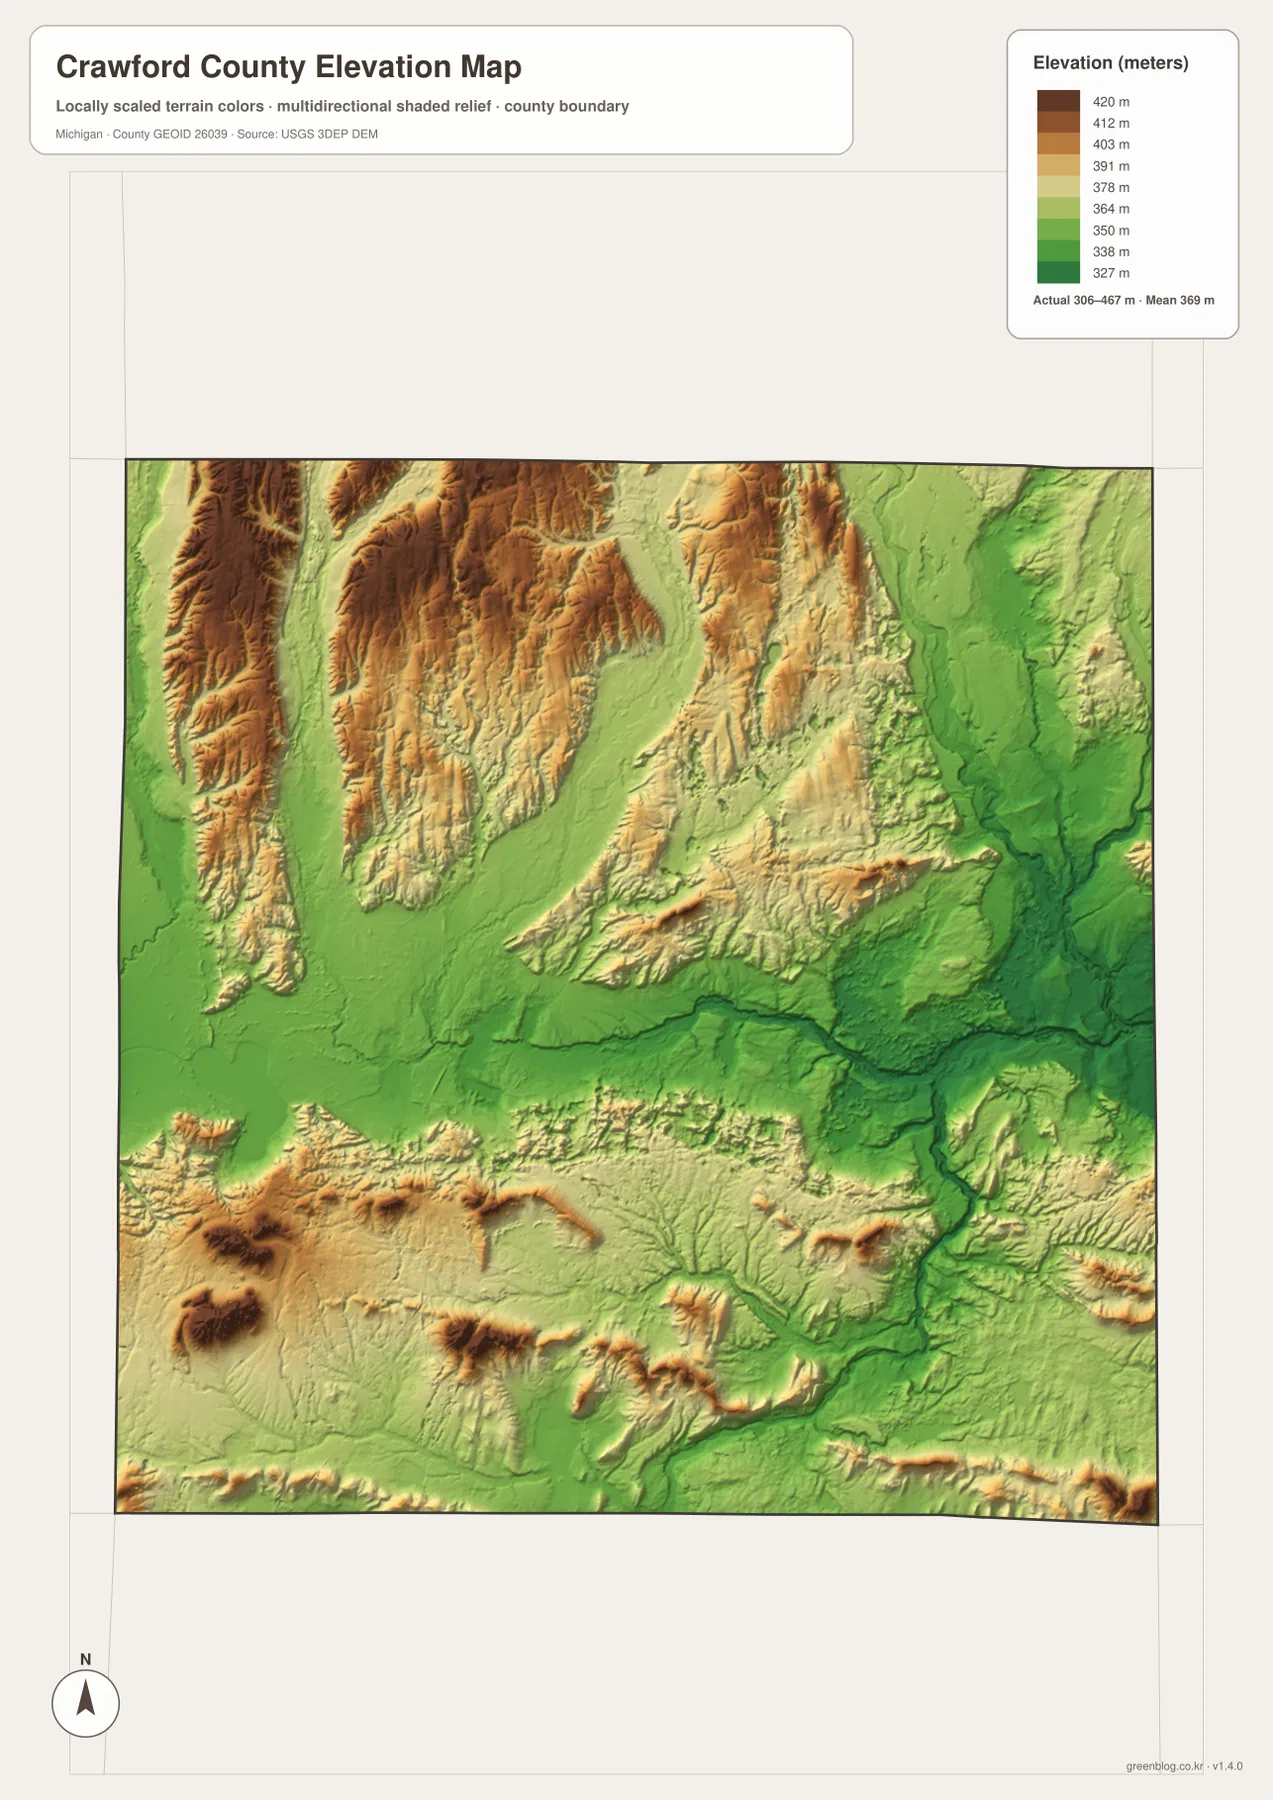
The strongest brown terrain appears across the north and northwest. Long ridges and dissected uplands dominate this part of the county, and narrow green valleys cut between them. The sparse road network north of Grayling overlaps with some of the county’s highest terrain.
Central Crawford County is lower where East Branch Au Sable River and related drainage occupy broad valleys. Those lower corridors continue toward the southeast, where dark green becomes especially prominent along the Au Sable system. The water and elevation maps align closely in this part of the county.
The southwest contains another mixture of ridges and lower basins around the Grayling and Lake Margrethe side. Higher local hills appear again near the southern boundary, so the surface does not simply slope in one direction. Crawford County is better understood as a landscape of upland blocks separated by river valleys.
This county-scale elevation surface is useful for broad terrain comparison but is not survey-grade or engineering-grade measurement. Exact parcel elevations, drainage design, construction, and slope calculations require authoritative detailed elevation data such as the USGS 3D Elevation Program.
Grayling, Lovells, and the western Manistee River side show distinct settings
Grayling is the best place to compare all four views. The general map shows the M-72, I-75, and M-93 junction, the city map makes Grayling the only ranked settlement, the water map places it near Au Sable drainage, and the elevation surface shows lower terrain than many of the northern ridges.
Lovells represents the eastern interior. Roads are sparse, stream corridors are prominent, and Big Creek branches join the broader Au Sable landscape. Relief changes quickly from uplands into lower river valleys, so water and elevation provide better geographic context here than city density.
The western Manistee River side is different again. Major settlement labels are scarce, and the river becomes a stronger locator than streets or urban landmarks. High northwestern ridges and lower western valleys sit close together, creating a terrain pattern distinct from the Au Sable lowlands in the southeast.
The southern county connects Grayling with Roscommon County through I-75 and other route labels, but the South Branch Au Sable River creates a deep low corridor across the terrain. Comparing the general, water, and elevation maps shows why a simple road view does not capture the full shape of this part of Crawford County.
For practical use, the general map is best for roads and named places, the city map for Grayling’s relative position, the water map for the Au Sable and Manistee systems, and the elevation map for the contrast between northern uplands and lower river valleys. Used together, the maps give a fuller picture of the county.
Choosing a Crawford County map and using the high-resolution files
Use the general county map when you need Grayling, M-72, I-75, M-93, and the main place references in one view. The city-distribution map is the simplest way to see Grayling’s location within the county. Choose the terrain-and-water map for the Au Sable River, Manistee River, Lake Margrethe, and smaller lakes, and the elevation map for the northern-upland to southeastern-valley contrast.
The WebP images on this page are optimized for browser viewing. The ZIP below contains the original high-resolution JPG versions of the general county map, city-distribution map, terrain-and-water map, and elevation map. Those originals are better suited to printing, classroom handouts, presentations, and large displays where additional image detail is useful.
Frequently Asked Questions
Which map is best for finding Grayling and the main highways?
Use the general county map. It shows Grayling together with M-72, I-75, M-93, and the other major route labels, making it the clearest road reference. The city-distribution map is useful when you only need Grayling’s relative position within the county.
Which map shows the Au Sable River and Lake Margrethe?
Use the terrain-and-water map. It shows East Branch Au Sable River, South Branch Au Sable River, Manistee River, Lake Margrethe, Shupac Lake, Wakeley Lake, and several smaller streams and lakes. It is a location reference and does not provide flood, depth, navigation, water-quality, or access information.
Where does Crawford County appear highest on the elevation map?
The broadest high terrain is concentrated in the north and northwest, while the Au Sable River corridors in the central and southeastern county are much lower. The legend reports an actual range of roughly 306 to 467 meters with a mean of 369 meters, but exact site elevations should be checked in authoritative elevation data.
Map File Information
The ZIP contains the high-resolution JPG originals for the Crawford County general map, city-distribution map, terrain-and-water map, and elevation map.
- Included Files: general county map, city-distribution map, terrain-and-water map, elevation map
- File Type: JPG
Related Maps
Sources and reference links
For county government and local information, see the official Crawford County website. For boundary and road-reference data, consult U.S. Census Bureau TIGER/Line. Water features can be cross-checked with USGS National Hydrography, and elevation data with the USGS 3D Elevation Program. These page maps are general reference products and do not replace legal boundaries, surveys, navigation charts, or flood determinations.
Green Map creates custom-edited map images using open geographic data sources such as geoBoundaries, Natural Earth, OpenStreetMap, and government open data. These maps are edited visual materials, not raw data files, and are provided for education, documents, presentations, and graphic reference.