UNESCO Institute for Statistics modelled data for 2025 show a wide international spread in the out-of-school rate for youth of upper-secondary school age. Across 206 official national and territorial observations, the simple mean is 24.95% and the median is 18.15%. Niger records the highest value at 85.8%, followed by Afghanistan at 82.1%, Madagascar at 78.1%, Mali at 77.0% and the United Republic of Tanzania at 76.9%.
The first quartile is 6.22% and the third quartile 36.20%, placing the middle half of observations between roughly 6.2% and 36.2%. There are 36 observations at 50% or above and 6 at 75% or above. At the other end, 71 observations are below 10% and 40 below 5%. Three official observations are exactly zero rather than missing.
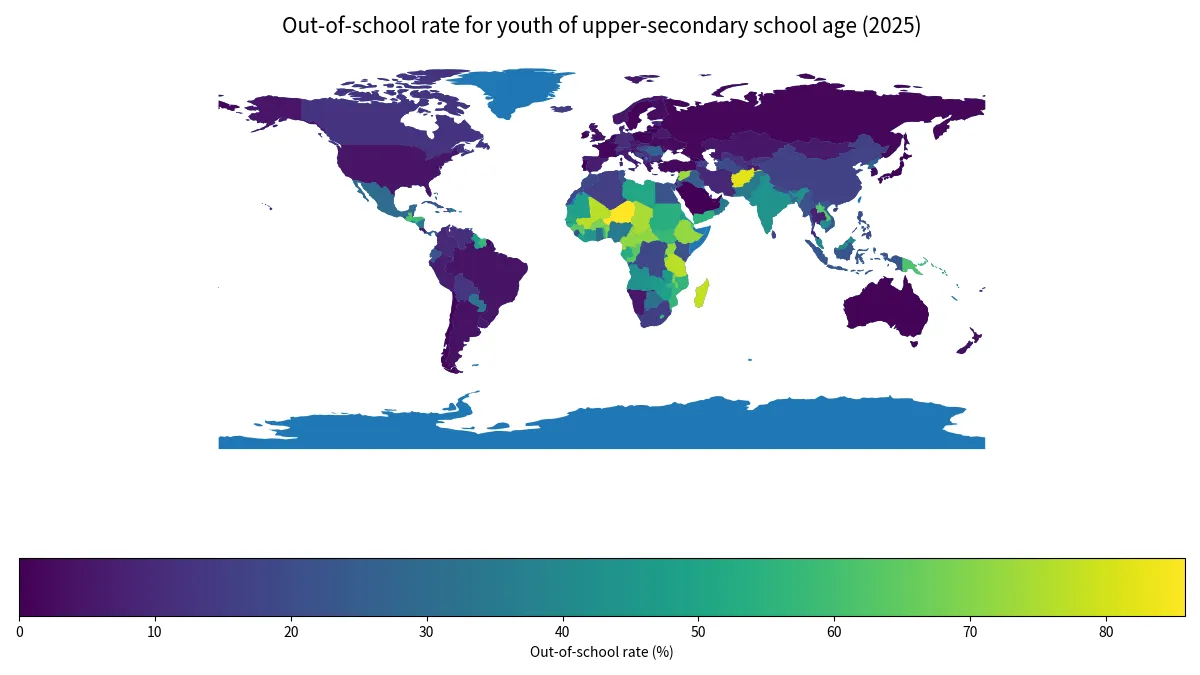
Table of Contents
The indicator measures the out-of-school share of upper-secondary-school-age youth
ROFST.MOD.3 covers youth of the official age for upper secondary education and reports the percentage who are out of school. Both sexes are combined. A higher value means a larger share of young people in that official age group are outside the education system, while a lower value means the out-of-school share is smaller.
The indicator should not be reduced to an upper-secondary dropout rate. Being out of school can arise through several pathways and is not limited to students who entered upper secondary education and then left it. It is also not simply the inverse of an upper-secondary completion rate. These measures describe different parts of educational participation and progression.
The 2025 values are modelled estimates
The title explicitly identifies the series as modelled data. That means the figures should be read as UIS estimates designed for international comparison rather than as one uniform administrative headcount collected in exactly the same way in every country. Modelled estimates can make cross-country coverage more complete, but they should not be interpreted as exact counts of individual young people.
For country-level policy analysis, a modelled international estimate is best used alongside national administrative data, household surveys and information on the estimation method. Small differences of a few tenths of a percentage point should not automatically be treated as meaningful changes in actual headcounts.
Niger and Afghanistan exceed 80%
Niger records 85.8% and Afghanistan 82.1%. Madagascar is at 78.1%, Mali 77.0% and the United Republic of Tanzania 76.9%. Equatorial Guinea reaches 76.4%, Chad 74.6%, Burundi 73.8%, the Syrian Arab Republic 73.3% and Cameroon 71.9%.
The top ten observations average 76.99%. These very high shares indicate that a large part of the official upper-secondary-school-age population is outside school in those settings. The underlying reasons can include access constraints, conflict, household resources, labour, mobility and many other factors, but this single indicator does not isolate causal contributions.
The median is 18.15%, with a long upper tail
The median of 18.15% is well below the mean of 24.95%. The difference of about 6.80 percentage points reflects the influence of many high observations. In this distribution, the median is often a better description of a typical country than the arithmetic mean.
The bottom ten observations average only 0.28%. Portugal is at 0.1%, Georgia and Saudi Arabia are around 0.2% to 0.3%, and Ireland, Japan and Sint Maarten are officially reported at 0%. Those zero values are genuine published observations in this series and should not be confused with unavailable data.
Regional medians show broad geographic differences
Among observations matched to the world boundary, Africa has 48 observations with a median of 52.25%. Asia has 44 observations with a median of 19.10%, Europe 38 with 5.25%, and South America 12 with 10.15%. These are unweighted country medians, not population-weighted regional out-of-school rates.
The regional pattern is visible, but there is also large variation within regions. A continental median cannot replace national context. Conflict exposure, rural access, household income, education capacity and policy design can vary sharply among neighbouring countries.
Large-population countries can have very different rates
India records 43.4%, China 17.0%, the United States 4.6%, Brazil 4.2% and Mexico 29.6%. These are percentages of the relevant age group, not counts of out-of-school youth. A large country can have a lower percentage but still a large number of young people outside school.
That distinction matters when moving from rate comparisons to policy scale. The present dataset is appropriate for comparing prevalence. Estimating how many young people are out of school would require the population size of the official upper-secondary age group for each country.
A low out-of-school rate does not measure every aspect of education
A low rate indicates that most youth in the official age group are participating in education, but it does not directly measure learning quality, completion, grade progression or equality within the education system. Students can be enrolled while still facing learning loss, repetition or future dropout risk.
Similarly, a high rate should not be assigned to a single cause. Economic barriers, school supply, conflict, migration, geographic isolation, household responsibilities and labour-market entry can all matter. Explaining national differences requires disaggregated evidence and country-specific education information.
All 206 official observations for 2025
The table orders all 206 official UIS national and territorial observations from highest to lowest. The three official zero values are preserved. Catalogue areas without a published national observation in this series are not added as zero. The ranking is therefore a descriptive ordering of one modelled indicator, not an overall ranking of education systems.
| Rank | Country or territory | Out-of-school rate |
|---|---|---|
| 1 | Niger | 85.8% |
| 2 | Afghanistan | 82.1% |
| 3 | Madagascar | 78.1% |
| 4 | Mali | 77.0% |
| 5 | Tanzania | 76.9% |
| 6 | Equatorial Guinea | 76.4% |
| 7 | Chad | 74.6% |
| 8 | Burundi | 73.8% |
| 9 | Syria | 73.3% |
| 10 | Cameroon | 71.9% |
| 11 | Ethiopia | 71.9% |
| 12 | Uganda | 71.6% |
| 13 | Central African Republic | 71.5% |
| 14 | Burkina Faso | 68.9% |
| 15 | Malawi | 68.4% |
| 16 | Benin | 68.4% |
| 17 | Tokelau | 67.7% |
| 18 | Guinea | 64.3% |
| 19 | Congo – Brazzaville | 63.7% |
| 20 | Laos | 63.3% |
| 21 | Guatemala | 62.6% |
| 22 | Djibouti | 62.6% |
| 23 | Papua New Guinea | 61.9% |
| 24 | Honduras | 58.9% |
| 25 | San Marino | 58.5% |
| 26 | South Sudan | 57.8% |
| 27 | Lesotho | 57.7% |
| 28 | Suriname | 57.2% |
| 29 | Mozambique | 56.7% |
| 30 | Togo | 56.4% |
| 31 | Yemen | 55.3% |
| 32 | Sudan | 54.1% |
| 33 | Gabon | 53.4% |
| 34 | Guinea-Bissau | 52.3% |
| 35 | Senegal | 52.2% |
| 36 | Libya | 51.0% |
| 37 | Liberia | 49.6% |
| 38 | Solomon Islands | 49.6% |
| 39 | Lebanon | 49.4% |
| 40 | Zimbabwe | 49.0% |
| 41 | Mauritania | 48.4% |
| 42 | Guyana | 47.7% |
| 43 | Eritrea | 47.5% |
| 44 | Zambia | 46.7% |
| 45 | El Salvador | 45.8% |
| 46 | Côte d’Ivoire | 45.4% |
| 47 | Comoros | 45.1% |
| 48 | India | 43.4% |
| 49 | Angola | 42.9% |
| 50 | Cambodia | 42.4% |
| 51 | Malaysia | 40.1% |
| 52 | Rwanda | 36.3% |
| 53 | Micronesia | 35.9% |
| 54 | Nicaragua | 35.2% |
| 55 | Nigeria | 35.0% |
| 56 | Oman | 34.6% |
| 57 | Pakistan | 34.5% |
| 58 | British Virgin Islands | 33.7% |
| 59 | Paraguay | 33.2% |
| 60 | Botswana | 32.1% |
| 61 | Vanuatu | 31.9% |
| 62 | Dominican Republic | 31.9% |
| 63 | Trinidad & Tobago | 31.7% |
| 64 | Ghana | 31.1% |
| 65 | Montserrat | 30.8% |
| 66 | Tuvalu | 30.5% |
| 67 | Bangladesh | 30.3% |
| 68 | Mexico | 29.6% |
| 69 | Tonga | 29.2% |
| 70 | North Korea | 28.1% |
| 71 | Romania | 27.7% |
| 72 | Bhutan | 27.6% |
| 73 | Gambia | 27.2% |
| 74 | Panama | 25.4% |
| 75 | Iraq | 25.0% |
| 76 | Bahamas | 24.4% |
| 77 | Mauritius | 24.4% |
| 78 | Jamaica | 24.3% |
| 79 | Vietnam | 24.1% |
| 80 | Sierra Leone | 23.4% |
| 81 | St. Lucia | 23.2% |
| 82 | Kiribati | 22.9% |
| 83 | Nauru | 22.9% |
| 84 | Indonesia | 22.5% |
| 85 | Ecuador | 22.4% |
| 86 | Egypt | 21.8% |
| 87 | Myanmar (Burma) | 21.6% |
| 88 | Kenya | 21.3% |
| 89 | Timor-Leste | 21.3% |
| 90 | Maldives | 21.3% |
| 91 | Nepal | 21.1% |
| 92 | Bermuda | 20.9% |
| 93 | Belize | 20.7% |
| 94 | Brunei | 20.7% |
| 95 | Tunisia | 20.7% |
| 96 | Cuba | 20.1% |
| 97 | Hungary | 19.7% |
| 98 | Palestinian Territories | 19.6% |
| 99 | Turkmenistan | 19.4% |
| 100 | Philippines | 18.8% |
| 101 | Congo – Kinshasa | 18.6% |
| 102 | Haiti | 18.3% |
| 103 | Morocco | 18.2% |
| 104 | Bosnia & Herzegovina | 18.1% |
| 105 | Jordan | 17.2% |
| 106 | China | 17.0% |
| 107 | Sri Lanka | 16.9% |
| 108 | Azerbaijan | 16.8% |
| 109 | Singapore | 16.4% |
| 110 | Macao SAR China | 16.3% |
| 111 | Cayman Islands | 15.8% |
| 112 | Samoa | 15.7% |
| 113 | Algeria | 15.6% |
| 114 | South Africa | 15.3% |
| 115 | Iceland | 15.0% |
| 116 | Cape Verde | 14.3% |
| 117 | Dominica | 14.1% |
| 118 | Switzerland | 14.0% |
| 119 | Qatar | 14.0% |
| 120 | Kyrgyzstan | 13.4% |
| 121 | Bolivia | 13.3% |
| 122 | Eswatini | 12.7% |
| 123 | Canada | 12.6% |
| 124 | Cook Islands | 12.2% |
| 125 | North Macedonia | 12.0% |
| 126 | Uzbekistan | 12.0% |
| 127 | Anguilla | 11.9% |
| 128 | Seychelles | 11.8% |
| 129 | Fiji | 11.7% |
| 130 | Malta | 11.5% |
| 131 | Bulgaria | 11.5% |
| 132 | Serbia | 11.3% |
| 133 | Venezuela | 10.9% |
| 134 | Germany | 10.8% |
| 135 | Armenia | 10.3% |
| 136 | Andorra | 9.9% |
| 137 | Grenada | 9.8% |
| 138 | São Tomé & Príncipe | 9.6% |
| 139 | Iran | 9.4% |
| 140 | Colombia | 9.4% |
| 141 | Luxembourg | 9.2% |
| 142 | Thailand | 8.0% |
| 143 | Barbados | 7.9% |
| 144 | St. Vincent & Grenadines | 7.9% |
| 145 | Hong Kong SAR China | 7.7% |
| 146 | Albania | 7.6% |
| 147 | Marshall Islands | 7.5% |
| 148 | Slovakia | 7.5% |
| 149 | Estonia | 7.4% |
| 150 | Peru | 7.0% |
| 151 | Spain | 6.7% |
| 152 | Tajikistan | 6.5% |
| 153 | Palau | 6.4% |
| 154 | Niue | 6.3% |
| 155 | Austria | 6.2% |
| 156 | Mongolia | 6.1% |
| 157 | Italy | 6.0% |
| 158 | Antigua & Barbuda | 5.9% |
| 159 | Denmark | 5.8% |
| 160 | Belarus | 5.7% |
| 161 | Uruguay | 5.7% |
| 162 | Croatia | 5.5% |
| 163 | Curaçao | 5.4% |
| 164 | Namibia | 5.3% |
| 165 | Monaco | 5.1% |
| 166 | Norway | 5.0% |
| 167 | Kazakhstan | 4.8% |
| 168 | Czechia | 4.7% |
| 169 | Costa Rica | 4.6% |
| 170 | United States | 4.6% |
| 171 | Brazil | 4.2% |
| 172 | Argentina | 3.9% |
| 173 | Liechtenstein | 3.8% |
| 174 | United Kingdom | 3.7% |
| 175 | Israel | 3.6% |
| 176 | Moldova | 3.5% |
| 177 | Greece | 3.4% |
| 178 | New Zealand | 3.2% |
| 179 | Finland | 2.9% |
| 180 | St. Kitts & Nevis | 2.8% |
| 181 | Turks & Caicos Islands | 2.5% |
| 182 | Ukraine | 2.2% |
| 183 | Türkiye | 1.9% |
| 184 | South Korea | 1.8% |
| 185 | Cyprus | 1.4% |
| 186 | Russia | 1.4% |
| 187 | Netherlands | 1.3% |
| 188 | Belgium | 1.3% |
| 189 | Bahrain | 1.3% |
| 190 | Slovenia | 1.2% |
| 191 | France | 1.1% |
| 192 | Chile | 1.0% |
| 193 | Latvia | 1.0% |
| 194 | Sweden | 1.0% |
| 195 | Montenegro | 0.9% |
| 196 | Poland | 0.8% |
| 197 | Australia | 0.8% |
| 198 | Aruba | 0.7% |
| 199 | Lithuania | 0.5% |
| 200 | United Arab Emirates | 0.3% |
| 201 | Georgia | 0.2% |
| 202 | Saudi Arabia | 0.2% |
| 203 | Portugal | 0.1% |
| 204 | Ireland | 0.0% |
| 205 | Japan | 0.0% |
| 206 | Sint Maarten | 0.0% |
Blank map areas and official zeroes are different
The low-resolution map matches 164 of the 206 official observations. The other 42 observations, mostly small islands and territories, remain in the table and summary statistics. A blank map area can therefore mean that the boundary dataset lacks the geography rather than that the out-of-school rate is zero.
The source also contains three genuine zero values. Keeping published zeroes separate from absent catalogue units avoids turning missing geography coverage into a false educational outcome. This distinction is especially important at the low end of the distribution.
Source and indicator definition
The source is the UNESCO Institute for Statistics Data API, indicator ROFST.MOD.3: “Out-of-school rate for youth of upper secondary school age, both sexes (modelled data) (%)”. The reference year is 2025. All 206 published national and territorial observations are used as reported, with no transformation or zero-filling of absent catalogue areas.
Frequently Asked Questions
Which country has the highest 2025 out-of-school rate for upper-secondary-school-age youth?
Niger has the highest modelled estimate at 85.8%, followed by Afghanistan at 82.1% and Madagascar at 78.1%.
Is ROFST.MOD.3 an upper-secondary dropout rate?
No. It measures the share of youth of official upper-secondary school age who are out of school, not only students who entered upper secondary and then dropped out.
What are the 2025 median and mean?
Across the 206 official observations, the median is 18.15% and the simple mean is 24.95%.
Are zero values created by filling missing data?
No. The source publishes 3 genuine zero observations. Catalogue areas without an observation are not zero-filled.
Related Articles
Green Map creates custom-edited map images using open geographic data sources such as geoBoundaries, Natural Earth, OpenStreetMap, and government open data. These maps are edited visual materials, not raw data files, and are provided for education, documents, presentations, and graphic reference.