The 2024 comparison isolates one narrow U.S. Energy Information Administration series: fueltypeid=DFO, sectorid=98 (Electric Power), field=heat-content, annual frequency, and the 2024 period. All 50 states have a numeric observation. Fixing these facets is essential because the same EIA route also contains other sectors and other fields whose titles can look similar while measuring something different.
Across the 50 states, the mean is 5.8006 and the median is 5.7988. New Jersey is highest at 5.9728, followed by Oklahoma at 5.9453 and Louisiana at 5.9000. Colorado is lowest at 5.6056, followed by New Mexico at 5.6442 and Alaska at 5.6630. The full spread is 0.3672, yet the coefficient of variation is only about 1.08%, so the ranking is much more visually dramatic than the underlying numerical dispersion.
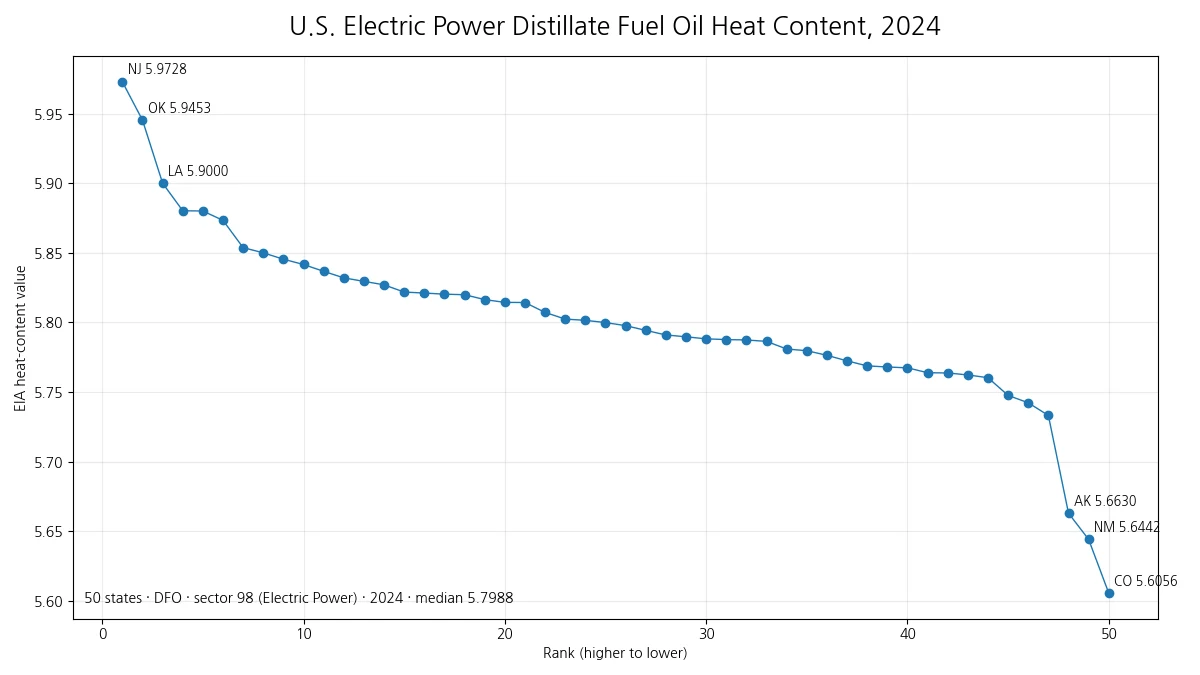
Table of Contents
Sector 98 is the defining boundary of this comparison
This article is not an all-sector fuel comparison. Sector 98 limits the observation to the Electric Power sector. That distinction matters because a 2025 DFO heat-content article on the site uses sector 99, or All Sectors, and includes 50 states plus the District of Columbia. The present 2024 slice contains 50 states and no D.C. observation. The two series therefore differ in both sector scope and coverage, so they should not be connected as a simple year-over-year change.
The same caution applies to other EIA fields. A DFO consumption-for-eg series measures physical fuel used for electricity generation. A total-consumption series answers a broader fuel-use question. A generation series measures electricity output. Heat-content is none of those. Keeping fuel, sector, field, frequency, year, and unit identity separate prevents similar-looking energy statistics from being treated as duplicates or interchangeable measurements.
Most state values sit in a narrow central band
The first quartile is 5.7697 and the third quartile is 5.8289, placing the middle half of states inside a band only 0.0592 wide. 40 of the 50 states are within 1% of the median, and 45 are within 2%. This is a compact distribution. A state can move several positions in the ranking while remaining only a few hundredths away from nearby states.
That concentration changes how the chart should be read. The ordered points are useful for locating the extremes and seeing the overall shape, but the exact table is more informative for close comparisons. A difference in rank is not a percentage gap in fuel quality, and it does not imply a comparable difference in electricity output, fuel use, cost, or emissions.
Ten highest state values
| Rank | State | Value |
|---|---|---|
| 1 | New Jersey | 5.9728 |
| 2 | Oklahoma | 5.9453 |
| 3 | Louisiana | 5.9000 |
| 4 | Montana | 5.8802 |
| 5 | Idaho | 5.8800 |
| 6 | Arkansas | 5.8733 |
| 7 | Michigan | 5.8537 |
| 8 | North Dakota | 5.8500 |
| 9 | Vermont | 5.8454 |
| 10 | Washington | 5.8416 |
New Jersey and Oklahoma form the top pair, with Louisiana at exactly 5.9000. Below them, Montana and Idaho are almost indistinguishable numerically. This is a good example of why a rank should not be treated as a performance score: the ordering is mathematically correct, but many adjacent differences are very small.
Ten lowest state values
| Rank | State | Value |
|---|---|---|
| 50 | Colorado | 5.6056 |
| 49 | New Mexico | 5.6442 |
| 48 | Alaska | 5.6630 |
| 47 | Virginia | 5.7332 |
| 46 | Nebraska | 5.7423 |
| 45 | New York | 5.7476 |
| 44 | Florida | 5.7603 |
| 43 | Tennessee | 5.7623 |
| 42 | Indiana | 5.7637 |
| 41 | Iowa | 5.7639 |
Colorado, New Mexico, and Alaska are the three clearest low-end observations. After those states, the distribution moves back toward the dense center. The bottom tail therefore contributes a meaningful portion of the total range, while most states remain much closer together.
All 50 state observations
| Rank | State | 2024 value |
|---|---|---|
| 1 | New Jersey | 5.9728 |
| 2 | Oklahoma | 5.9453 |
| 3 | Louisiana | 5.9000 |
| 4 | Montana | 5.8802 |
| 5 | Idaho | 5.8800 |
| 6 | Arkansas | 5.8733 |
| 7 | Michigan | 5.8537 |
| 8 | North Dakota | 5.8500 |
| 9 | Vermont | 5.8454 |
| 10 | Washington | 5.8416 |
| 11 | South Dakota | 5.8367 |
| 12 | Nevada | 5.8320 |
| 13 | South Carolina | 5.8295 |
| 14 | Texas | 5.8270 |
| 15 | Kentucky | 5.8218 |
| 16 | West Virginia | 5.8211 |
| 17 | Illinois | 5.8203 |
| 18 | Connecticut | 5.8199 |
| 19 | Georgia | 5.8164 |
| 20 | Mississippi | 5.8144 |
| 21 | Wisconsin | 5.8143 |
| 22 | North Carolina | 5.8072 |
| 23 | Rhode Island | 5.8024 |
| 24 | Utah | 5.8015 |
| 25 | Alabama | 5.7999 |
| 26 | California | 5.7977 |
| 27 | Delaware | 5.7943 |
| 28 | Pennsylvania | 5.7910 |
| 29 | Minnesota | 5.7897 |
| 30 | Massachusetts | 5.7882 |
| 31 | Kansas | 5.7877 |
| 32 | Arizona | 5.7874 |
| 33 | Maryland | 5.7864 |
| 34 | Missouri | 5.7809 |
| 35 | New Hampshire | 5.7797 |
| 36 | Ohio | 5.7764 |
| 37 | Wyoming | 5.7724 |
| 38 | Hawaii | 5.7688 |
| 39 | Oregon | 5.7680 |
| 40 | Maine | 5.7674 |
| 41 | Iowa | 5.7639 |
| 42 | Indiana | 5.7637 |
| 43 | Tennessee | 5.7623 |
| 44 | Florida | 5.7603 |
| 45 | New York | 5.7476 |
| 46 | Nebraska | 5.7423 |
| 47 | Virginia | 5.7332 |
| 48 | Alaska | 5.6630 |
| 49 | New Mexico | 5.6442 |
| 50 | Colorado | 5.6056 |
Heat content is not the amount of fuel consumed
A heat-content value describes an energy characteristic associated with a physical quantity of fuel. It is not the physical amount of DFO consumed. A state with a higher average heat-content value did not necessarily burn more barrels or tons, and it did not necessarily generate more electricity. To compare fuel quantity, use an EIA consumption field. To compare electricity output, use a generation field. Those measures can be combined analytically, but they should not be substituted for one another.
The metric also does not rank power-plant efficiency. Efficiency requires a relationship between energy input and electricity output, usually through a heat-rate or related calculation. Nor does this series directly measure emissions, fuel prices, operating costs, or the share of petroleum in a state power mix. Those are separate questions requiring separate variables.
The unit label deserves caution before engineering use
The source record linked to this series carries the unit label “Btu per short tons.” EIA public thermal-conversion references, however, commonly express distillate fuel oil heat content in million Btu per barrel, and values near 5.7 are typical of that published scale. Because the numeric state observations were supplied as one internally consistent EIA series, this article keeps the reported numbers unchanged and does not invent a ton-to-barrel conversion. Anyone using the values in an engineering calculation should verify the exact API unit metadata and the applicable EIA conversion documentation first.
This caution does not prevent the 50-state ranking from being used descriptively. Every observation comes from the same field, fuel facet, sector facet, year, and route, so relative comparisons within the slice are consistent. The warning matters when an absolute unit is needed for multiplication, conversion, or comparison with another dataset.
The geography does not form a simple regional rule
The highest states are geographically mixed: New Jersey, Oklahoma, Louisiana, Montana, and Idaho appear near the top despite belonging to very different parts of the country. The lower end is also mixed, with Colorado, New Mexico, Alaska, Virginia, and Nebraska. The 2024 cross-section therefore does not support a simple “one region has higher heat content” story.
Differences could reflect the mix of distillate products reported, purchasing patterns, suppliers, plant operations, or other factors, but the state heat-content values alone do not identify a cause. Establishing causation would require additional evidence such as plant-level fuel receipts, sulfur categories, quantities consumed, and generation data.
One year is a snapshot, not a trend
The results describe 2024 only. They do not show whether New Jersey is persistently high, whether Colorado is usually low, or whether the state spread is widening. A valid time-series analysis would keep the electricity/electric-power-operational-data route, DFO fuel facet, sector 98, heat-content field, annual frequency, and compatible unit definition fixed for every year.
The strongest conclusions from the 2024 slice are limited but useful. New Jersey records the highest value at 5.9728; Colorado records the lowest at 5.6056; the median is 5.7988; and 40 states sit within 1% of that median. The central message is therefore not a large state divide, but a tightly clustered Electric Power DFO heat-content series with a few clearer observations at the edges.
Sources
Frequently Asked Questions
Which state has the highest 2024 Electric Power DFO heat-content value?
New Jersey is highest at 5.9728, followed by Oklahoma at 5.9453 and Louisiana at 5.9000 in this EIA series.
Does a higher heat-content value mean a state consumed more distillate fuel oil?
No. Heat content is a fuel-property measure. Physical consumption and electricity generation are separate EIA fields.
Is this the same series as the 2025 DFO heat-content comparison?
No. This dataset uses sector 98, Electric Power, for 2024 and contains 50 states. The 2025 comparison uses sector 99, All Sectors, and has different coverage.
Why is the District of Columbia not included?
This 2024 sector-98 slice contains numeric observations for the 50 states and does not include a comparable D.C. row.
Related Articles
Green Map creates custom-edited map images using open geographic data sources such as geoBoundaries, Natural Earth, OpenStreetMap, and government open data. These maps are edited visual materials, not raw data files, and are provided for education, documents, presentations, and graphic reference.