Travel services accounted for very different shares of service imports across reporting economies in 2024. Among 162 economies with a reported World Bank value, the median was 20.11% and the mean was 21.47%. Albania reached 76.41% and Lesotho 73.90%, while Tajikistan was at 2.03%. The spread shows that the composition of imported services differs sharply even when countries are compared using the same balance-of-payments indicator.
The World Bank indicator is BM.GSR.TRVL.ZS, Travel services (% of service imports, BoP). In balance-of-payments statistics, travel covers goods and services acquired for personal use or to give away by residents while visiting another economy. The percentage therefore measures travel-service debits relative to total service imports. A value of 40% does not mean that travel represents 40% of all imports of goods and services; it means that travel represents 40% of imported services.
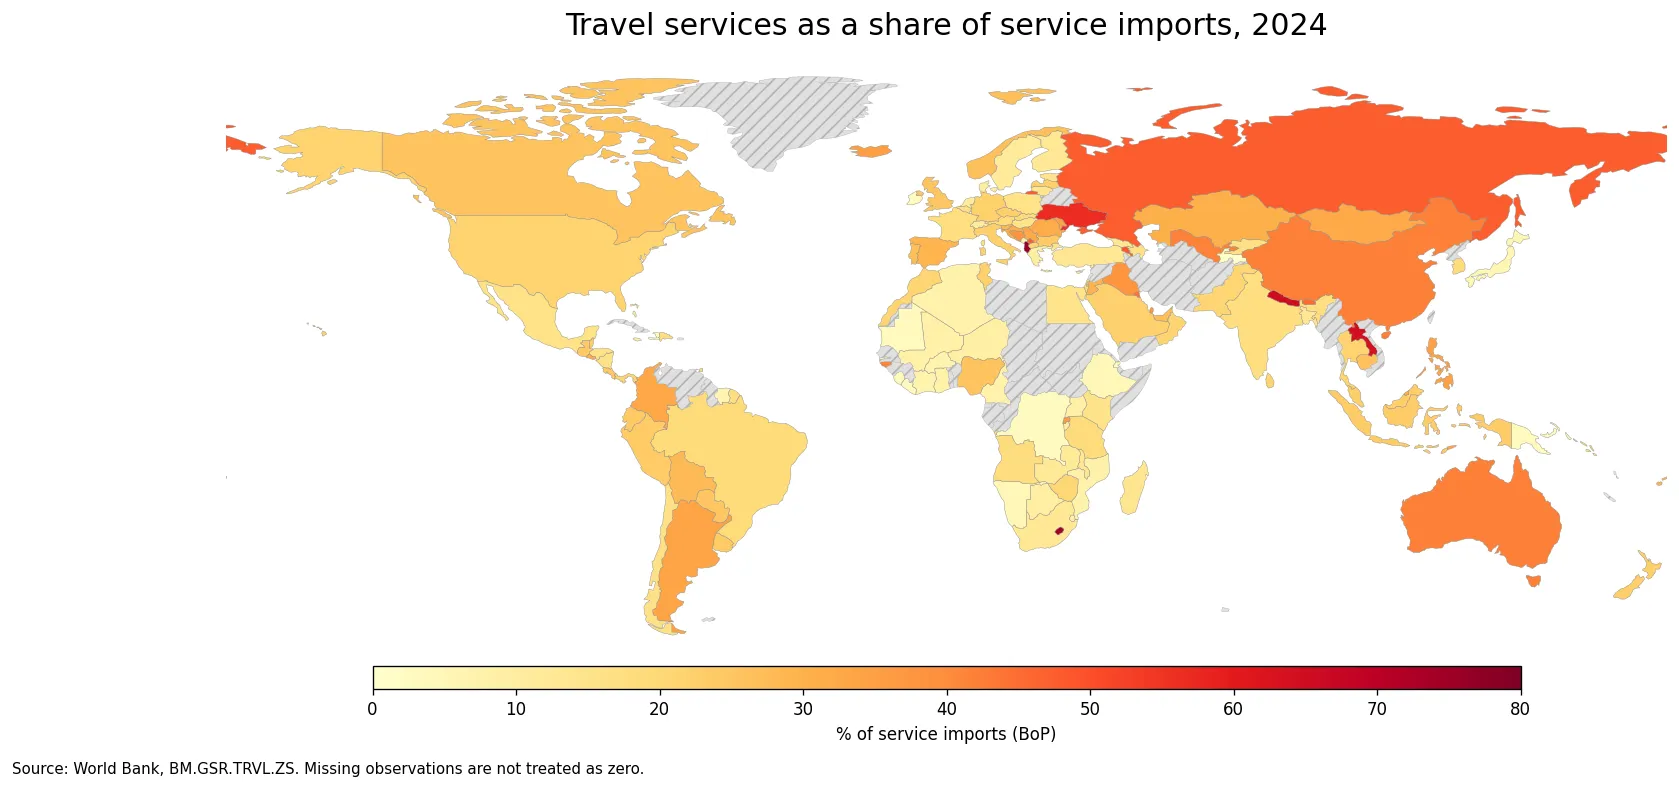
Table of Contents
The 2024 distribution centered near 20%, but the range was exceptionally wide
The first quartile was 10.97% and the third quartile was 28.11%, so the middle half of reported observations sat within a band of roughly 11% to 28%. The 10th percentile was 6.73% and the 90th percentile was 38.04%. Thirty-six economies were at or above 30%, 14 were at or above 40%, and five exceeded 50%. At the other end, 36 were below 10% and 13 were below 5%. This is not a distribution that can be summarized well by a single global average.
The mean was slightly above the median because several very high observations pulled the average upward. That does not imply that travel dominates service imports in most economies. Half of the reported values were at or below 20.11%, and more than one in five were below 10%. A useful interpretation is that the indicator describes the internal mix of service imports rather than the absolute scale of outbound travel spending.
Albania and Lesotho exceeded 70%, while Nepal and Lao PDR were above 60%
The highest values in 2024 were Albania at 76.41%, Lesotho at 73.90%, Nepal at 65.18%, Lao PDR at 64.23%, and Ukraine at 56.52%. Armenia followed at 48.90%, the Russian Federation at 47.69%, Kosovo at 47.28%, Bhutan at 45.48%, and Kuwait at 44.23%. The top ten span southeastern Europe, southern Africa, South Asia, Southeast Asia, eastern Europe and western Asia. The pattern is therefore not confined to a single region.
| Economy | Travel services share of service imports |
|---|---|
| Albania | 76.41% |
| Lesotho | 73.90% |
| Nepal | 65.18% |
| Lao PDR | 64.23% |
| Ukraine | 56.52% |
| Armenia | 48.90% |
| Russian Federation | 47.69% |
| Kosovo | 47.28% |
| Bhutan | 45.48% |
| Kuwait | 44.23% |
A high percentage should not be read as evidence that an economy has the world’s largest amount of travel-service imports. This is a ratio. An economy can have a high share because travel debits are large, because other imported services are relatively small, or because both conditions occur together. Conversely, an economy with substantial outbound travel spending can have a modest ratio if transport, financial, digital, intellectual-property or other business-service imports are even larger.
At the bottom of the distribution, several economies were below 5%
Tajikistan had the lowest reported value at 2.03%, followed by Haiti at 2.58%, Djibouti at 2.90%, Liberia at 2.99%, and the Democratic Republic of the Congo at 2.99%. Ireland was at 3.03%, Papua New Guinea at 3.20%, Mauritania at 3.71%, Malta at 3.88%, and Sierra Leone at 4.33%. The gap between the maximum and minimum was about 74.39 percentage points.
| Economy | Travel services share of service imports |
|---|---|
| Tajikistan | 2.03% |
| Haiti | 2.58% |
| Djibouti | 2.90% |
| Liberia | 2.99% |
| Congo, Dem. Rep. | 2.99% |
| Ireland | 3.03% |
| Papua New Guinea | 3.20% |
| Mauritania | 3.71% |
| Malta | 3.88% |
| Sierra Leone | 4.33% |
Low shares do not mean that residents rarely travel abroad. They only show that travel is a small component of total imported services. A country with large imports of professional, financial, communications, computer, transport or intellectual-property services can record a low travel share even with meaningful travel expenditure. The indicator alone cannot identify which alternative service category explains a low ratio, so causal claims require the underlying service-import components.
Neighboring economies often had very different shares
The Balkans provide a clear example. Albania was at 76.41%, while Montenegro was at 7.81%. Bosnia and Herzegovina recorded 38.09%, Serbia 32.47%, Croatia 30.98%, and North Macedonia 20.56%. South Asia was similarly mixed: Nepal reached 65.18% and Bhutan 45.48%, compared with India at 17.78%, Bangladesh at 13.35%, Pakistan at 21.18%, and Sri Lanka at 21.74%. Geographic proximity does not produce a uniform service-import structure.
Central Asia shows another sharp contrast: Uzbekistan was at 41.74%, Kazakhstan at 30.34%, the Kyrgyz Republic at 17.01%, and Tajikistan at just 2.03%. In East Asia and major service hubs, China recorded 41.88%, Hong Kong SAR 31.70% and Macao SAR 37.81%, while Japan was at 5.70% and Singapore at 8.44%. These differences make it important to consider both the travel numerator and the full service-import denominator.
Large economies also occupied very different positions in the distribution
The United States recorded 21.28%, Canada 25.82%, and Mexico 15.72%. Among major European economies, Germany was at 22.25%, Italy at 22.26%, the United Kingdom at 25.08%, Spain at 29.38%, and France at 17.53%, while Ireland stood out at only 3.03%. In Oceania, Australia was comparatively high at 41.95%, New Zealand was at 22.93%, and Fiji at 29.02%. Economic size by itself is not a reliable guide to the ratio.
The indicator should also not be treated as a direct measure of a population’s preference for international travel. Income, exchange rates, trip frequency, length of stay and travel purpose may influence travel debits, but the denominator changes at the same time as every other category of service imports changes. It is best understood as a balance-of-payments composition measure, not a behavioral score.
A one-year cross-section cannot establish a trend or explain the cause
These comparisons use 2024 observations only. They do not show whether a country’s share has been rising or falling, how rapidly outbound travel recovered after earlier disruptions, or how exchange-rate movements affected expenditure. A trend analysis would require multiple years of the same indicator and attention to revisions and reporting coverage. The 2024 map is a snapshot of relative composition, not a time-series conclusion.
The source file contains 217 country and area rows. Of these, 162 have a 2024 value and 55 are source-missing. Missing observations were not changed to zero and are excluded from the descriptive statistics and rankings. The World Bank reporting universe also includes some territories and separately reported areas, so the count of 162 should not be interpreted as a count of sovereign states.
The ratio is most useful as a starting point for understanding service-import structure
A high travel share means that purchases associated with residents’ visits abroad form a large part of recorded service imports. A low share means other imported services are relatively more important. Neither outcome is inherently better. Economies differ in industrial structure, business-service needs, transport arrangements, tourism patterns and cross-border corporate activity, all of which can shape the denominator and the numerator in different ways.
For practical comparison, the 2024 median of 20.11% is a useful first benchmark. The quartile boundaries of 10.97% and 28.11% provide additional context for distinguishing lower, middle and higher shares without overemphasizing rank. After locating an economy in that distribution, the next analytical step is to examine travel-service import values in absolute terms and compare them with transport, financial, digital and other service components. That combination explains much more than the percentage alone.
Frequently Asked Questions
Which economy had the highest travel-services share of service imports in 2024?
Among the reported World Bank BM.GSR.TRVL.ZS observations, Albania was highest at 76.41%, followed by Lesotho at 73.90%.
Does a 40% value mean travel is 40% of all imports?
No. It means travel services account for 40% of service imports recorded in the balance of payments, not 40% of total goods and services imports.
Were missing observations treated as zero?
No. Fifty-five source-missing rows remained missing, and the descriptive statistics and rankings use only the 162 reported 2024 observations.
Related Articles
Green Map creates custom-edited map images using open geographic data sources such as geoBoundaries, Natural Earth, OpenStreetMap, and government open data. These maps are edited visual materials, not raw data files, and are provided for education, documents, presentations, and graphic reference.