The U.S. Energy Information Administration reports a wide state-level spread in the physical volume of natural gas and other gases used for electricity generation and useful thermal output in 2025. This slice fixes fueltypeid=NGO, sectorid=99 (All Sectors), field=total-consumption, annual frequency, and a unit of thousand Mcf. All 50 states plus the District of Columbia have observed values, so the file contains 51 rows and no missing observations. The simple sum of those rows is 15,630,756.28 thousand Mcf.
Texas is the largest observation at 2,648,025.685 thousand Mcf, equal to 16.94% of the 51-row sum. Florida follows at 1,432,457.039, and Pennsylvania at 1,156,716.791. At the opposite end, Hawaii is reported as exactly zero, Vermont as 87.465, and the District of Columbia as 1,309.043 thousand Mcf. Hawaii’s zero is an observed value, not a substitute for missing data.
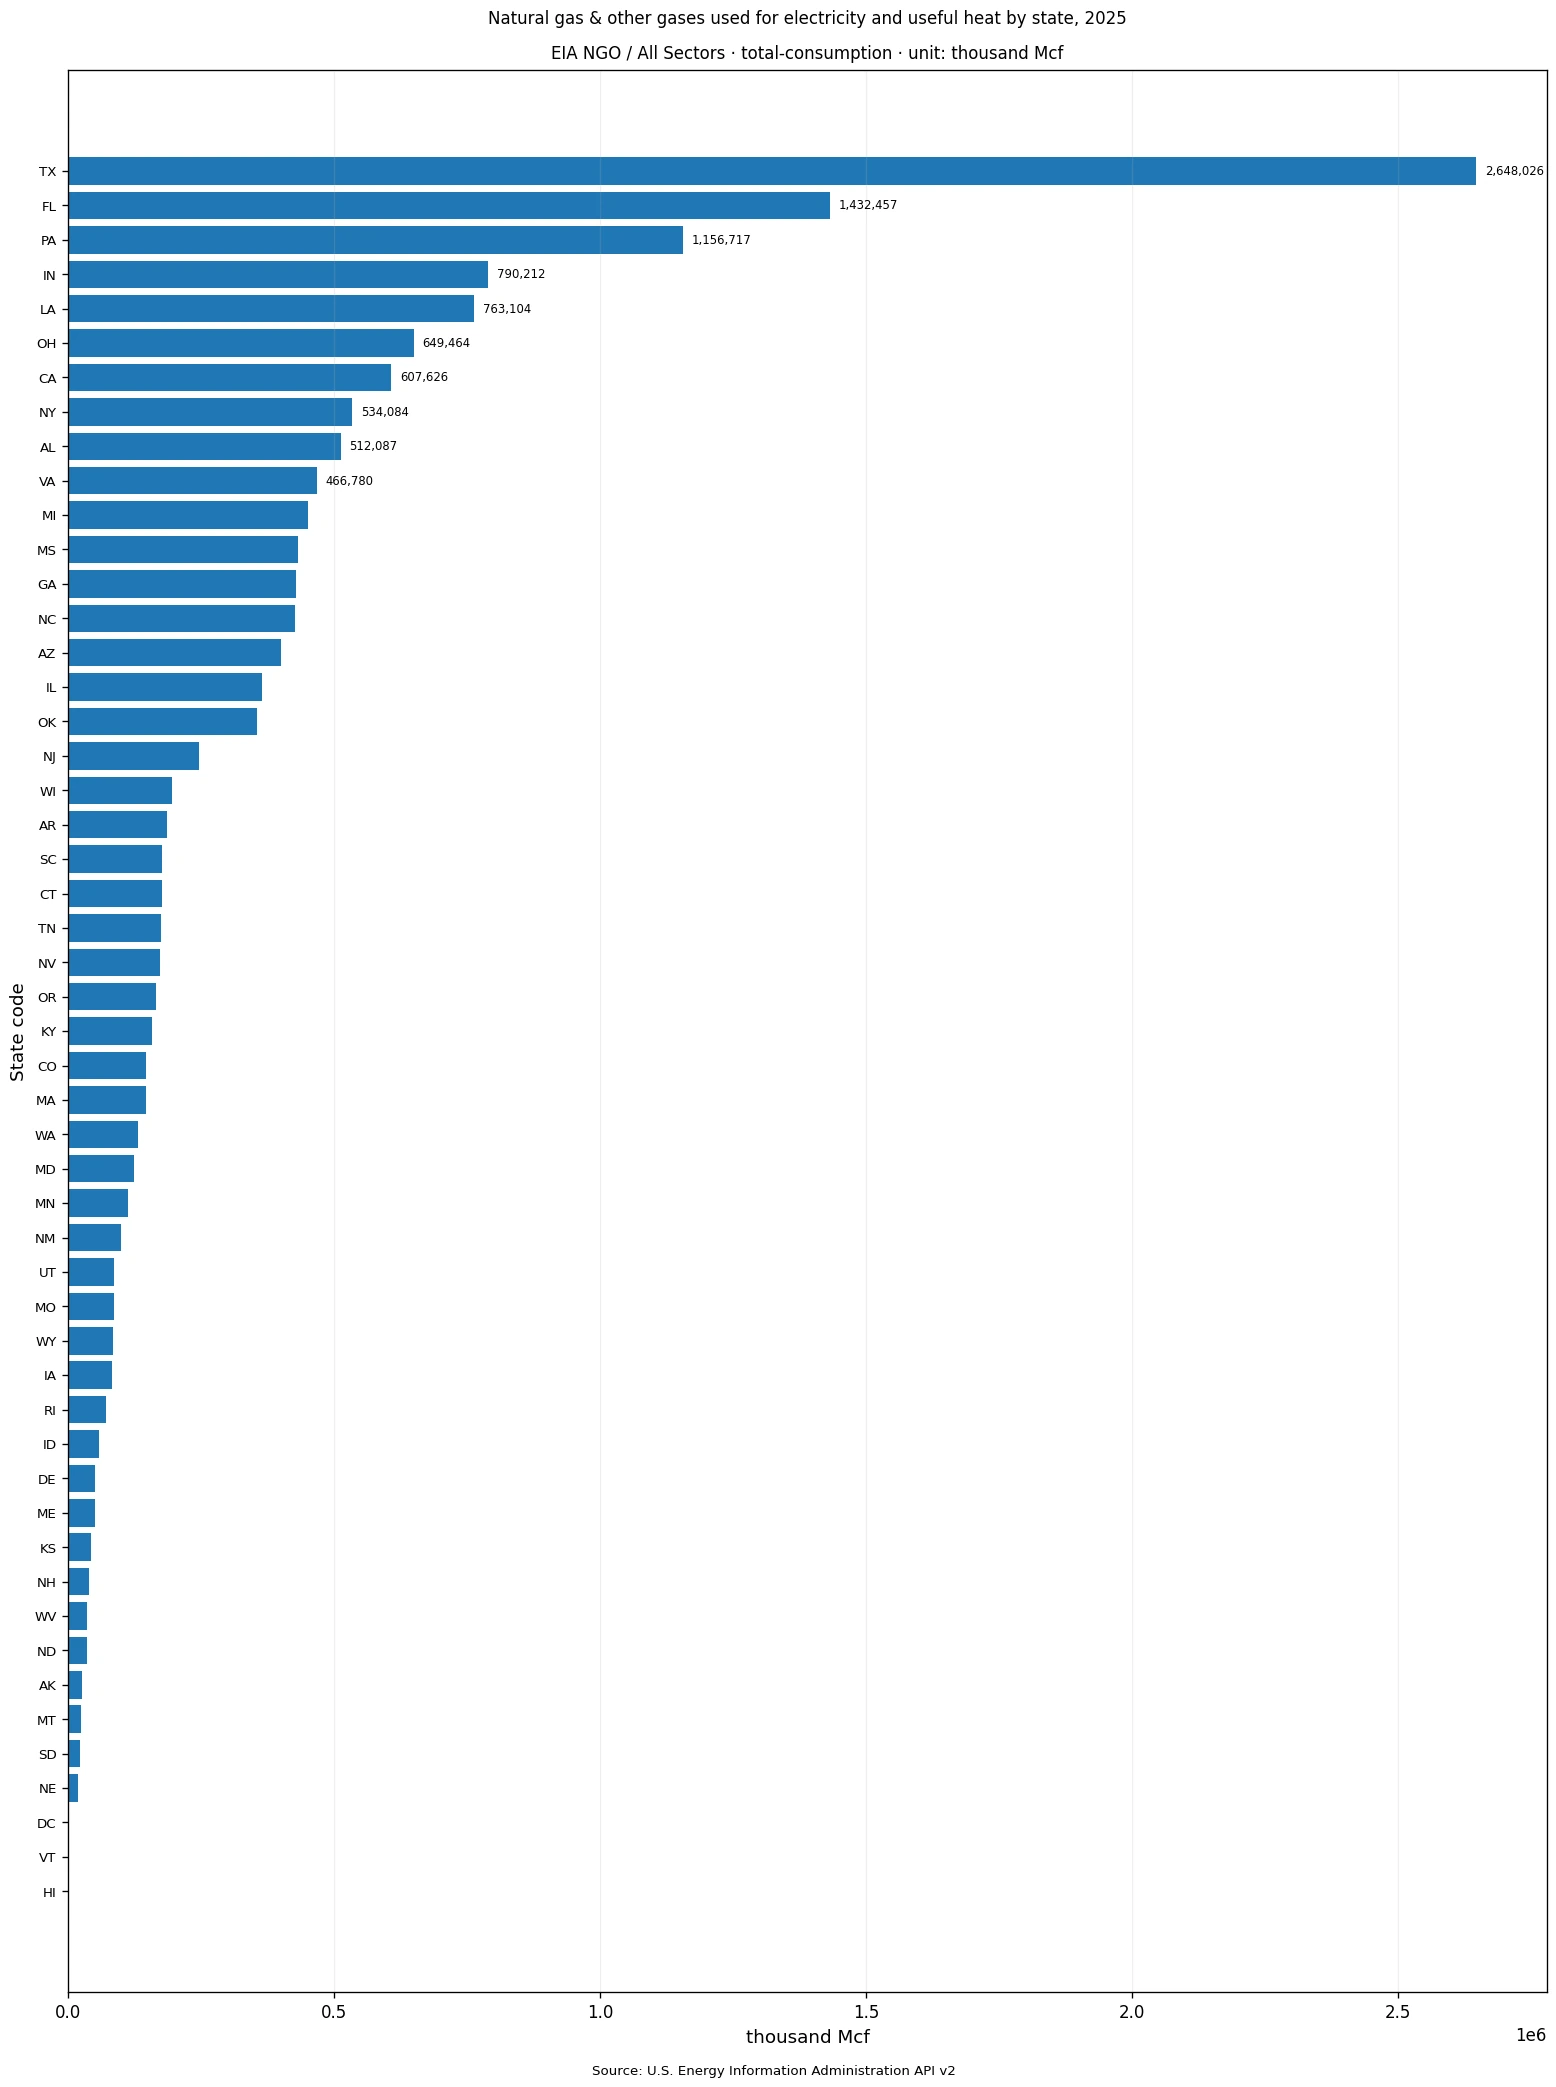
Table of Contents
What the EIA series measures
This is a fuel-consumption measure in physical units. The metric name specifies consumption of fuels for electricity generation and useful thermal output, and the NGO facet selects the combined category “natural gas & other gases.” The number therefore represents reported gas volume under that EIA definition. It is not electricity output in MWh, generating capacity in MW, or an electricity-demand measure.
The distinction is important because the title can look similar to other EIA operational series. The same database also contains Btu-based fields, generation fields, useful-thermal-output fields, heat-content measures, and different fuel or sector facets. A valid comparison needs the year, field, fuel facet, sector facet, unit, frequency, and state geography to remain aligned. Changing only one of them can create a different statistical object.
Texas represents 16.94% of the 51-row sum
Texas records 2,648,025.685 thousand Mcf, about 1.85 times Florida. Florida contributes 9.16% of the row sum and Pennsylvania contributes 7.40%. Together, the top three account for 33.51%. The top five account for 43.44%, while the top ten reach 61.17%.
That concentration is substantial, but it does not mean the distribution is reduced to one or two states. The remaining 41 jurisdictions still make up 38.83% of the 51-row sum. The shares in this article are analytical shares of the state-and-D.C. total in this file. They are not percentages of each state’s electricity mix, and they should not be substituted for a separately published U.S. national total without checking coverage and aggregation rules.
| Rank | State / area | Code | 2025 value (thousand Mcf) | Share of 51-row sum |
|---|---|---|---|---|
| 1 | Texas | TX | 2,648,025.685 | 16.94% |
| 2 | Florida | FL | 1,432,457.039 | 9.16% |
| 3 | Pennsylvania | PA | 1,156,716.791 | 7.40% |
| 4 | Indiana | IN | 790,212.117 | 5.06% |
| 5 | Louisiana | LA | 763,103.881 | 4.88% |
| 6 | Ohio | OH | 649,463.596 | 4.16% |
| 7 | California | CA | 607,625.846 | 3.89% |
| 8 | New York | NY | 534,084.081 | 3.42% |
| 9 | Alabama | AL | 512,087.421 | 3.28% |
| 10 | Virginia | VA | 466,780.128 | 2.99% |
The mean is almost twice the median
The arithmetic mean is 306,485.417 thousand Mcf, while the median is 157,145.531. The mean is about 1.95 times the median because a small group of very large observations pulls the average upward. Texas, Florida, and Pennsylvania are the only three jurisdictions above one million thousand Mcf. Nine are at or above 500,000.
The first quartile is 54,115.198 and the third quartile is 427,740.682 thousand Mcf. Half of the observations lie between those two points. Seventeen jurisdictions are at or above 250,000, while 20 are below 100,000 and 3 are below 10,000. This is a strongly right-skewed distribution rather than a cluster around one typical level.
The upper ranks span several U.S. regions
The top ten are Texas, Florida, Pennsylvania, Indiana, Louisiana, Ohio, California, New York, Alabama, and Virginia. Indiana records 790,212.117 thousand Mcf, Louisiana 763,103.881, and Ohio 649,463.596. California and New York also exceed 500,000. The upper group therefore includes states from the South, Midwest, Northeast, and West rather than a single regional block.
The dataset itself does not establish why those values differ. The scale and composition of the generation fleet, plant dispatch, combined heat and power activity, gas availability, relative fuel costs, efficiency, and interstate electricity flows can all matter. Determining causal importance would require additional series. The defensible conclusion from this file is descriptive: these states reported larger physical volumes under the same EIA definition in 2025.
Low values and the exact zero must remain separate from missing data
Hawaii is the smallest observation at exactly 0 thousand Mcf. Vermont follows at 87.465, the District of Columbia at 1,309.043, Nebraska at 18,740.938, and South Dakota at 21,302.054. Because every row contains a value, none of these observations should be labeled “No data.” A zero is a reported number, while a missing value would mean no numeric observation was supplied.
That distinction affects both calculations and visualization. Replacing missing values with zero can artificially lower averages and create false low rankings; replacing a true zero with missing data erases an actual observation. This file has no missing rows, so the statistical summaries use all 51 values exactly as reported, including Hawaii’s zero and the very small positive values for Vermont and D.C.
| Low-value order | State / area | Code | 2025 value (thousand Mcf) | Share of 51-row sum |
|---|---|---|---|---|
| 1 | Hawaii | HI | 0.000 | 0.000% |
| 2 | Vermont | VT | 87.465 | 0.001% |
| 3 | District of Columbia | DC | 1,309.043 | 0.008% |
| 4 | Nebraska | NE | 18,740.938 | 0.120% |
| 5 | South Dakota | SD | 21,302.054 | 0.136% |
| 6 | Montana | MT | 24,641.092 | 0.158% |
| 7 | Alaska | AK | 25,731.633 | 0.165% |
| 8 | North Dakota | ND | 34,308.382 | 0.219% |
| 9 | West Virginia | WV | 35,744.054 | 0.229% |
| 10 | New Hampshire | NH | 38,878.891 | 0.249% |
The 15.63 million-thousand-Mcf sum is an analytical aggregation of the rows
Adding the 51 observations produces 15,630,756.281 thousand Mcf. That sum is useful for calculating the state shares and cumulative concentration shown here. It should not automatically be treated as an official U.S. national total from another EIA series. A national series may differ in geographic coverage, respondent treatment, revisions, or aggregation conventions.
For reproducibility, the safest method is to preserve every dimension used by the source request: annual frequency, 2025, the total-consumption field, fueltypeid=NGO, sectorid=99, unit=thousand Mcf, and state-level geography. Similar-looking EIA titles are not enough. If the field is changed to a Btu measure or the sector is restricted, the resulting values answer a different question.
Physical volume in thousand Mcf is not the same as energy content in Btu
This article uses physical units. Mcf is a gas-volume unit, and the source reports the values in thousand Mcf. EIA also publishes heat-content and Btu-based measures for related fuel use. Those measures are connected, but they are not interchangeable because the energy content per unit of gas can differ. A ranking by physical volume does not have to be identical to a ranking by heat input.
For the same reason, this analysis does not convert the observations into MMBtu using an assumed universal factor. A sound conversion would need a compatible heat-content series for the same year, fuel category, sector, and geography. Keeping the source unit intact protects the statistical identity of the series and avoids introducing a conversion assumption that was not present in the verified data.
Fuel volume, generation, capacity, and electricity demand answer different questions
A state can use a large volume of natural gas and other gases without ranking in exactly the same position for electricity generation. Generation depends on conversion efficiency and the contribution of other fuels. Capacity measures the maximum capability of installed equipment rather than actual annual operation. Electricity demand concerns consumption by end users and can differ from in-state generation because power crosses state borders.
A natural-gas share of the electricity mix would require a denominator such as total generation or total fuel input. A per-capita measure would require population. An emissions-intensity measure would require both emissions and electricity output. Those are useful derived indicators, but none is contained in this absolute physical-volume series. The present comparison should therefore be read as a state distribution of reported gas volume, not as a performance score.
All Sectors is a database dimension, not all U.S. final energy use
Sectorid=99 is labeled All Sectors within the EIA electric-power-operational-data route. That label aggregates the sector dimension used in this electricity operational dataset. It should not be expanded into a claim that the numbers represent every use of natural gas in households, transportation, commercial buildings, manufacturing, and other final-demand categories across the entire economy.
The metric name itself keeps the boundary clear: consumption of fuels for electricity generation and useful thermal output. The most precise short description is therefore “2025 NGO total-consumption, All Sectors, state-level, thousand Mcf.” Keeping that boundary visible is especially important when comparing this article with EIA natural-gas consumption datasets outside the electricity operational route.
One year is a cross-section, not a trend
All 51 observations refer to 2025. They support a ranking and distribution analysis for that year, but they do not show whether Texas increased from 2024, whether Florida declined, or whether state concentration has been rising over time. A trend analysis requires multiple years with the same total-consumption field, NGO fuel facet, sector 99, frequency, unit, and geography.
Historical EIA observations can also be revised. If the agency later changes a 2025 value, the row sum and calculated shares would change as well. A reproducible time series should therefore retain the extraction date and rerun the calculations when the source is refreshed. The figures here correspond to the verified observations supplied for this 2025 comparison.
The middle of the distribution matters as much as the leader
The top ten account for 61.17% of the 51-row sum, leaving 38.83% among 41 other jurisdictions. The median is 157,145.531 thousand Mcf and the upper quartile is 427,740.682. Many states therefore occupy a broad middle range between the tiny values at the bottom and the million-plus observations at the top.
Reading the full ranked chart helps prevent the Texas bar from becoming the entire story. The distribution shows a large leader, two additional million-plus states, a substantial middle group, and a long lower tail that includes one exact zero. Those features are all part of the same dataset and together provide a more accurate picture than a single maximum or average.
Source and reproducibility
The source is the U.S. Energy Information Administration API v2, electricity/electric-power-operational-data route. The verified slice uses annual frequency, year 2025, field total-consumption, fueltypeid=NGO, sectorid=99 (All Sectors), unit thousand Mcf, and state geography. Coverage is the 50 U.S. states plus the District of Columbia. No values were imputed and no different years were merged.
Under those conditions, Texas records 2,648,025.685 thousand Mcf, Florida 1,432,457.039, Pennsylvania 1,156,716.791, and the 51-row sum is 15,630,756.281. The median is 157,145.531 and the mean 306,485.417. The strongest descriptive conclusion is that 2025 physical gas use for electricity generation and useful thermal output was highly uneven across states, with Texas the largest single observation.
Frequently Asked Questions
Which state had the largest 2025 natural gas and other gases consumption for electricity and useful heat?
Texas was largest at 2,648,025.685 thousand Mcf, about 16.94% of the simple sum of the 50 states and D.C. observations.
Does Hawaii’s zero mean the data are missing?
No. All 51 jurisdictions have numeric observations and the dataset has no missing values. Hawaii is explicitly reported as zero, which must remain distinct from missing data.
Can this thousand-Mcf series be used as a ranking of electricity generation or gas share?
Not directly. It measures physical gas volume under the EIA NGO / All Sectors / total-consumption definition, not MWh generation, MW capacity, or a percentage of the electricity mix.
Related Articles
Green Map creates custom-edited map images using open geographic data sources such as geoBoundaries, Natural Earth, OpenStreetMap, and government open data. These maps are edited visual materials, not raw data files, and are provided for education, documents, presentations, and graphic reference.