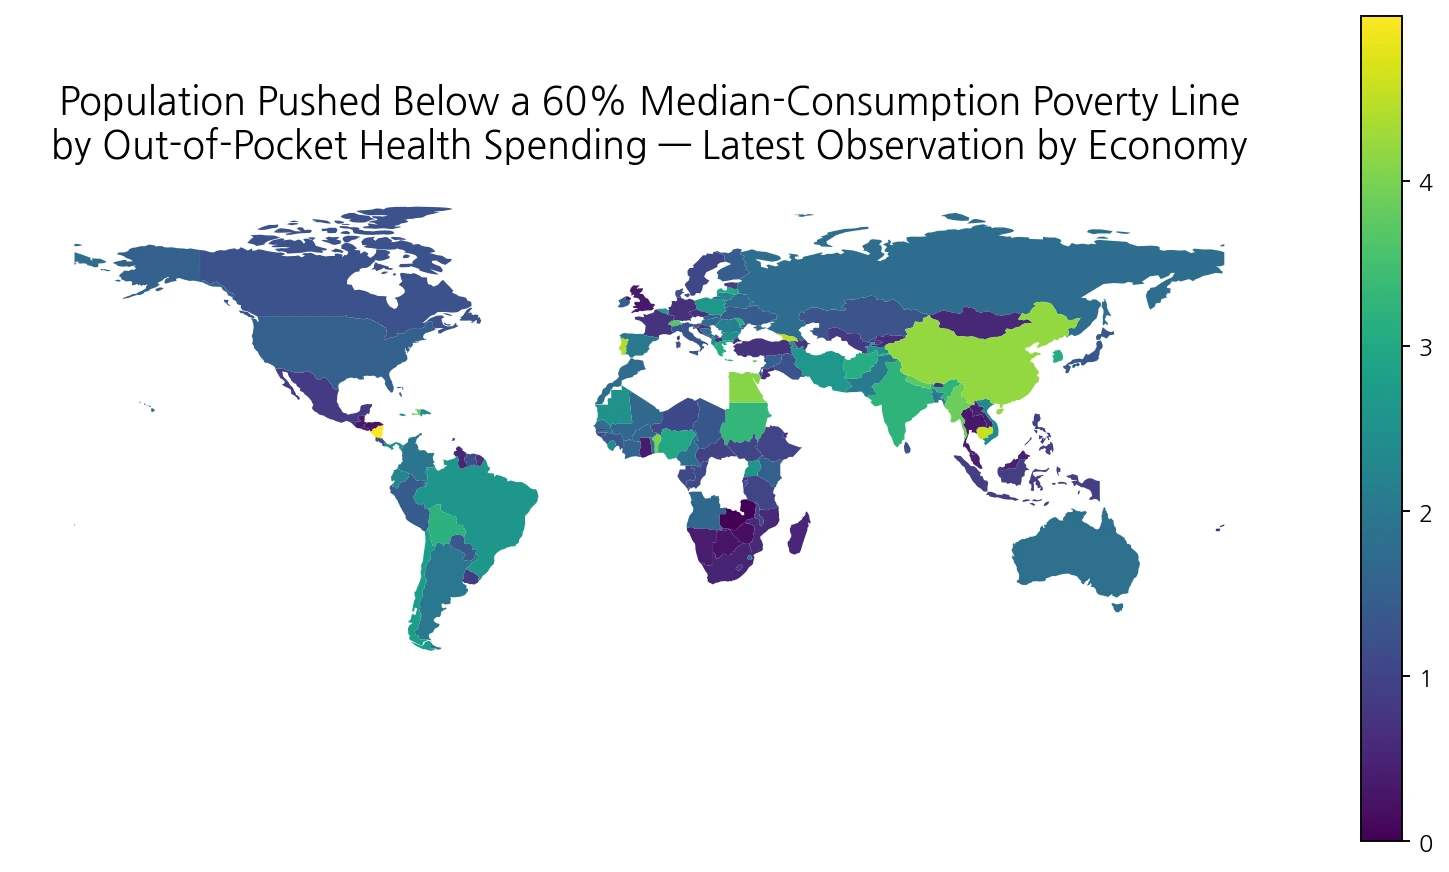
In the World Bank’s 2022 cross-country file, 105 countries and separately reported economies have a value for food, beverages and tobacco as a share of manufacturing value added. Another 112 rows are source-missing. Among the reported observations, the median is 21.46% and the simple unweighted mean is 26.43%. The mean sits noticeably above the median because the distribution has a substantial upper tail, including several economies where this branch accounts for more than half of manufacturing value added.
The percentage is best read as an industrial-composition measure. It does not show the share of food in household consumption, the share of agriculture in GDP, the amount of food produced, or the absolute size of manufacturing. The numerator is value added in food, beverage and tobacco manufacturing, while the denominator is value added in manufacturing as a whole. That denominator can differ enormously across economies, so the same percentage can represent very different monetary amounts.
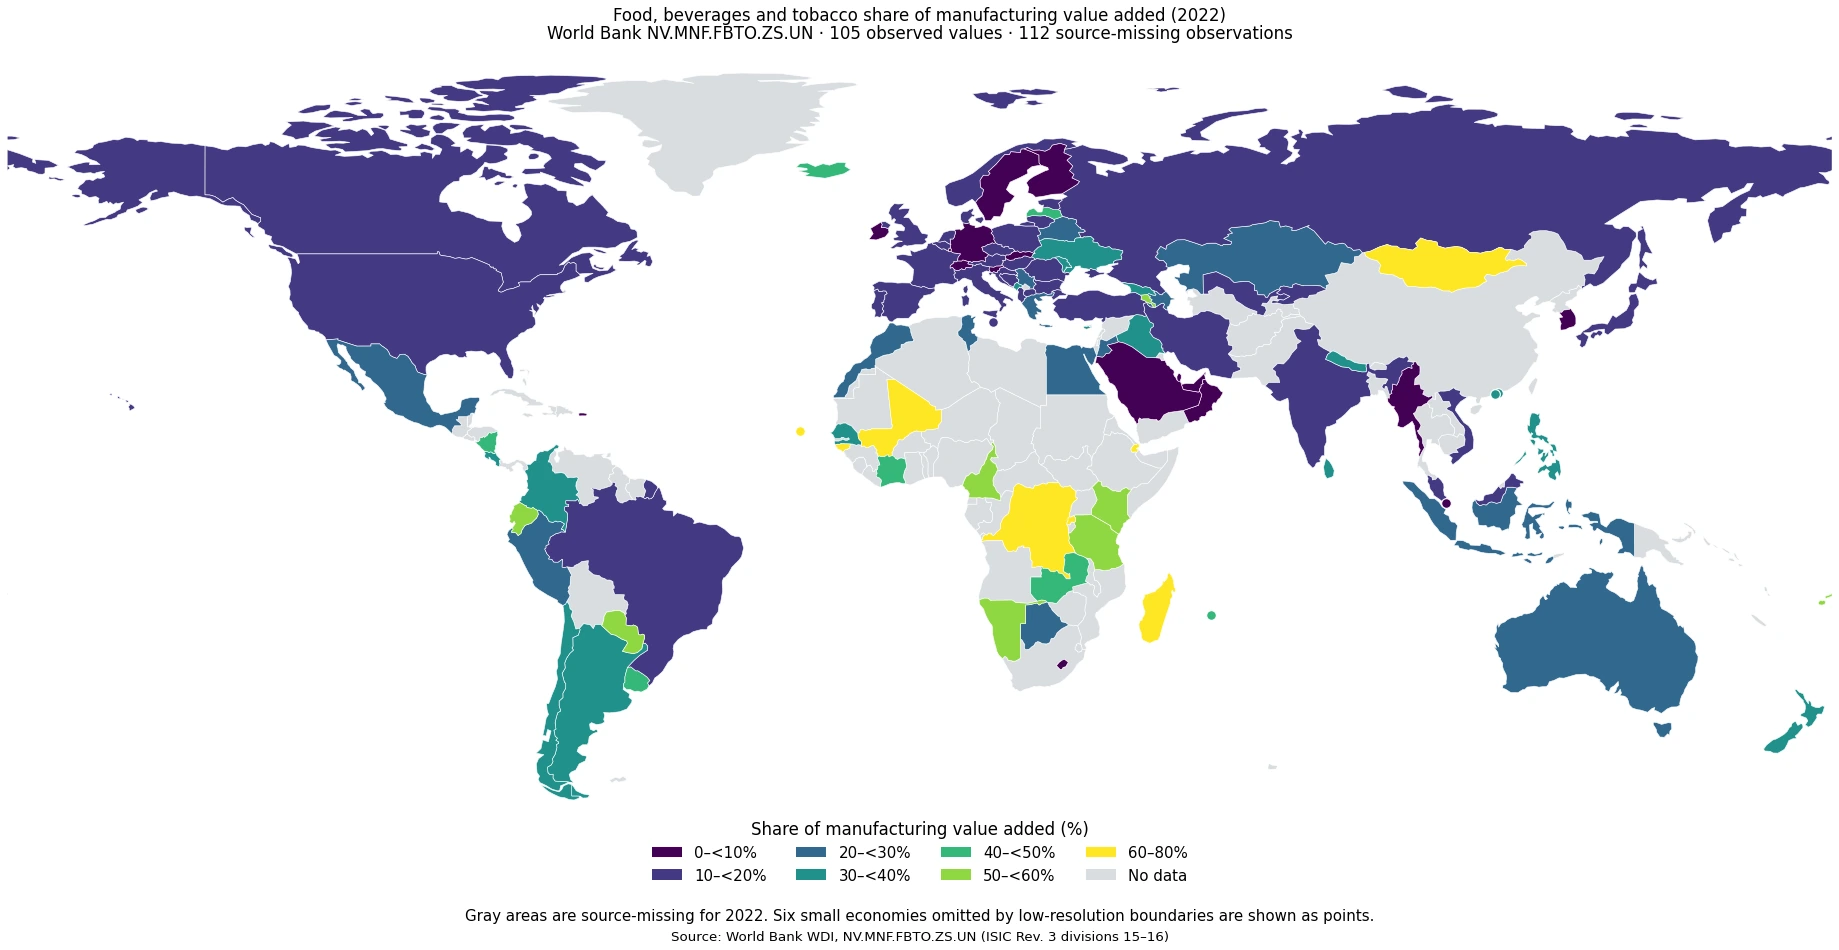
Table of Contents
What the indicator includes—and what it leaves out
The World Bank identifies the activity group with ISIC Revision 3 divisions 15 and 16. In accounting terms, value added is the value of output minus intermediate goods and services used in production. The ratio therefore asks how much of total manufacturing value added comes from food, beverage and tobacco industries. It is a narrower question than “how important is food to the economy?” because agriculture, restaurants, retail food sales, logistics and many other food-related activities are outside the manufacturing numerator.
A high result can arise when processing of agricultural products and consumer staples forms a large part of the manufacturing base, but the number alone cannot identify the cause. A low result may reflect a large presence of electronics, machinery, pharmaceuticals, chemicals, metals or other manufacturing branches rather than a weak food-processing sector. For that reason, the percentage should not be converted into a score of industrial strength, competitiveness or food security.
Eight reported economies were at 60% or more
Mali records the highest 2022 value at 77.32%, followed by Djibouti at 73.33%. Rwanda, the Democratic Republic of the Congo, Cabo Verde, Madagascar, Guinea-Bissau and Mongolia are also above 60%. In total, 8 of the 105 reported observations are in the 60–80% band. Expanding the threshold to 50% produces 16 observations, while 23 are at 40% or higher.
Those figures show strong concentration within manufacturing, but they do not establish that the high-share economies produce more food products in absolute terms than lower-share economies. A relatively small manufacturing sector can be heavily concentrated in processing activities, while a large and diversified manufacturing sector can contain a much larger food industry yet assign it a smaller percentage of the total. The distinction between composition and scale is essential when reading the top of the table.
| Rank | Economy | Share in 2022 |
|---|---|---|
| 1 | Mali | 77.32% |
| 2 | Djibouti | 73.33% |
| 3 | Rwanda | 63.57% |
| 4 | Congo, Dem. Rep. | 63.51% |
| 5 | Cabo Verde | 63.40% |
| 6 | Madagascar | 62.43% |
| 7 | Guinea-Bissau | 62.36% |
| 8 | Mongolia | 60.71% |
| 9 | Fiji | 58.35% |
| 10 | Namibia | 57.99% |
The center of the distribution is much lower than the top values suggest
The first quartile is 11.62%, the median is 21.46%, and the third quartile is 36.71%. Half of all reported values therefore fall within a range of about 25 percentage points between the first and third quartiles. The largest single class on the map is 10–20%, with 34 observations. Another 14 are between 20% and 30%, and 17 are between 30% and 40%. Overall, 82 of the 105 reported values are below 40%.
This shape matters because a map naturally draws attention to the most intense colors. The upper-tail economies are important, but they are not typical of the full set. The simple mean of 26.43% is pulled upward by the concentration of observations in the 50–70% range. The median provides a more resistant benchmark for asking whether an individual reported economy sits near the middle of the 2022 distribution.
Seventeen observations were below 10%
At the lower end, Myanmar reports 0.46%, followed by Switzerland at 2.37%, Qatar at 2.80%, Puerto Rico at 2.82% and Singapore at 3.39%. Lesotho, Oman, Sweden, Ireland and the Republic of Korea are also among the ten lowest reported values. There are 17 observations below 10% in total. These are observed low shares, not missing records.
A very low share still says nothing directly about the monetary size of the food, beverage and tobacco industries. Switzerland and Singapore, for example, have manufacturing structures in which other activities can dominate value added. The ratio can therefore be low even if the economy has sophisticated food or beverage producers. Conversely, a high percentage can occur where the total manufacturing denominator is modest. The indicator is useful precisely because it describes composition, but it becomes misleading when treated as a production-volume ranking.
| Rank | Economy | Share in 2022 |
|---|---|---|
| 1 | Myanmar | 0.46% |
| 2 | Switzerland | 2.37% |
| 3 | Qatar | 2.80% |
| 4 | Puerto Rico (US) | 2.82% |
| 5 | Singapore | 3.39% |
| 6 | Lesotho | 4.04% |
| 7 | Oman | 5.37% |
| 8 | Sweden | 6.20% |
| 9 | Ireland | 6.45% |
| 10 | Korea, Rep. | 6.52% |
Regional patterns contain large within-region differences
Several African observations occupy the upper end of the distribution: Mali, Rwanda, the Democratic Republic of the Congo, Madagascar, Kenya, Tanzania and Cameroon are all above 50%. Yet the available African values are not uniformly high, and many countries have no 2022 observation at all. The data therefore do not support a simple continental rule. They point instead to different manufacturing mixes among the economies that report.
South America also illustrates internal variation. Ecuador and Paraguay are just above 50%, Uruguay is around 40%, Chile and Colombia are in the mid-30s, Argentina is about 30%, Peru is near 26%, and Brazil is about 17%. Europe spans from Switzerland, Sweden, Ireland and Germany in the single digits to Greece above 25%. In Asia and the Pacific, Mongolia is above 60%, Fiji is above 58%, the Philippines is near 34%, Indonesia is near 29%, while Singapore is below 4%. Geographic proximity does not eliminate large differences in manufacturing structure.
Missing observations are not zeroes
The source table preserves 112 economies without a 2022 value. None of those entries is treated as 0%. Zero-filling would manufacture data that the source does not report and would sharply change the average, median, class counts and map. The descriptive statistics in this article use only the 105 observed values. On the map, source-missing economies are shown separately rather than being placed in the lowest class.
The boundary layer has a separate cartographic limitation. Ninety-nine observed economies match a low-resolution country polygon directly. Cabo Verde, Mauritius, Macao SAR, Hong Kong SAR, Malta and Singapore are not represented as separate filled polygons in that simplified geometry, so they are added as point markers. Their values are still included in every calculation, ranking and summary statistic. Point size should not be interpreted as geographic area or economic scale.
How to combine this ratio with other manufacturing indicators
A stronger industrial comparison pairs this share with at least one measure of scale. Manufacturing value added in current or constant currency helps answer how large the sector is. Manufacturing as a share of GDP shows how important manufacturing is to the whole economy. Export data can reveal whether processed food, beverages or tobacco are important traded products, while employment data add a labor-market dimension. Each measure answers a different question and should not be collapsed into a single league table.
Time is another dimension. The 2022 map is a snapshot, not a structural trend by itself. A change in the numerator can move the ratio, but so can a change in other manufacturing industries through the denominator. A temporary contraction in machinery or metals can raise the food-related share even if food manufacturing is flat. Conversely, rapid growth in electronics can reduce the share while food manufacturing continues to expand. Multi-year data are needed to separate those possibilities.
Source, coverage and interpretation
The source is the World Bank World Development Indicators series NV.MNF.FBTO.ZS.UN, “Food, beverages and tobacco (% of value added in manufacturing).” The World Bank description associates the numerator with ISIC Revision 3 divisions 15 and 16 and defines value added as output less intermediate consumption. The comparison uses the official 2022 observations for countries and separately reported economies and excludes World Bank regional and income-group aggregates.
The clearest reading is therefore structural: among the economies with data, the importance of food, beverage and tobacco manufacturing within total manufacturing ranges from less than 1% to more than 77%. The middle reported economy is near 21%, but the upper tail is substantial. Keeping the denominator, the missing-data limits and the one-year time frame in view allows the map to show genuine differences without turning a composition ratio into a claim about overall industrial performance.
Frequently Asked Questions
Does a high share mean the food manufacturing industry is larger in absolute terms?
No. The indicator divides food, beverage and tobacco manufacturing value added by total manufacturing value added. Absolute industry size requires monetary value-added or output data.
What is the median among the 2022 reported observations?
The median across 105 reported values is 21.46%, while the unweighted mean is 26.43%. The upper tail raises the mean above the median.
Should the 112 source-missing observations be treated as 0%?
No. Missing records are not measured zeroes. Replacing them with zero would distort the distribution, rankings and map.
Related Articles
Green Map creates custom-edited map images using open geographic data sources such as geoBoundaries, Natural Earth, OpenStreetMap, and government open data. These maps are edited visual materials, not raw data files, and are provided for education, documents, presentations, and graphic reference.