World Bank national-estimate data for 2024 provide male labor-force participation rates for ages 15–24 in 104 reporting economies. Across those observations, the mean is 47.03% and the median is 45.40%. The range runs from 17.442% to 83.201%, showing that the share of young men who are economically active varies widely across countries even when the age group and sex are held constant.
Labor-force participation is not the same as employment. The numerator includes both people who are working and people who are unemployed but actively participating in the labor market. Young men who are studying, not seeking work, or otherwise outside the labor force are excluded. The indicator therefore answers a specific question: what share of men ages 15–24 are supplying labor or actively available for work? It does not by itself tell us whether their jobs are secure, well paid, or even whether most participants are employed.
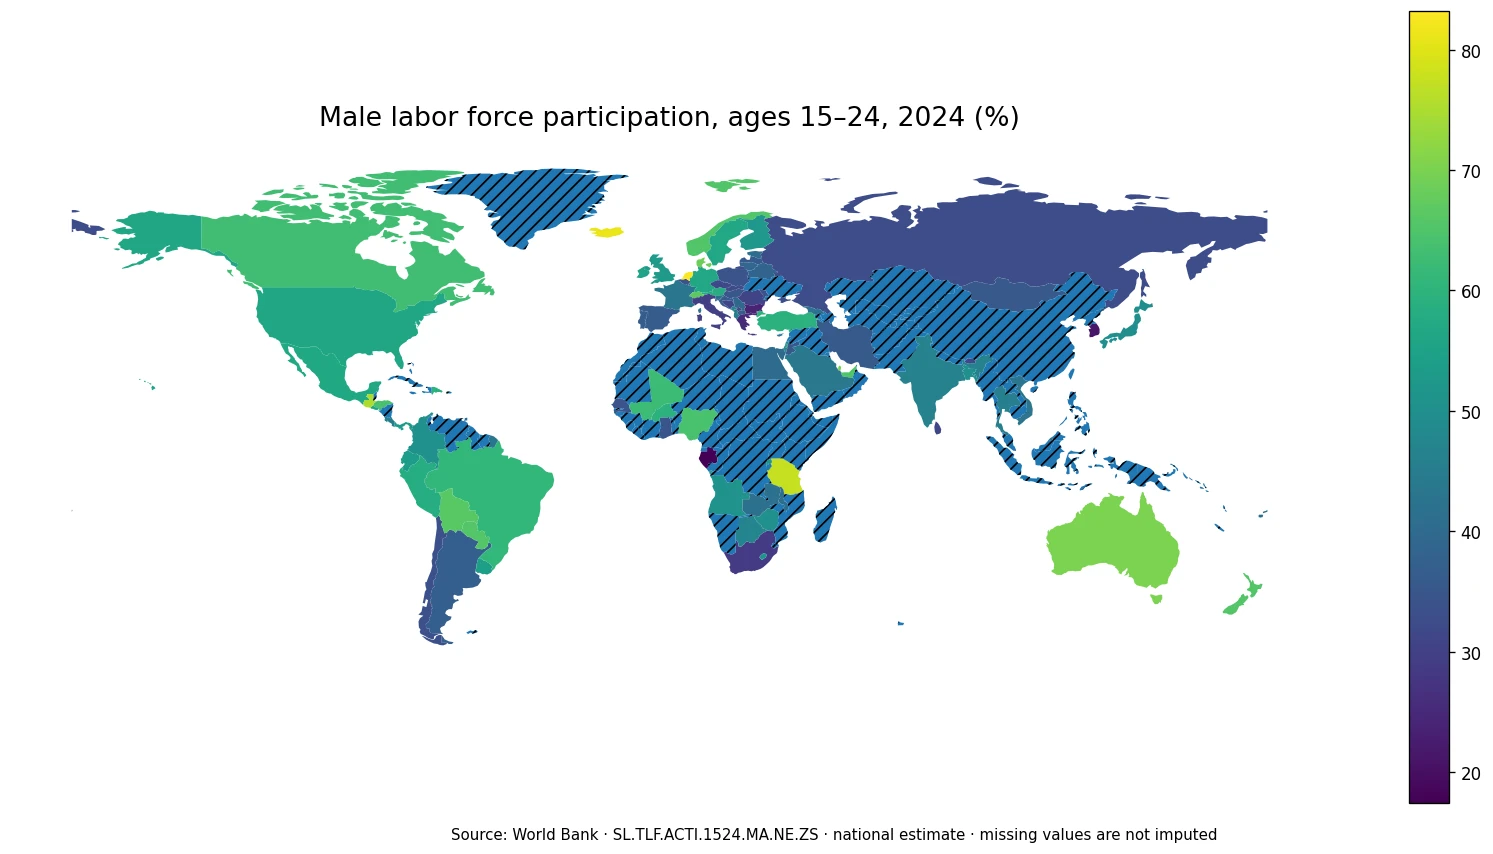
Table of Contents
What the 104 observations show
The first quartile is 35.89% and the third quartile is 56.75%, so the middle half of observed economies falls roughly between 35.9% and 56.7%. The median of 45.40% is slightly below the mean of 47.03%. Very high readings in the Netherlands, Iceland, Tanzania and Guatemala pull the average upward, while a separate group of economies sits in the twenties and low thirties. This is a broad distribution rather than a tightly clustered global norm.
The pattern matters because ages 15–24 cover a transition period. Some young men are still in secondary school, university, vocational education or training, while others enter work much earlier. Military service, household responsibilities, migration, informal work and the ease of finding a first job can also affect whether a person is counted in the labor force. The map cannot identify which mechanism explains each country, but it shows where participation is unusually high or low and where closer comparison is warranted.
Economies with the highest rates
| Economy | 2024 rate |
|---|---|
| Netherlands | 83.201% |
| Iceland | 81.076% |
| Tanzania | 77.375% |
| Guatemala | 75.115% |
| Australia | 70.178% |
| Qatar | 69.395% |
| Denmark | 68.662% |
| Switzerland | 66.796% |
| Bolivia | 66.212% |
| New Zealand | 65.700% |
The Netherlands records the highest value at 83.201%, followed by Iceland at 81.076%. Tanzania reaches 77.375% and Guatemala 75.115%. Australia is at 70.178%, while Qatar, Denmark, Switzerland, Bolivia and New Zealand all appear between about 65% and 70%. The top group spans Europe, Oceania, Latin America, Africa and the Middle East, so there is no single regional template behind high male youth participation.
A high participation rate should not be interpreted as a simple labor-market success score. Because unemployed job seekers are included, a country can combine high participation with substantial youth unemployment. Nor does participation say anything about hours, wages, formality or job stability. To understand whether active young men are actually finding work, the employment-to-population ratio and the youth unemployment rate need to be read alongside this measure.
Economies with the lowest rates
| Economy | 2024 rate |
|---|---|
| Gabon | 17.442% |
| Korea, Rep. | 21.536% |
| Bulgaria | 23.692% |
| Greece | 25.534% |
| Hong Kong SAR, China | 28.791% |
| South Africa | 28.833% |
| Italy | 29.698% |
| Romania | 30.637% |
| Kosovo | 30.834% |
| Bhutan | 31.265% |
At the lower end, Gabon records 17.442%. The Republic of Korea is at 21.536%, Bulgaria at 23.692% and Greece at 25.534%. Hong Kong SAR, China and South Africa are both just under 29%, followed by Italy at 29.698%. Romania, Kosovo and Bhutan complete the bottom ten, all close to 30–31%. A low value means that fewer young men are in employment or actively seeking work; it does not reveal why they are outside the labor force.
For this age group, education is an especially important alternative to labor-market participation. Longer study can lower participation without indicating economic distress. In other settings, low participation may reflect discouragement, limited job search, family circumstances or weak links between education and work. Those possibilities cannot be separated with this indicator alone. Measures of enrollment, NEET status, employment and unemployment are needed before drawing conclusions about the reason behind a low rate.
Large differences within Europe and the Americas
Europe contains some of the sharpest internal contrasts. The Netherlands is at 83.2% and Iceland at 81.1%, whereas Greece is at 25.5%, Bulgaria at 23.7% and Italy at 29.7%. Denmark, Switzerland and Norway are all above 65%, while Germany is 56.5%, the United Kingdom 53.1% and France 43.2%. Geography alone therefore does not explain how quickly young men enter the labor force.
The Americas are similarly varied. Guatemala stands at 75.1%, Bolivia 66.2% and Paraguay 65.6%. The United States is 56.4%, Canada 62.9% and Mexico 56.9%. Brazil reaches 60.8% and Colombia 50.2%, while Chile and Argentina are lower at 33.4% and 36.9%. The spread within a single broad region is large enough that continent averages would hide much of the useful variation.
Asia and Africa do not follow one pattern
In Asia, Japan is at 49.6%, India 46.7%, Thailand 45.7% and Viet Nam 43.1%. Hong Kong SAR, China is much lower at 28.8%, while Qatar and the United Arab Emirates are high at 69.4% and 65.0%. Differences in education, migration, labor demand and institutional arrangements mean that nearby economies can occupy very different parts of the distribution.
Africa also shows strong contrasts. Tanzania is among the highest observations in the dataset at 77.4%, and Nigeria is 64.0%. Gabon, by contrast, is the minimum at 17.4%, and South Africa is 28.8%. These gaps should not be reduced to one explanation such as income level or industrial structure. Informal work, schooling, survey systems and the way young people move between education and work can all matter.
Why employment and unemployment need to be added
Participation, employment and unemployment use related but different denominators. The participation rate divides the labor force by the age-group population. The employment-to-population ratio divides employed people by that population. The unemployment rate divides unemployed people by the labor force. A country can therefore have high participation and high unemployment at the same time, or low participation and low unemployment because many young people are not in the labor force.
Reading the three indicators together separates two questions that are often mixed up: are young men entering the labor market, and are those who enter finding work? This distinction is particularly important for ages 15–24 because education keeps a large share of the population outside the labor force in some economies. A comparison based on one indicator alone can easily mistake extended schooling for labor-market weakness or overlook discouraged young people who are no longer seeking work.
The national-estimate label matters
The indicator code is World Bank SL.TLF.ACTI.1524.MA.NE.ZS and the series is labeled a national estimate. That matters because national-estimate series may differ from harmonized or modeled ILO estimates that use a different methodology. Two series with nearly identical names can therefore produce different values for the same economy and year. Comparisons should keep the indicator code, age range, sex, estimate type and year consistent instead of mixing national observations with another labor-market series.
The 2024 map is also a cross-section, not a trend analysis. Participation can change when education patterns, demographics, migration or economic conditions shift. A one-year ranking does not establish that an economy has persistently high or low youth participation. A time series would be needed to distinguish long-run structure from a temporary movement. The strength of this map is that it holds the reference year constant while exposing large geographic differences.
Missing data are not zero participation
The geographic frame contains 217 country and economy codes, but only 104 have a 2024 observation. The remaining 113 are kept as missing and are excluded from the mean, median and rankings. They are never filled with 0%. A blank or hatched area on the map therefore means that a comparable 2024 value is unavailable in this dataset, not that no young men participate in the labor force there.
The low-resolution world boundary can represent 96 of the 104 valid observations as separate polygons. Small islands and separately reported places such as Barbados, Hong Kong, Saint Lucia, Malta, Mauritius, Nauru, Singapore and Seychelles are retained in the dataset and statistical summaries even when they are not visible as independent map surfaces. That is a cartographic limitation rather than missing analytical data.
How to read the 2024 map
The most useful interpretation is not to label high rates as good and low rates as bad. Higher participation can reflect earlier entry into work, stronger labor demand, more job search or less time spent in education. Lower participation can reflect longer schooling, weak job search, discouragement or other reasons for staying outside the labor force. These mechanisms have very different implications even if they produce the same rate.
For a fuller view, compare this indicator with the male youth employment-to-population ratio, youth unemployment, school enrollment and NEET rates for the same age group and year. A female youth participation series can also show whether the transition from education to work differs by sex. Together, those measures separate labor-market entry, actual employment and non-participation instead of asking one participation rate to answer every question about young people and work.
Frequently asked questions
What does male labor force participation at ages 15–24 measure?
It is the share of men ages 15–24 who are in the labor force, meaning they are either employed or unemployed and actively seeking work. It is not the employment rate.
Does a high participation rate mean youth employment conditions are strong?
Not necessarily. Unemployed job seekers are included in the labor force, so participation can be high even when youth unemployment is also high.
Were economies without a 2024 value treated as 0%?
No. The 113 missing observations remain missing and are excluded from the mean, median and rankings.
Related Articles
Green Map creates custom-edited map images using open geographic data sources such as geoBoundaries, Natural Earth, OpenStreetMap, and government open data. These maps are edited visual materials, not raw data files, and are provided for education, documents, presentations, and graphic reference.