Labor-force participation among people with basic education differs sharply across the places that reported a 2023 value. The World Bank series used here contains 106 valid observations for the year, while 111 country or territory records have no reported value. The highest and lowest observations are separated by more than 80 percentage points, so a single global average hides substantial variation.
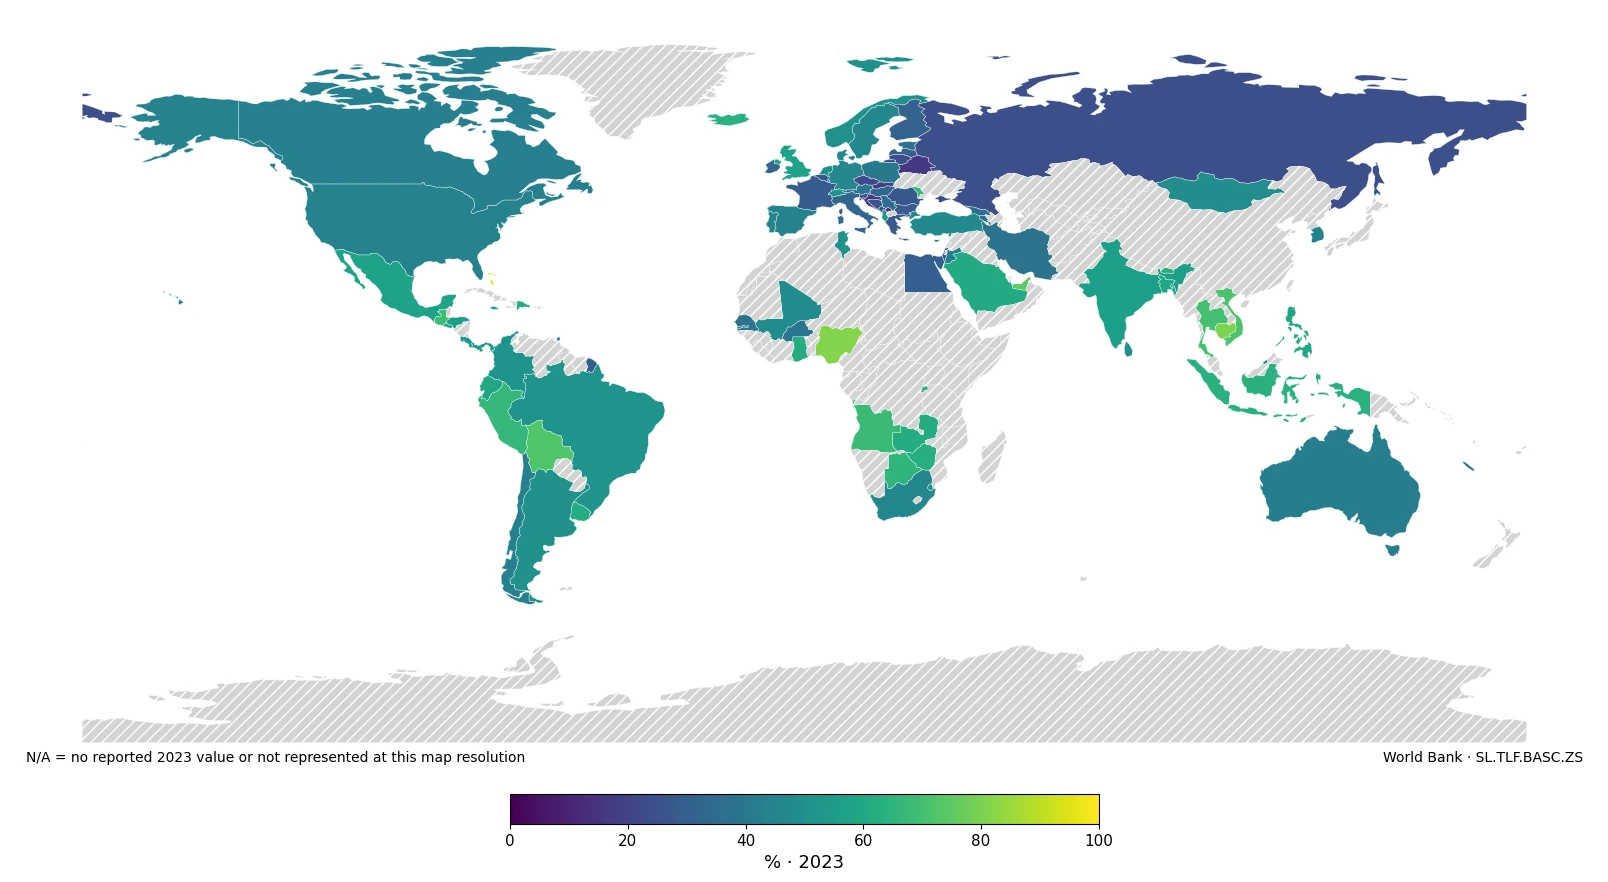
Table of Contents
What the indicator measures
The World Bank indicator SL.TLF.BASC.ZS is defined as labor force with basic education as a percentage of the total working-age population with basic education. In practical terms, the numerator is the number of people in the basic-education group who are in the labor force, and the denominator is the working-age population in that same education group. A value of 60% therefore means that roughly six in ten working-age people with basic education are employed or unemployed and actively part of the labor force.
Basic education follows ISCED 2011 and covers primary or lower-secondary education. The denominator matters: this is not the share of the entire labor force that has basic education. It is a participation measure within a particular education group. Countries with very different education distributions can therefore post similar values even though the size and composition of their basic-education populations are not comparable.
How wide is the 2023 distribution?
Across the 106 valid observations, the mean is 47.4% and the median is 46.7%. The first quartile is 36.9% and the third quartile is 58.3%. Seventeen reporting economies fall below 30%, another 17 are between 30% and 40%, 26 are between 40% and 50%, 23 are between 50% and 60%, and 23 are at 60% or above. The distribution is therefore broad rather than concentrated around one narrow band.
The Bahamas has the highest reported value at 95.6%, while Kosovo has the lowest at 13.9%. Those endpoints should not be read as a league table of labor-market quality. Participation says whether people are in the labor force, not whether jobs are well paid, stable, formal, or full time. It also includes unemployed people who are actively seeking work.
Highest reported values
| Economy | 2023 share |
|---|---|
| Bahamas, The | 95.6% |
| St. Lucia | 84.8% |
| Nigeria | 81.6% |
| Cambodia | 80.3% |
| United Arab Emirates | 74.3% |
| Bolivia | 72.3% |
| Viet Nam | 71.5% |
| Thailand | 70.2% |
| Guatemala | 68.6% |
| Angola | 67.8% |
The upper end is geographically mixed. Caribbean economies such as The Bahamas and St. Lucia appear alongside Nigeria and Angola in Africa and Cambodia, Viet Nam, and Thailand in Southeast Asia. This matters because it argues against treating a high value as the signature of one regional labor-market model. Similar participation rates can emerge under very different demographic, educational, and employment structures.
Southeast Asia contains several notable high observations: Cambodia is at 80.3%, Viet Nam at 71.5%, Thailand at 70.2%, and Indonesia at 63.5%. Yet the wider Asian distribution is not uniformly high. The map is better read as a patchwork of country-level outcomes than as a simple continent-wide gradient.
Lowest reported values
| Economy | 2023 share |
|---|---|
| Kosovo | 13.9% |
| Croatia | 15.7% |
| Belarus | 15.8% |
| Slovak Republic | 18.0% |
| Czechia | 21.7% |
| Russian Federation | 23.8% |
| Lithuania | 23.9% |
| Montenegro | 25.2% |
| Bosnia and Herzegovina | 25.4% |
| Slovenia | 26.0% |
Many of the lowest observations are in Europe. Kosovo is at 13.9%, Croatia at 15.7%, Belarus at 15.8%, the Slovak Republic at 18.0%, and Czechia at 21.7%. Russia, Lithuania, Montenegro, Bosnia and Herzegovina, and Slovenia are also in the twenties. That does not mean European labor-force participation in general is low; it means the basic-education group has a low participation ratio in these particular observations.
Nearby countries can diverge strongly. Moldova records 66.4%, whereas Romania is at 27.2%. Such contrasts are a reminder that the composition of the basic-education population, age structure, gender participation, retirement patterns, and other factors can differ substantially even within the same part of the world. This series identifies the gap but does not assign a cause to it.
Spatial patterns and local contrasts
The map shows a visible cluster of relatively low values across parts of Europe, while several countries in Southeast Asia, Africa, and the Caribbean sit in higher bands. The pattern is not continuous. In North America, the United States is at 44.2%, Canada at 42.9%, and Mexico at 57.8%. In South America, Bolivia stands out at 72.3% compared with lower values elsewhere in the region.
Africa also spans a wide range. Nigeria reports 81.6%, Angola 67.8%, Rwanda 65.0%, Botswana 64.9%, and Ghana 61.3%, while South Africa is at 45.9%. The continent cannot be summarized accurately with a single directional statement. What the data support is a picture of substantial cross-country variation within regions as well as between them.
The Caribbean provides another example. The Bahamas is at 95.6% and St. Lucia at 84.8%, while Barbados is 54.4% and Grenada 48.9%. Some small island economies are not drawn as separate polygons in the low-resolution base map. All 106 valid observations remain in the statistical calculations and tables, but only 95 can be represented by a polygon at this map resolution.
What a high or low value cannot tell you
A high value means a larger share of the working-age basic-education group is in the labor force. It does not measure wage levels, job security, productivity, hours worked, social insurance, or working conditions. Because unemployed job seekers are part of the labor force, participation can be high even where unemployment is also elevated. A low value can also reflect many different forms of non-participation, including study, caregiving, disability, retirement, or discouragement.
The indicator is also conditional on education level. In countries where most working-age adults have completed upper-secondary or tertiary education, the remaining basic-education group may be smaller and demographically different from the same group elsewhere. That makes it risky to use this measure alone as a summary of national labor-market strength.
Coverage, missing values, and comparability
The 2023 dataset contains 217 country or territory codes after aggregate World Bank groups are excluded. Only 106 have a value for this indicator in that year; 111 are preserved as missing. Missing is not zero. It simply means a 2023 observation was not available in the source, so those records are excluded from rankings and summary statistics rather than treated as non-participation.
The count of reporting economies is also not the same as a sovereign-state count. The World Bank may report certain territories separately. For time-series work, coverage can change from year to year, so a clean trend analysis should either compare the same set of places or explicitly disclose changes in the reporting sample.
How to use this measure with other labor indicators
A useful companion is the unemployment rate for people with basic education. Participation tells us how many people are in the labor force; unemployment tells us how many members of that labor force are without work and seeking a job. Reading the two together helps distinguish low participation from high job-search activity without employment.
Education-level comparisons are also informative. Placing basic, intermediate, and advanced education participation rates side by side can show whether labor-force attachment rises or falls across education groups within a country. The comparison should use compatible years and definitions, because a mismatch in period or population can create a false difference.
Gender- and age-specific participation rates add a third layer. Two economies with similar overall values for the basic-education group may have very different gaps between women and men or between younger and older adults. Those distributions are outside the scope of this single series, so they should be checked before making claims about policy or labor-market institutions.
Source and calculation notes
The underlying observations come from World Bank World Development Indicators, series SL.TLF.BASC.ZS. This article uses the 2023 observation for each reporting country or economy, excludes World Bank aggregate groups, and retains source-missing records as NA. No missing value is imputed or converted to zero. The map is generated from the same verified values used in the tables.
The most useful reading of this dataset is descriptive rather than judgmental. It shows how differently people with basic education participate in national labor markets and highlights where nearby economies diverge. It is a starting point for deeper analysis with unemployment, education composition, age, and gender indicators rather than a standalone score of labor-market performance.
Frequently Asked Questions
What does labor-force participation with basic education mean?
It is the share of the working-age population with basic education that is in the labor force, meaning employed or unemployed and actively participating. It is not the share of the whole labor force that has basic education.
Which economies have the highest and lowest 2023 values?
Among the 106 valid World Bank observations, The Bahamas is highest at 95.6% and Kosovo is lowest at 13.9%.
Are missing 2023 values treated as zero?
No. The 111 source-missing country or territory records remain missing and are excluded from rankings and summary statistics.
Related Articles
Green Map creates custom-edited map images using open geographic data sources such as geoBoundaries, Natural Earth, OpenStreetMap, and government open data. These maps are edited visual materials, not raw data files, and are provided for education, documents, presentations, and graphic reference.