In 2024, 154 countries and economies had both rural and urban World Bank observations that could be matched on the same year. Rural open-defecation rates were higher than urban rates in 84 of them, both rates were exactly zero in 56, and urban rates were higher in 14. The widest gap appeared in Niger, where the rural rate was 78.07% and the urban rate 7.94%, a difference of 70.12 percentage points. This article compares the official rural and urban indicators directly and uses the separate total-population indicator only as a supporting reference; it does not derive a national total by averaging the two residence-specific rates.
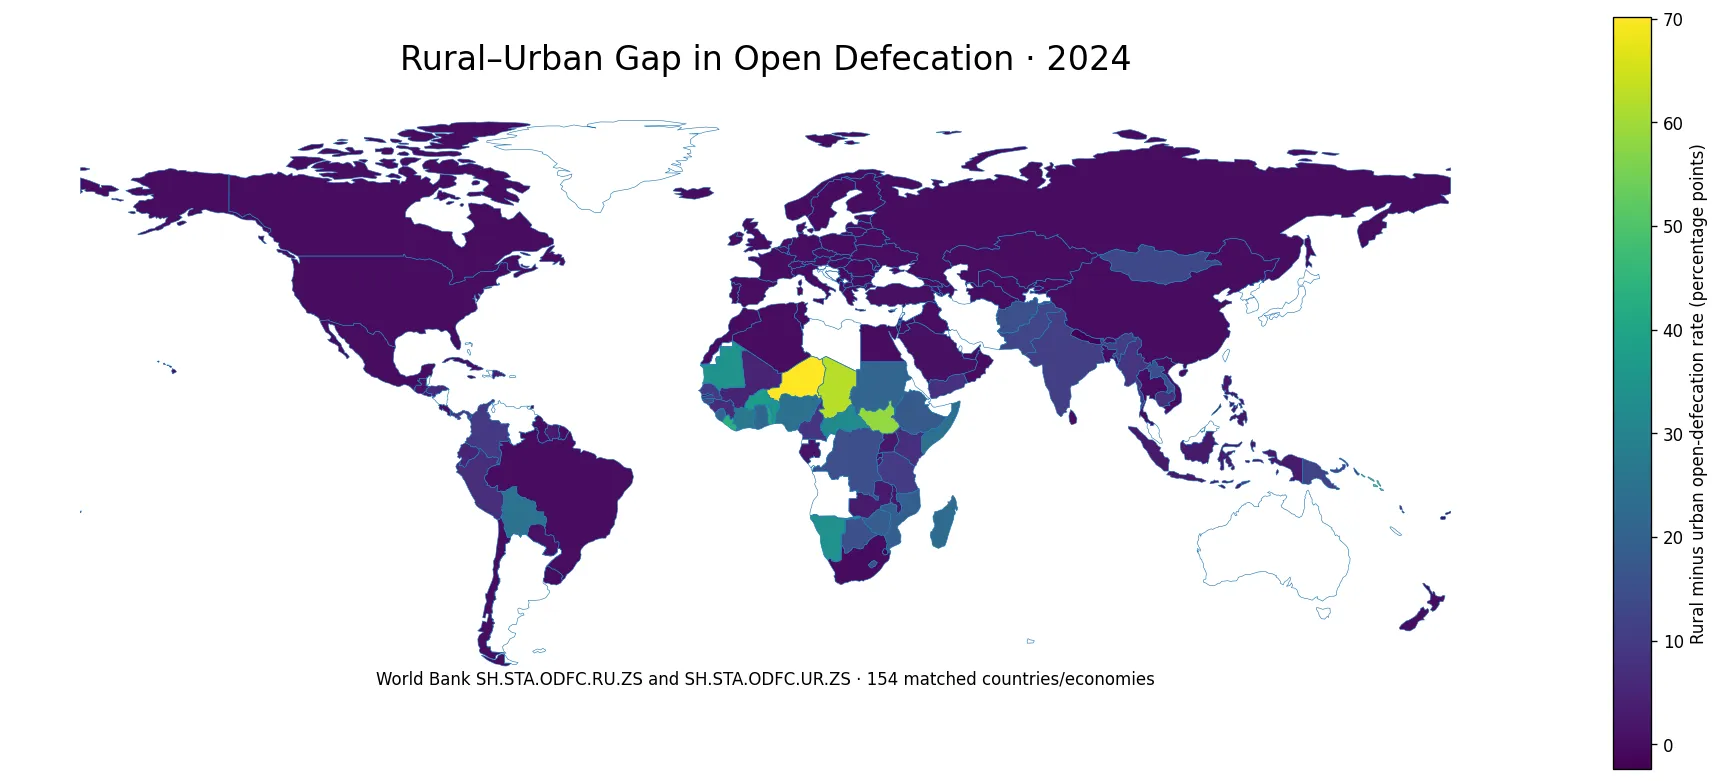
Table of Contents
What the rural and urban indicators measure
World Bank indicator SH.STA.ODFC.RU.ZS measures people practicing open defecation as a percentage of the rural population, while SH.STA.ODFC.UR.ZS measures the same behavior as a percentage of the urban population. The World Bank definition covers defecation in fields, forests, bushes, open bodies of water, beaches and other open spaces, as well as disposal with solid waste. Both series are percentages, but their denominators are different. One is based on the rural population and the other on the urban population, so the difference between them is a residence-based sanitation gap rather than a share of the national population.
That distinction matters whenever the rural and urban populations are unequal, which is common. A simple arithmetic average of the two percentages does not produce a valid national rate because it gives equal weight to two populations that may be very different in size. The official total-population series is SH.STA.ODFC.ZS. For the rural–urban comparison, only observations with the same 2024 year and a reported value in both residence series were retained. Missing observations were left missing rather than converted to zero.
Rural rates were higher in most matched observations
Among the 154 matched observations, the rural rate exceeded the urban rate in 84 cases. Urban rates were higher in 14, while 56 countries and economies reported zero for both rural and urban populations. This pattern shows that rural disadvantage is common among places where open defecation remains present, but it is not universal. A residence comparison is therefore more informative than assuming that every country follows the same rural-above-urban pattern.
The medians were low: about 0.18% for rural areas and 0.03% for urban areas. The means were much higher, at 8.97% and 1.84%, because a smaller set of high-value observations pulls the averages upward. The median rural-minus-urban gap was only 0.07 percentage points, yet the 90th percentile was about 23.82 points. In other words, many countries had little or no difference, while a much smaller group had very large residence disparities.
Niger, Chad and South Sudan had the widest gaps
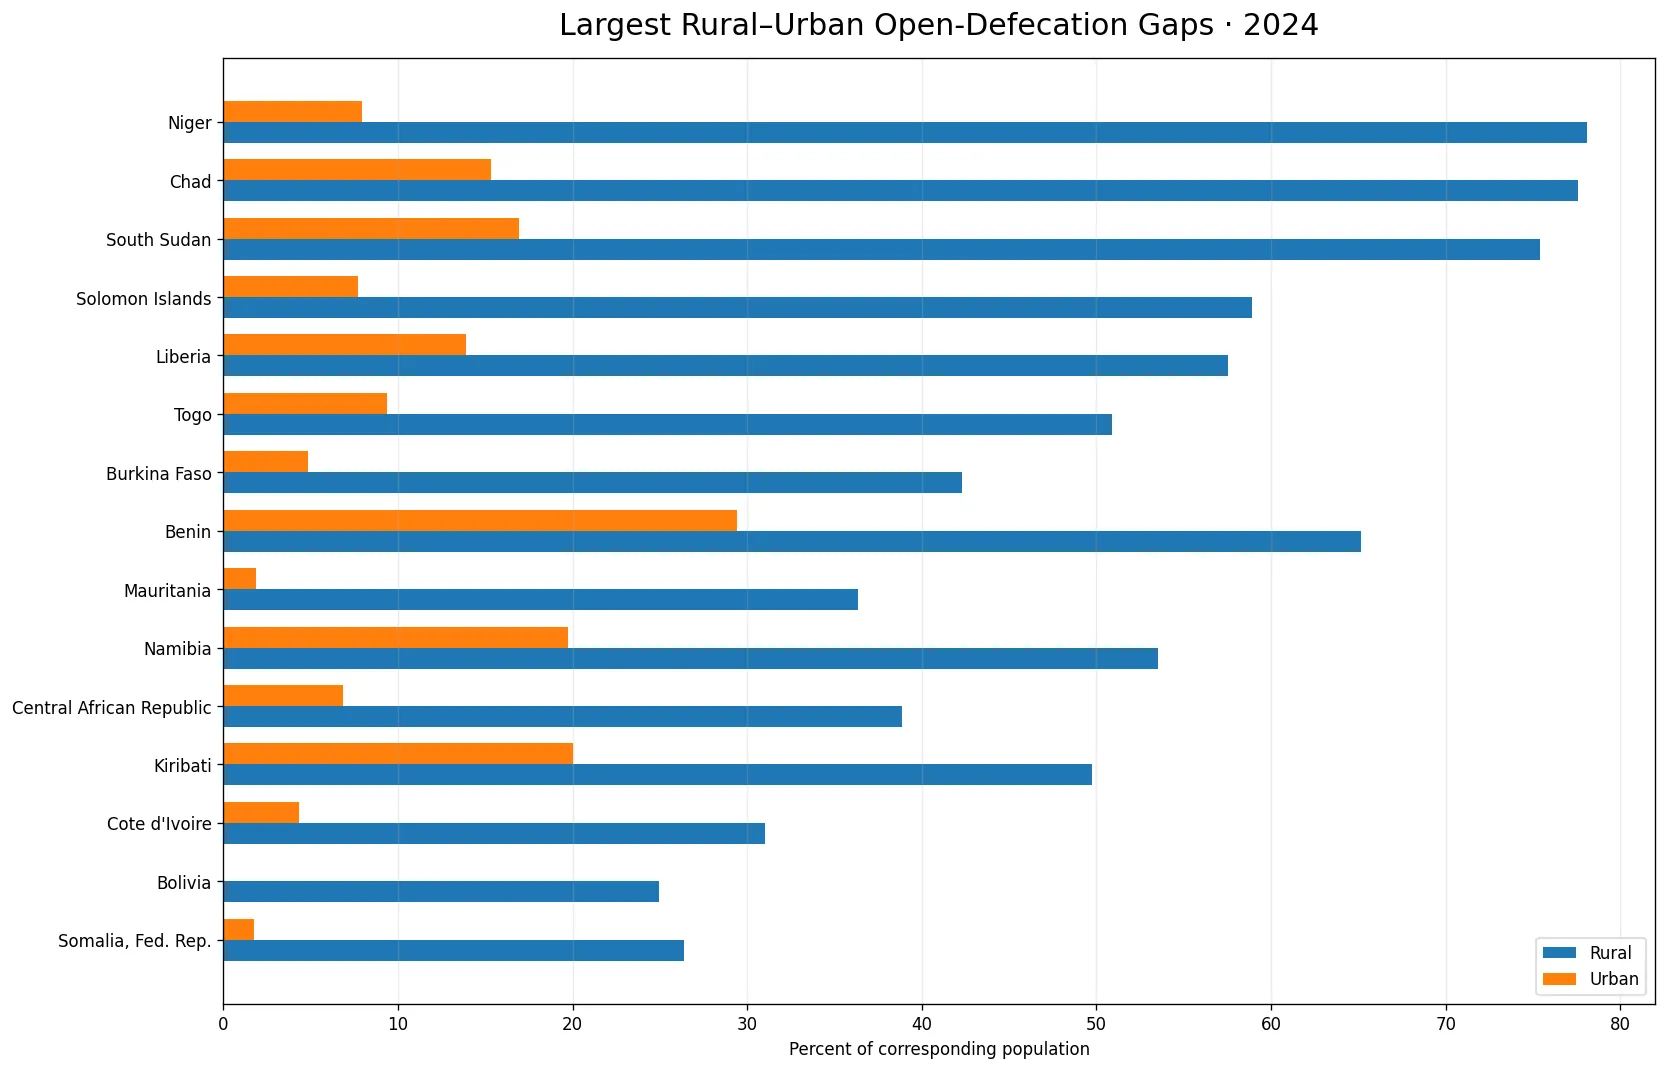
Niger recorded the largest difference in 2024. Its rural rate was 78.07% compared with 7.94% in urban areas, producing a 70.12-point gap. Chad followed with 77.59% rural and 15.35% urban, a 62.24-point difference. South Sudan recorded 75.40% rural and 16.95% urban, a 58.45-point gap. The Solomon Islands had a 51.18-point difference, while Liberia and Togo also exceeded 40 percentage points.
These contrasts can be obscured by a single national figure. Niger’s official total-population rate was 65.98% in the same year, which lies between the rural and urban values but is far from their simple average of roughly 43.01%. Chad’s official total was 62.22%, again reflecting the population distribution between residence categories rather than equal weighting. The comparison demonstrates why the total, rural and urban indicators should be read together without substituting one for another.
Zero values and very large gaps coexist
Fifty-six matched observations reported exactly 0% for both rural and urban populations. These are reported zeros, not missing observations. Eighteen additional cases had a positive rural rate with an urban rate of zero, while 11 had a rural rate of zero and a positive urban rate. Treating every zero as missing would erase meaningful information; treating every missing observation as zero would create information that was not reported.
The distribution is strongly skewed. The 75th percentile of the rural-minus-urban gap was about 9.73 percentage points, while the 90th percentile reached about 23.82 points. This means the upper tail contains countries with disparities far larger than the typical observation. A national comparison is therefore best read with both levels and gaps: the rural rate, the urban rate, the percentage-point difference, and, where needed, the separately reported total-population rate.
A small group had higher urban rates
Fourteen matched observations had urban rates above rural rates. Nepal showed the largest reverse gap: 0% rural and 2.38% urban, so the urban rate was 2.38 percentage points higher. Eswatini recorded 0% rural and 1.44% urban. Antigua and Barbuda, South Africa, Samoa and Jamaica also had urban rates modestly above rural rates. These differences were generally smaller than the largest rural-above-urban gaps, but they are important exceptions to a broad pattern.
The indicator by itself does not establish why those exceptions occur. Informal settlements, uneven service coverage within cities, settlement classification, demographic structure and measurement practices could matter, but those explanations require additional evidence. The defensible conclusion is limited to the observed values: in those countries and economies, the reported 2024 urban percentage exceeded the rural percentage. Explaining the cause would require supporting sanitation-service, infrastructure and population data.
The total-population rate is not the average of rural and urban rates
World Bank indicator SH.STA.ODFC.ZS measures open defecation as a percentage of the total population. In this integrated comparison it serves as a third, complementary indicator. Because the rural and urban percentages apply to different population sizes, the total depends on the population weights of the two residence groups. It should therefore be taken from the official series rather than estimated by averaging the rural and urban percentages.
The Solomon Islands illustrate the point: rural 58.89%, urban 7.71%, and total 45.34%. Liberia recorded 57.52% rural, 13.89% urban and 33.92% total. Benin reported 65.15% rural, 29.41% urban and 47.04% total. In each case the total is consistent with a population-weighted national measure, not an equal-weight mean. If the official total observation is unavailable, the residence-specific percentages alone are insufficient to create a valid total without the corresponding population weights.
What this comparison can and cannot tell us
The rural–urban gap is useful for identifying spatial inequality in sanitation conditions. A very high rural rate alongside a much lower urban rate shows that a national average can conceal a large residence divide. Conversely, low values in both residence groups indicate little open defecation in either category. Yet this indicator measures one sanitation behavior only. It does not directly measure safely managed sanitation, sewerage quality, toilet condition, water reliability or the full sanitation service ladder.
It is also not a standalone ranking of health-system or policy performance. Countries differ in urbanization, geography, population distribution and data systems. A one-year cross-section can identify where gaps are large, but it cannot show why they arose or whether a policy caused them to narrow. Trend analysis requires the same indicators over multiple years with consistent definitions. Causal interpretation requires additional evidence beyond the percentages shown here.
Coverage and comparison method
The 2024 rural series contained reported values for 155 countries and economies and preserved 62 without a value. The urban series contained 169 reported values and 48 missing observations. Matching on ISO3 code and year produced 154 cases with both values present. The gap was calculated as rural percentage minus urban percentage. Positive numbers indicate a higher rural rate; negative numbers indicate a higher urban rate. No missing observation was replaced with zero.
The map displays that percentage-point gap, while the comparison chart places rural and urban rates side by side for the 15 largest gaps. The World Bank country and economy master can include separately reported territories and economies, so the observation count should not be read as a count of sovereign states. The official World Bank series are SH.STA.ODFC.RU.ZS for rural, SH.STA.ODFC.UR.ZS for urban, and SH.STA.ODFC.ZS for the total population.
How to read the numbers safely
First, remember that rural and urban rates use different denominators. Second, interpret the difference in percentage points, not as a relative percentage increase. Third, keep reported zero values separate from missing data. Fourth, use SH.STA.ODFC.ZS when a total-population percentage is needed instead of averaging the residence rates. Fifth, avoid inferring causes from a single year. These rules keep the comparison aligned with the official definitions.
For example, Niger’s 70.12-point gap means that the share of the rural population practicing open defecation was 70.12 percentage points higher than the corresponding share of the urban population. It does not mean the rural population was 70.12% larger, nor does it mean 70.12% of the national population was in a rural-only category. Nepal’s -2.38-point gap similarly means the urban rate exceeded the rural rate by 2.38 points. The sign and denominator are essential to interpretation.
Frequently Asked Questions
Where was the largest rural–urban open-defecation gap in 2024?
Niger. The rural rate was 78.07% and the urban rate 7.94%, a rural-above-urban difference of 70.12 percentage points.
Can the rural and urban percentages be averaged to get the national rate?
No. They use different population denominators. The total-population rate should come from the official World Bank SH.STA.ODFC.ZS indicator.
Does 0% mean the value was missing?
No. Reported zeros were kept as real zero observations, while source-missing values remained missing and were not converted to zero.
Related Articles
Green Map creates custom-edited map images using open geographic data sources such as geoBoundaries, Natural Earth, OpenStreetMap, and government open data. These maps are edited visual materials, not raw data files, and are provided for education, documents, presentations, and graphic reference.