In 2024, Hawaii recorded the largest state value for distillate fuel oil (DFO) consumed for electricity generation in the U.S. Electric Power sector. Its EIA value was 2,511.692 thousand short tons, followed by Alaska at 895.764, Maryland at 468.549, and Virginia at 382.679. The 50 state observations sum to 9,311.275 thousand short tons, and Hawaii alone accounts for 26.97% of that total. The series is defined by fueltypeid=DFO, sectorid=98, field=consumption-for-eg, annual frequency, and 2024. This definition matters because it isolates fuel assigned to electricity generation. It does not include fuel assigned to useful thermal output, which belongs in a broader total-consumption measure.
The metric is a physical fuel-consumption measure, not an electricity-generation measure. Its unit is thousand short tons, so it should not be read as MWh, MMBtu, cost, emissions, or a percentage of the power mix. Physical fuel use also differs from energy-content measures because heat content and conversion efficiency are separate concepts. A state can consume more physical fuel without necessarily producing proportionally more electricity. The ranking therefore answers a narrow descriptive question: where was the physical quantity of DFO used for electricity generation largest in 2024? It does not by itself rank state dependence on oil, generating efficiency, fuel cost, or environmental impact.
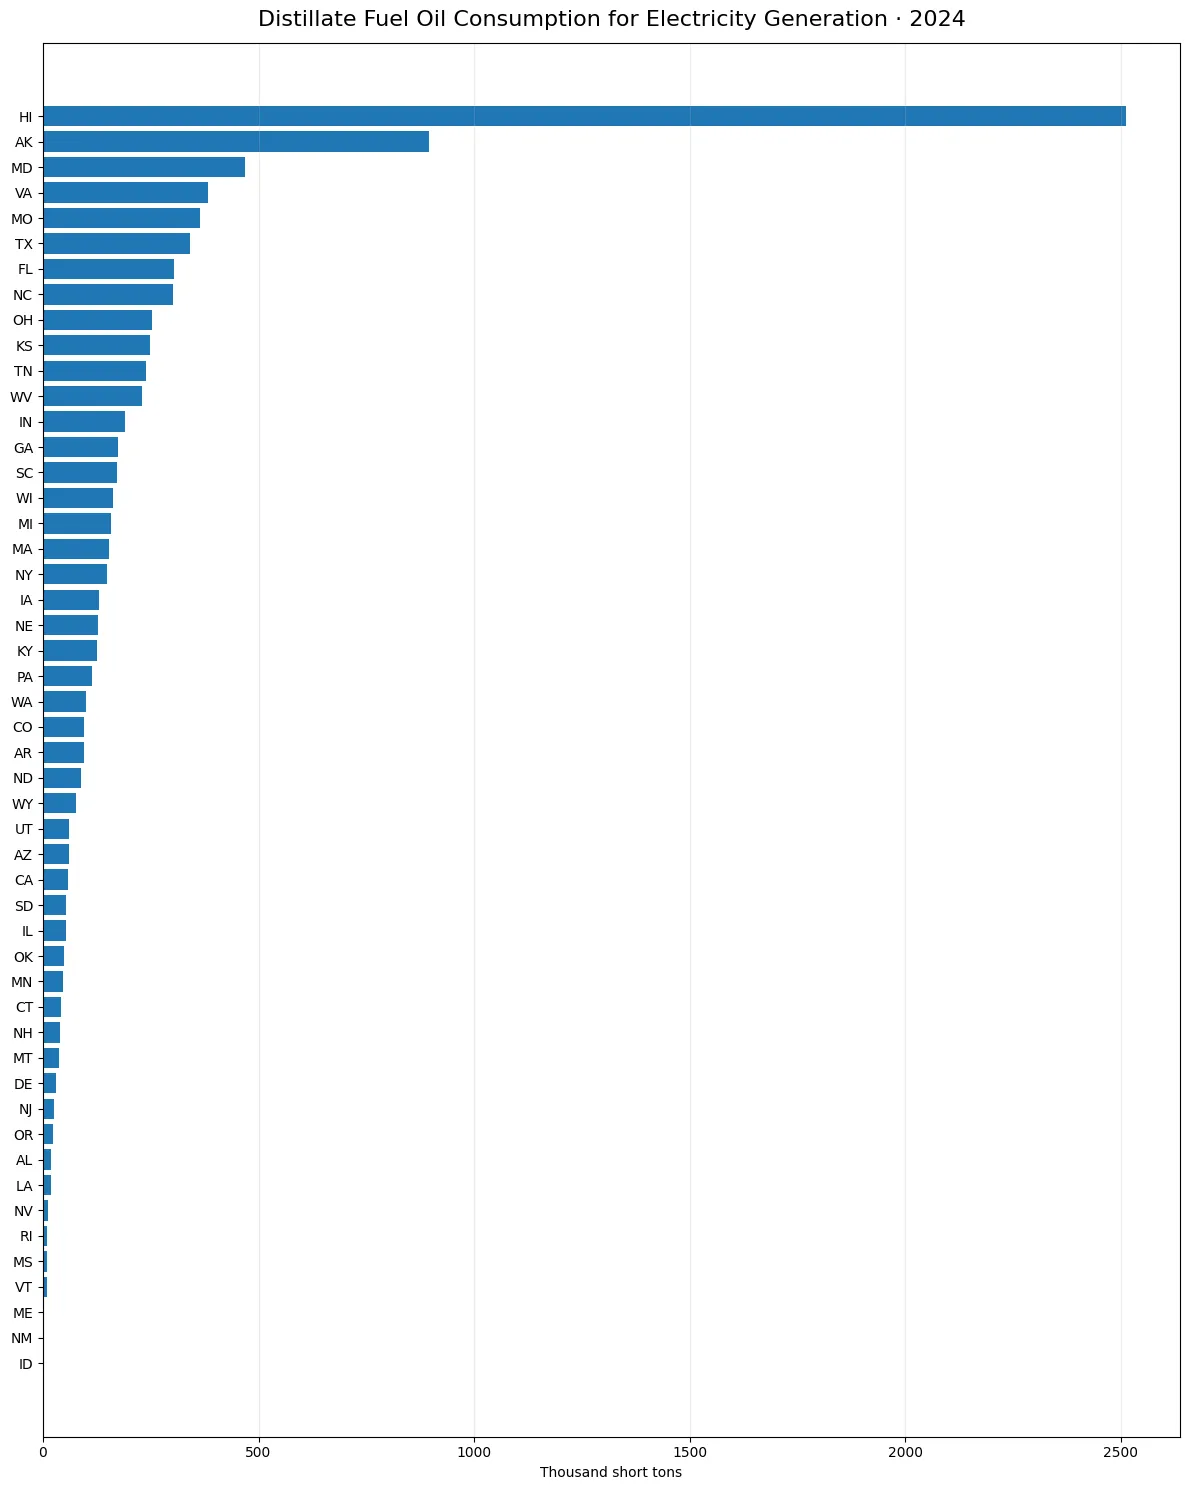
Table of Contents
Hawaii accounts for 26.97% of the 50-state total
Hawaii’s 2,511.692 thousand short tons equal 26.97% of the sum of all 50 states. Alaska contributes 9.62% and Maryland 5.03%. The top three states together account for 41.63% of the total, the top five for 49.65%, and the top ten for 65.21%. This concentration is one of the clearest features of the 2024 distribution. Hawaii is roughly 2.8 times Alaska and more than 26 times the median state value. With such a long upper tail, the arithmetic mean can make the typical state appear larger than it is. The median and quartiles provide a better picture of where most state observations are clustered.
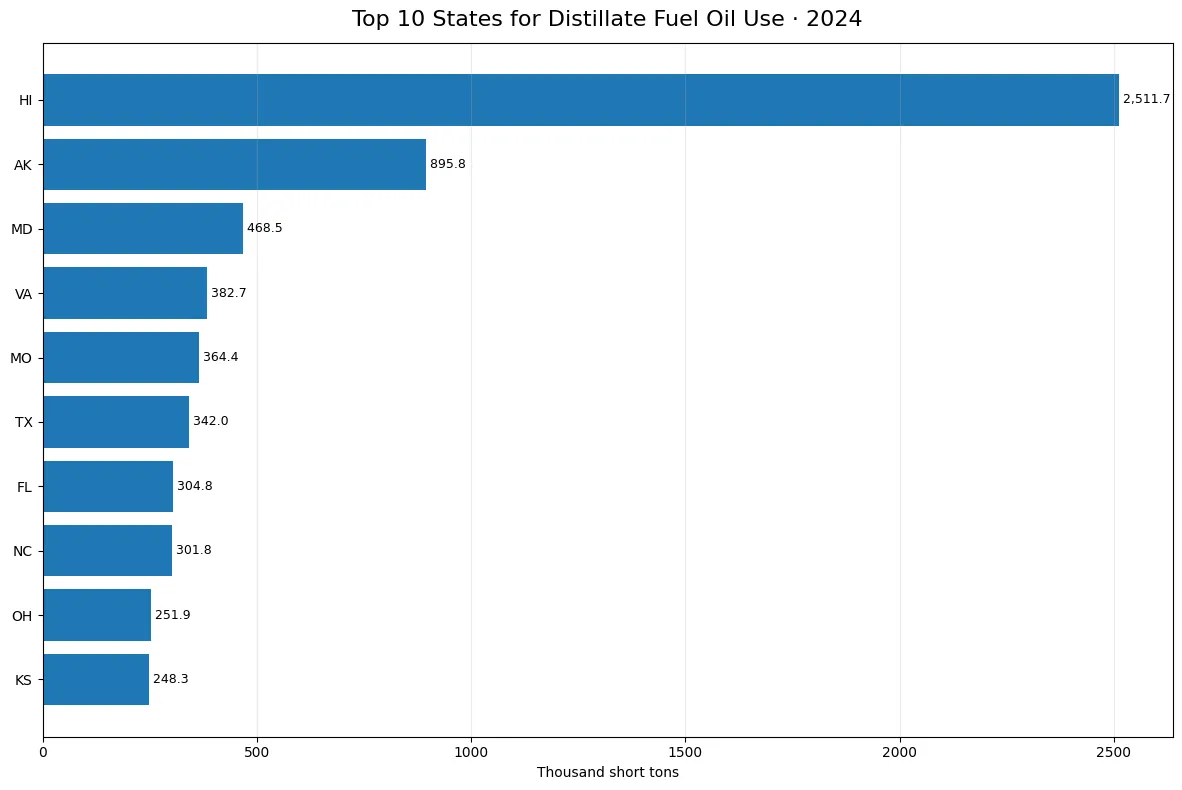
Alaska and Maryland follow, but the gap from Hawaii is substantial
Alaska ranks second at 895.764 thousand short tons and Maryland third at 468.549. Virginia records 382.679, Missouri 364.383, and Texas 342.046. Florida, North Carolina, Ohio, and Kansas complete the top ten. The leading states are geographically diverse, spanning an island state, Alaska, the Mid-Atlantic, the South, and the Midwest. That pattern cautions against attributing the ranking to one geographic factor. Fuel availability, generation fleet composition, dispatch patterns, reserve and peaking needs, local grid conditions, and alternatives to petroleum can all matter, but this annual series does not measure those drivers directly. The ranking should therefore be treated as a comparison of physical fuel input rather than a causal explanation.
| State | DFO for electricity generation (thousand short tons) | Share of 50-state sum |
|---|---|---|
| Hawaii | 2,511.692 | 26.97% |
| Alaska | 895.764 | 9.62% |
| Maryland | 468.549 | 5.03% |
| Virginia | 382.679 | 4.11% |
| Missouri | 364.383 | 3.91% |
| Texas | 342.046 | 3.67% |
| Florida | 304.833 | 3.27% |
| North Carolina | 301.835 | 3.24% |
| Ohio | 251.869 | 2.70% |
| Kansas | 248.311 | 2.67% |
The mean is 186.23, while the median is only 94.97
The 50-state mean is 186.225 thousand short tons and the median is 94.971. The first quartile is 37.435 and the third quartile is 185.579. The mean is almost twice the median because the largest state values pull the average upward. Half of the states are at or below roughly 95 thousand short tons, while the middle half lies between about 37 and 186 thousand short tons. This difference is useful when interpreting the charts. A viewer who sees only the mean might assume that most states use around 186 thousand short tons, but the median shows that a typical middle-ranked state is much lower.
All 50 states have positive observations
The 2024 state series has no missing observations and no exact zeros. Idaho is the smallest value at 0.083 thousand short tons, followed by New Mexico at 2.011, Maine at 2.028, Vermont at 8.925, and Mississippi at 9.613. These very small values are genuine observations rather than placeholders for missing data. Idaho’s 0.083 should not be rounded into a statement that the state used no DFO. Complete coverage is useful because the ranking can be read without mixing reported values with imputed values. It also allows the full distribution from the smallest to the largest state to be shown on the same annual basis.
| Lowest-value state | DFO for electricity generation (thousand short tons) |
|---|---|
| Idaho | 0.083 |
| New Mexico | 2.011 |
| Maine | 2.028 |
| Vermont | 8.925 |
| Mississippi | 9.613 |
| Rhode Island | 10.001 |
| Nevada | 12.557 |
| Louisiana | 18.090 |
| Alabama | 19.213 |
| Oregon | 23.643 |
Electricity-generation consumption is different from total fuel consumption
Even when the fuel facet and sector are unchanged, the field determines what is being measured. The present series uses consumption-for-eg, which covers DFO assigned to electricity generation. A total-consumption field would combine electricity-generation fuel with fuel assigned to useful thermal output. This distinction is especially relevant where facilities produce both electricity and useful heat. Two state comparisons can therefore share the same year, DFO label, and Electric Power sector while still answering different questions. For electricity-generation fuel input, consumption-for-eg is the appropriate field. For the combined fuel requirement of electricity and useful heat, total-consumption is broader.
DFO should also be separated from broader petroleum categories
Distillate fuel oil is one specific petroleum fuel category. EIA series labeled Petroleum or Petroleum Liquids can include a broader set of fuels and therefore produce different state totals and rankings. Similar article titles can be misleading if the fuel facet is not checked. A DFO comparison should not be generalized to all petroleum fuels used by the power sector. The result shown here is limited to the DFO selection used for electricity generation in 2024. Broader petroleum measures can be valuable for a different question, but they should remain separate rather than being merged into this ranking.
Physical units are not interchangeable with energy units
The values in this series are physical quantities. An energy-content series expressed in Btu would answer a related but different question because it incorporates heat content. Likewise, electricity generation in MWh measures output rather than fuel input. Even within a single fuel category, converting physical fuel use into energy or electricity output requires additional information and assumptions. State differences in plant technology and operating conditions can also affect the relationship between input and output. For that reason, Hawaii’s 2,511.692 thousand short tons should be interpreted only as the reported physical quantity in this series, not as an equivalent number of MMBtu or MWh.
Absolute consumption does not equal petroleum dependence
A state can have a large absolute DFO consumption value while DFO represents only a small share of its total power system. Dependence is a relative concept and requires a denominator such as total fuel input or total electricity generation. Large systems can rank high in absolute fuel use but low in percentage terms, while smaller systems can show the opposite pattern. Efficiency is another separate question because it requires comparing fuel energy input with electricity output while accounting for technology. The current values therefore support statements about physical DFO volume but not conclusions about which state is most oil-dependent or least efficient.
What the 2024 distribution clearly establishes
The direct findings are that Hawaii is the largest state by a substantial margin, the top ten states account for 65.21% of the 50-state total, and the median is 94.971 thousand short tons. Every state has a positive reported value. These facts describe a single annual cross-section. They do not establish a long-term trend, identify the causes of state differences, or measure changes in fuel dependence. A year-over-year comparison should keep DFO, sector 98, consumption-for-eg, annual frequency, and the same unit fixed. Changing the fuel category or field would create a comparison between different metrics rather than a time trend.
Source and calculation method
The source is the U.S. Energy Information Administration annual electricity/electric-power-operational-data series. The 2024 comparison uses fueltypeid=DFO, sectorid=98 (Electric Power), field=consumption-for-eg, and the unit thousand short tons across 50 states. The total of 9,311.275, mean of 186.225, median of 94.971, quartiles, rankings, and state shares were calculated directly from the published state observations. No missing value was imputed, no value was converted to zero, and no other year was blended into the calculations. If EIA later revises the 2024 observations, the same series definition can be used to refresh the comparison.
Frequently Asked Questions
Which state used the most distillate fuel oil for electricity generation in 2024?
Hawaii ranked first at 2,511.692 thousand short tons, equal to 26.97% of the 50-state total.
Does this series include fuel used for useful thermal output?
No. The consumption-for-eg field covers fuel assigned to electricity generation. A total-consumption field would also include useful thermal output.
Is DFO the same as a broader Petroleum category?
No. DFO is distillate fuel oil, a specific fuel category. Broader petroleum selections can include additional fuels and produce different totals.
Are any states missing or zero?
No. All 50 states have positive 2024 observations in this series.
Related Articles
Green Map creates custom-edited map images using open geographic data sources such as geoBoundaries, Natural Earth, OpenStreetMap, and government open data. These maps are edited visual materials, not raw data files, and are provided for education, documents, presentations, and graphic reference.