Clay County lies in the rugged southeastern part of Kentucky, where narrow valleys and closely spaced ridges shape both settlement and travel. Manchester is the clearest reference point near the center of the county, while Oneida appears farther northeast along a winding road corridor. The map makes the terrain influence easy to notice: roads rarely form a simple grid because they follow creek valleys, lower passes, and the limited flatter ground between steep hillsides. High-resolution map files are available for download in the section below.
This page brings together the county boundary and road map, a simplified city map, a terrain-and-water map, and an elevation map. High-resolution JPG versions of the same maps can also be downloaded in one ZIP file for printing, classroom use, or closer viewing. These maps are intended for geographic reference and general orientation, not for legal boundary decisions, survey work, flood determinations, or real-time navigation.
Table of Contents
Manchester as the road reference point in a steep county
Manchester stands out immediately on the general county map because several numbered routes meet in and around the city. Routes 421, 11, 80, 149, and 687 provide the clearest local reference, while 421 continues toward the eastern side of the county and 66 reaches the southeastern edge. Route 577 marks part of the northern interior, and 472 enters from the west. Rather than radiating across open land, many of these roads bend repeatedly as they pass through the surrounding hills.
The northeast route toward Oneida is a good example. It follows a long, curving corridor through a narrow valley and crosses an area where the drainage network becomes especially dense. Roads east and southeast of Manchester show a similar pattern, with frequent bends and short connectors leading into side valleys. On a flat map the distance between two places may seem modest, but the shape of the road network suggests why actual travel can be longer than a straight-line measurement.
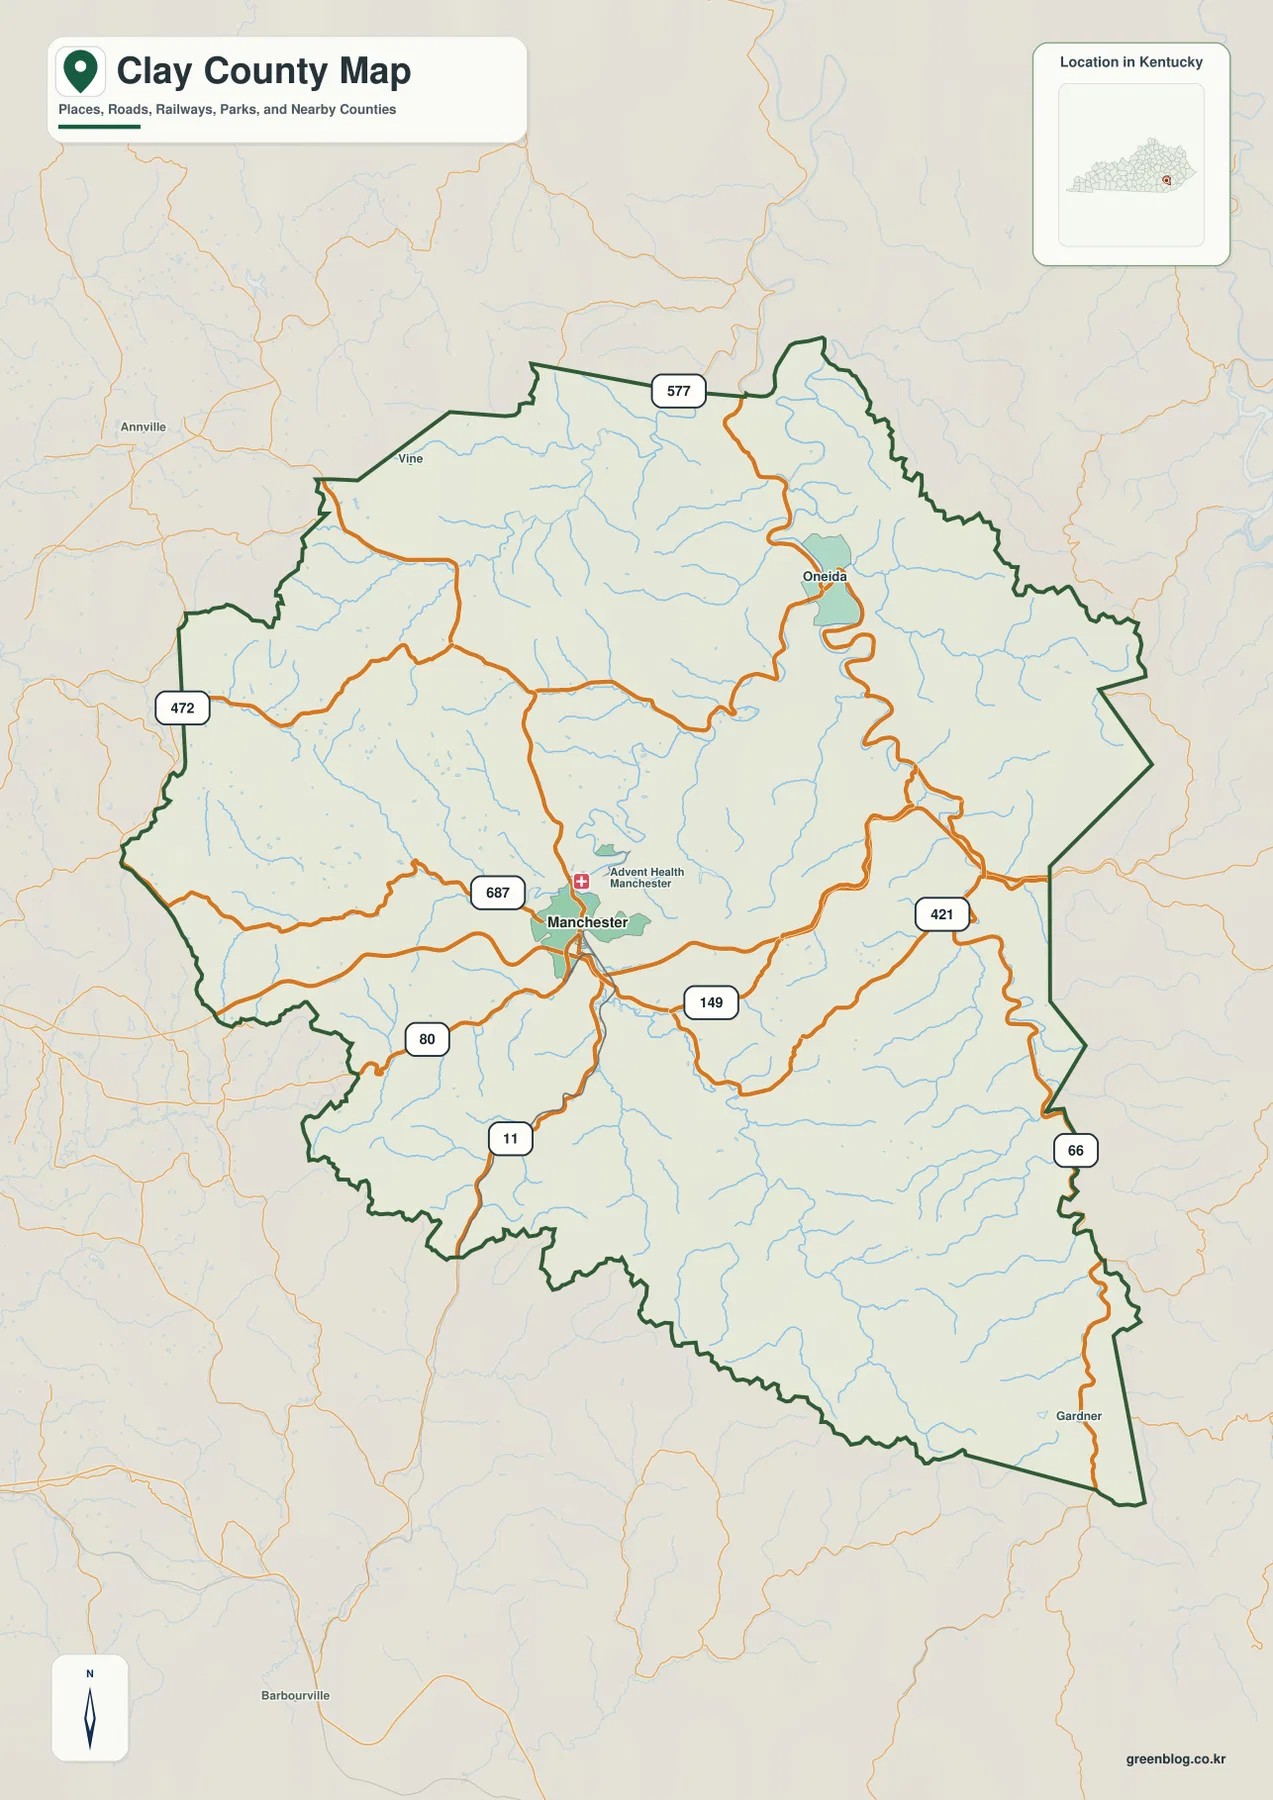
The general map also shows nearby places outside the county, including Annville to the northwest and Barbourville to the southwest. Those labels help orient Clay County within southeastern Kentucky even though they are not destinations inside the county itself. A hospital symbol near Manchester provides another useful landmark. Away from the city, the spacing between major roads increases, and the map becomes dominated by winding local corridors and streams.
For trip planning, the map is best used to understand the broad relationship between Manchester, Oneida, the county line, and the larger numbered routes. It does not show every local road or current road condition. Closures, construction, bridge restrictions, and turn-by-turn directions can change, so drivers should pair this static reference map with current transportation or navigation information.
Why the city map highlights Manchester alone
The city index map deliberately removes much of the road detail and highlights Manchester as the single ranked major city in the supplied dataset. That simple design makes the city’s position within the county easier to see. Manchester sits a little southwest of the county’s geometric center, with a large amount of mountainous territory extending north, east, and southeast from it.
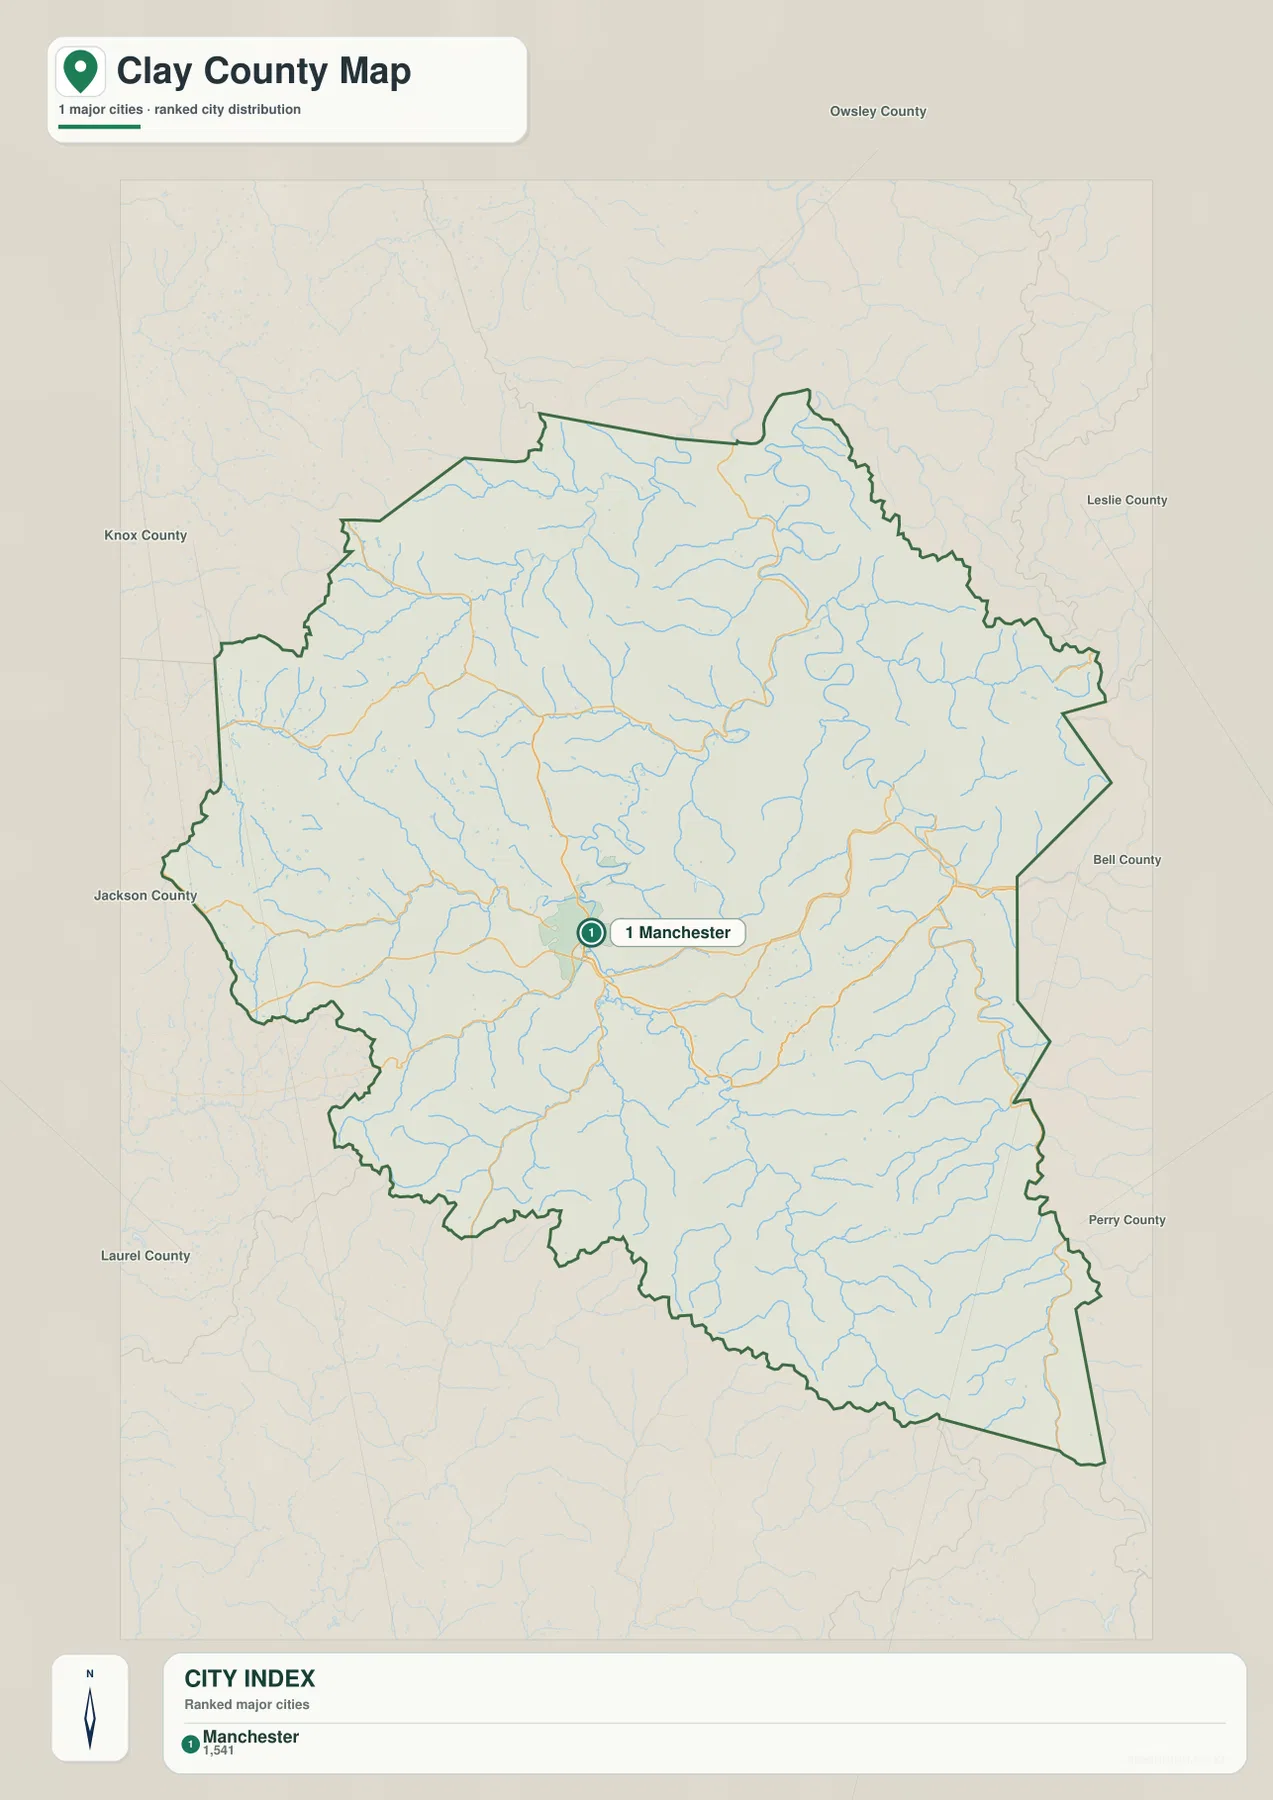
Neighboring county labels add useful regional context. Owsley County is shown to the north, Leslie County to the northeast, Bell County to the east, Perry County to the southeast, Laurel County to the southwest, Jackson County to the west, and Knox County toward the northwest. The surrounding labels help place Clay County within the broader mountain region without filling the map with extra town names.
Manchester is not the only named place visible in the full map, but it is the strongest urban reference in this city-focused layer. Oneida, for example, appears on the general map farther northeast but is not treated as a ranked major city on this simplified version. Using both maps together avoids a common mistake: assuming that a city-index map is a complete inventory of every community or settlement.
The simplified map is especially useful when a presentation, school project, or county overview needs one clean locator rather than a dense road network. It can show where Manchester sits within the county and how the county relates to its neighbors. For exact jurisdictional lines or address-level questions, however, an official boundary dataset should be used rather than relying on the visual thickness of the county outline.
South Fork Kentucky River and the creek valleys around it
Waterways reveal much of Clay County’s physical character. The South Fork Kentucky River curves through the northern and northeastern part of the county, with smaller tributaries entering from steep side valleys. In the northwest, Little Sexton Creek and Sexton Creek are labeled, while Laurel Creek, Beech Creek, and Bear Creek occupy the central part of the map. Their shapes follow the folded terrain rather than running in straight lines.
West and southwest of Manchester, Little Goose Creek and Horse Creek provide strong landmarks. Collins Fork runs through the southwestern interior, and Goose Creek becomes a prominent watercourse farther south. Spring Creek appears near the southeastern edge. These named streams are only a portion of the many small channels visible on the map, which together form a dense network across the county.
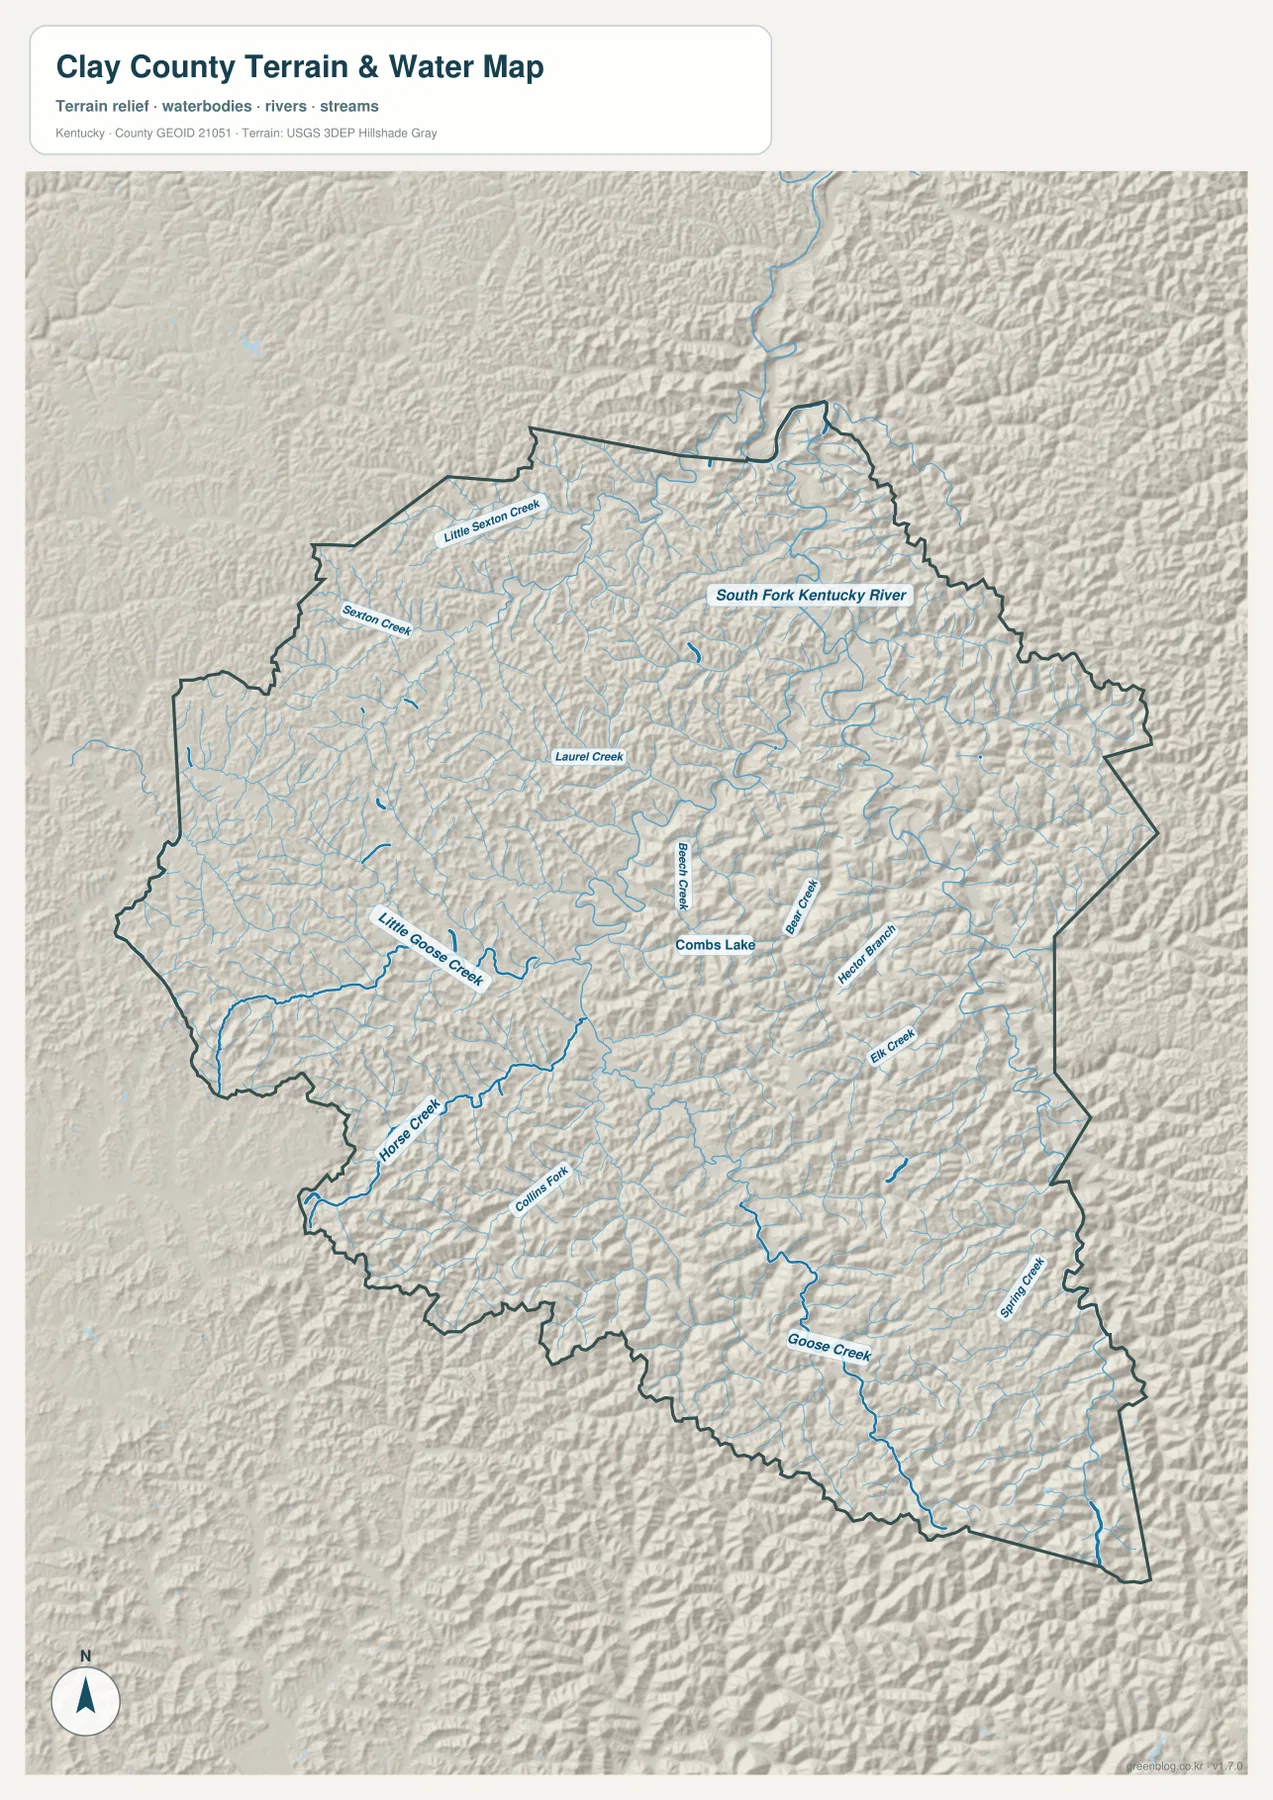
Combs Lake is labeled near the central part of the county and helps anchor the local drainage picture. Hectors Branch and Elk Creek appear to the east, and short tributaries feed into the larger channels from both sides of the ridges. When this layer is compared with the road map, many of the road bends make more sense because transportation corridors often occupy the same lower valley floors as the streams.
The terrain shading also shows how quickly the land rises away from the water. Creek valleys are narrow, and ridges often sit close to one another, leaving relatively little broad flat ground. This relationship is important for understanding the map, but the water layer should not be used to judge present river stage, flood probability, water quality, navigability, or property access. Those questions require current information from the appropriate agencies.
From 210 to 677 meters: high ridges east and southeast of Manchester
The elevation map gives Clay County an actual mapped range of about 210 to 677 meters, with a mean elevation of about 366 meters. Lower green tones follow Manchester and many of the larger creek valleys, while higher yellow, orange, and brown tones become much more common toward the east and southeast. The difference is not a single broad slope; it appears as repeated ridges separated by narrow, lower valleys.
The southeastern corner is the most striking high-relief area on the map. Closely spaced ridges rise well above the valley floors, and several bands reach around 500 meters or more. Eastern Clay County also contains many elevated ridgelines. By comparison, the west and northwest include larger areas of lower green terrain, although they remain hilly rather than flat.
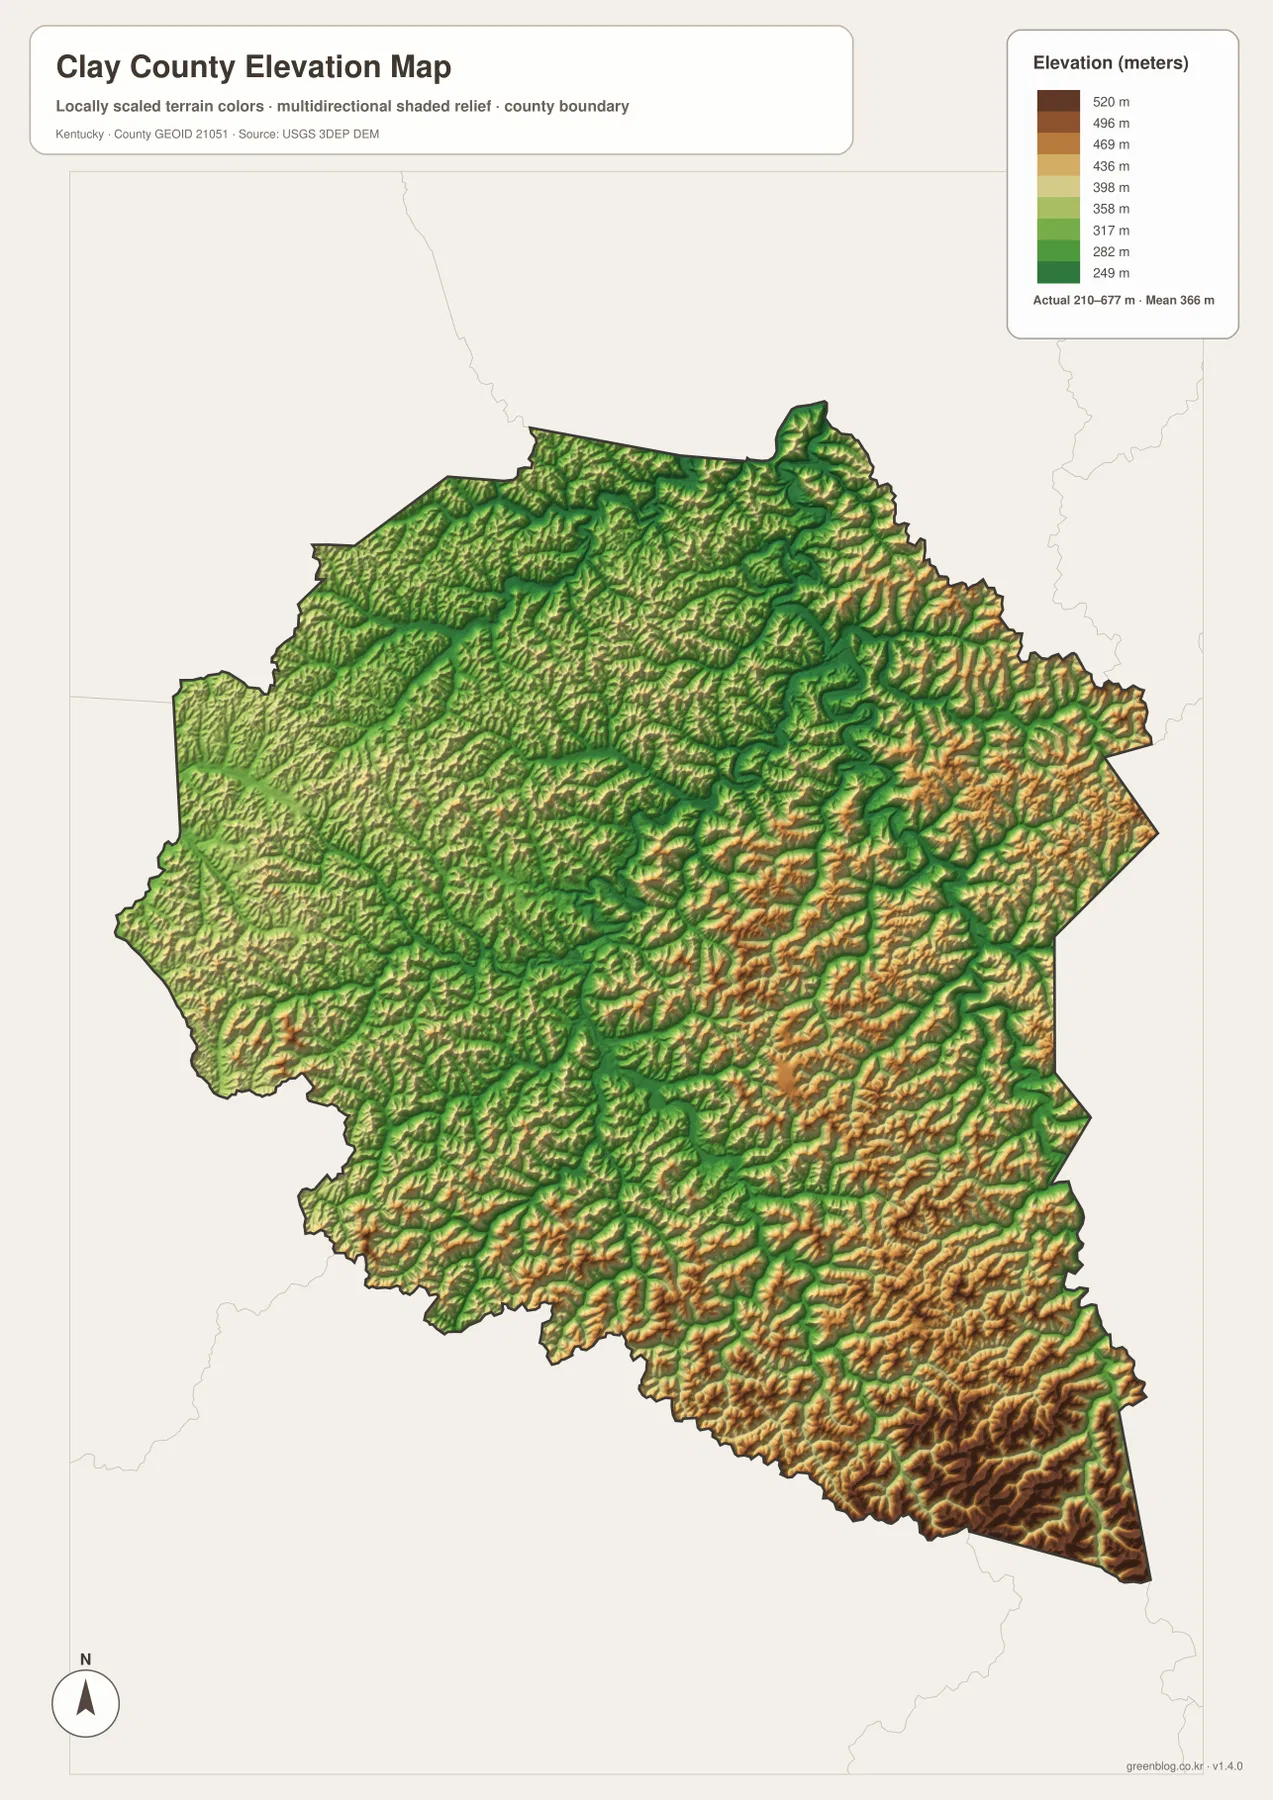
The contrast between ridges and valleys helps explain the road pattern seen on the general map. Goose Creek, Horse Creek, and the South Fork Kentucky River occupy lower corridors, while higher ground separates one valley from the next. A nearby destination on the opposite side of a ridge may therefore require a longer drive through a valley connection instead of a direct route.
Elevation colors are useful for regional comparison, not for determining the precise height of a house, parcel, trail point, or construction site. The 210–677 meter range and 366 meter mean summarize the map at county scale. Projects that depend on exact elevation or slope should use detailed USGS elevation data or professional survey information.
Choosing the most useful Clay County map for the task
The general county map is the strongest choice for locating Manchester, Oneida, the county boundary, and the main numbered routes in one view. It is useful when the question is where a place sits relative to the larger roads or how a route approaches the edge of the county. The city map is cleaner when the only goal is to show Manchester’s location and the surrounding county context without extra road labels.
For rivers, creeks, and valley relationships, the terrain-and-water map is more informative. It labels South Fork Kentucky River, Sexton Creek, Laurel Creek, Little Goose Creek, Goose Creek, Combs Lake, and other waterways while retaining shaded relief. The elevation map is better when the main topic is the large height difference between lower stream valleys and the high eastern and southeastern ridges.
The high-resolution JPG files in the ZIP are preferable for printing or zooming into labels. Each map separates a different type of information instead of crowding everything into a single graphic, so users can choose the layer that matches the question they are trying to answer. For legal boundaries, emergency planning, road status, property research, or engineering decisions, these reference maps should be supplemented with current official data.
Frequently Asked Questions
Which map is best for finding Manchester and the main roads?
The general county map is the best starting point because it shows Manchester together with routes 421, 11, 80, 149, 687, and other major connections. It also includes Oneida and the county boundary. If you only need a clean locator for Manchester, the city map removes much of the extra detail and makes the city’s county position easier to see.
How much elevation change does the Clay County map show?
The supplied elevation map shows an actual range of about 210 to 677 meters and a mean elevation near 366 meters. Lower elevations follow Manchester and many creek valleys, while the east and southeast contain the highest concentrations of ridges. The map is suitable for county-scale comparison, not precise site elevation or survey work.
What waterways are labeled besides South Fork Kentucky River?
The terrain-and-water map labels Little Sexton Creek, Sexton Creek, Laurel Creek, Beech Creek, Bear Creek, Little Goose Creek, Horse Creek, Goose Creek, Spring Creek, and several other branches. Combs Lake is also labeled near the center of the county, providing another useful landmark for comparing water and terrain.
Map File Information
The original Clay County maps used on this page are packaged as high-resolution JPG files. Each image is 3638 × 2572 px, making the set better suited to printing and detailed viewing than the smaller WebP versions displayed in the article.
- Included Files: county map, city map, terrain and water map, elevation map
- File Type: JPG
Related Maps
Sources and references
Administrative boundaries can be checked with U.S. Census Bureau TIGER/Line Shapefiles. Hydrography information is available from USGS National Hydrography, and elevation data can be explored through the USGS 3D Elevation Program. These sources are appropriate for authoritative base data, while current road, safety, and local access conditions should always be confirmed with the relevant agency.
Green Map creates custom-edited map images using open geographic data sources such as geoBoundaries, Natural Earth, OpenStreetMap, and government open data. These maps are edited visual materials, not raw data files, and are provided for education, documents, presentations, and graphic reference.