Breathitt County sits in the rugged hills of eastern Kentucky, where narrow valleys, winding roads, and closely spaced streams shape the way the county looks on a map. The county government describes the area as part of the foothills of the Appalachian Mountains and the Eastern Coal Field, with Jackson serving as the county seat near the North Fork of the Kentucky River. The maps on this page use that setting as the starting point, showing how Jackson, the road network, the river forks, Panbowl Lake, and the surrounding ridges fit together.
Visitors who need the map files can download the original high-resolution JPG set from the file box below. The page includes a county reference map, a city-location map, a terrain-and-water map, and an elevation map, so the same county can be viewed from several practical angles without forcing all of the information into one crowded image. The water map is a geographic reference rather than a flood or navigation product, and the elevation surface is intended for regional comparison rather than survey or engineering work.
Table of Contents
Jackson anchors a winding road network inside an irregular county boundary
Breathitt County is bordered by Lee, Wolfe, Magoffin, Knott, Perry, and Owsley counties. The county government lists an area of about 494 square miles, but the outline does not resemble a simple rectangle. The western and southern sides contain long stretches of boundary, while the eastern side narrows into projecting sections and indented corners. On the reference map, that irregular shape immediately reflects the terrain of eastern Kentucky, where administrative lines and transportation routes cross a landscape cut by many valleys.
Jackson is the clearest transportation focus on the map. KY 15 passes through the central part of the county and continues south, while KY 30, KY 52, and KY 205 meet or approach the Jackson area from different directions. Other labeled routes include KY 542 in the east, KY 476 across the south-central area, KY 315 toward the southwest, and KY 28 near the southern edge. Instead of forming a straight grid, many roads bend with valleys and stream corridors, which is typical of a county where ridges limit the number of direct east-west or north-south paths.
Smaller labels such as Paxton north of Jackson, Evanston toward the east, and Dalesburg near the southwestern edge help turn the road network into a more readable local picture. These places are useful reference points when following a numbered highway across the county. A route that looks indirect on a statewide road map makes more sense when the streams and ridges are considered at the same time, because the easiest travel corridor often follows lower ground rather than a straight line between two points.
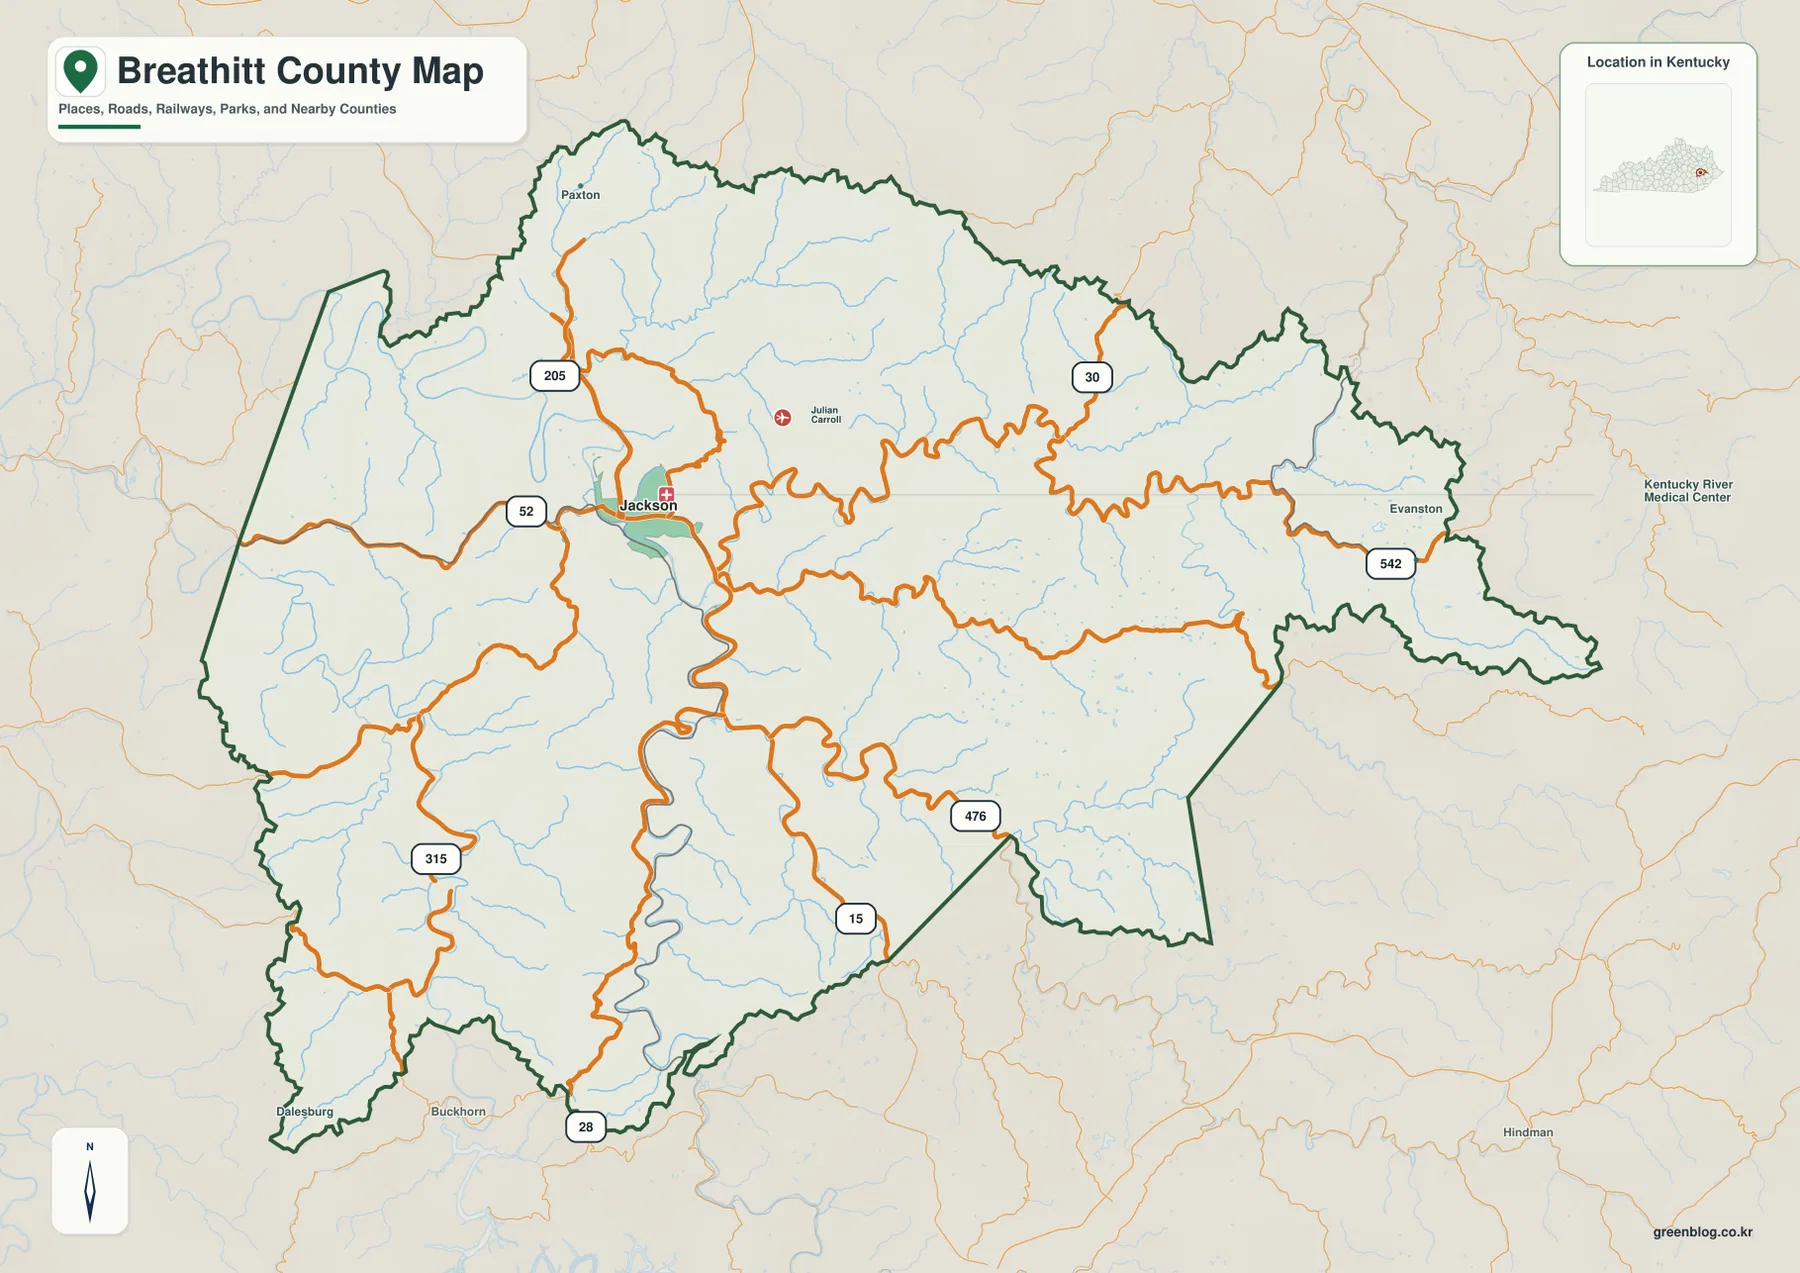
This map is the best starting point when the main question is where places and roads lie inside the county. It gives enough context to understand Jackson as the central reference without overwhelming the page with elevation shading. When a reader wants to know why roads curve or why a settlement sits in a particular valley, the water and elevation maps later on the page provide the next layer of explanation.
The city map makes Jackson the clearest orientation point
The city-location map deliberately simplifies the county and highlights Jackson as the principal ranked city in the supplied city index. Breathitt County contains many smaller communities and named places, but Jackson is the most useful single anchor for a countywide orientation map because it is the county seat and sits near the geographic center. Official county information also places Jackson on the North Fork of the Kentucky River, tying the administrative center directly to one of the county’s major valleys.
Names around the outside of the city map—Magoffin, Wolfe, Knott, Floyd, Perry, Owsley, and Lee counties—provide a broader eastern Kentucky frame. Jackson is not tucked against one extreme edge of Breathitt County; it lies well inside the county, where roads can branch toward neighboring areas in several directions. That central setting is easier to see on the simplified city map than on the more detailed reference map because the city marker is not competing with as many road labels.
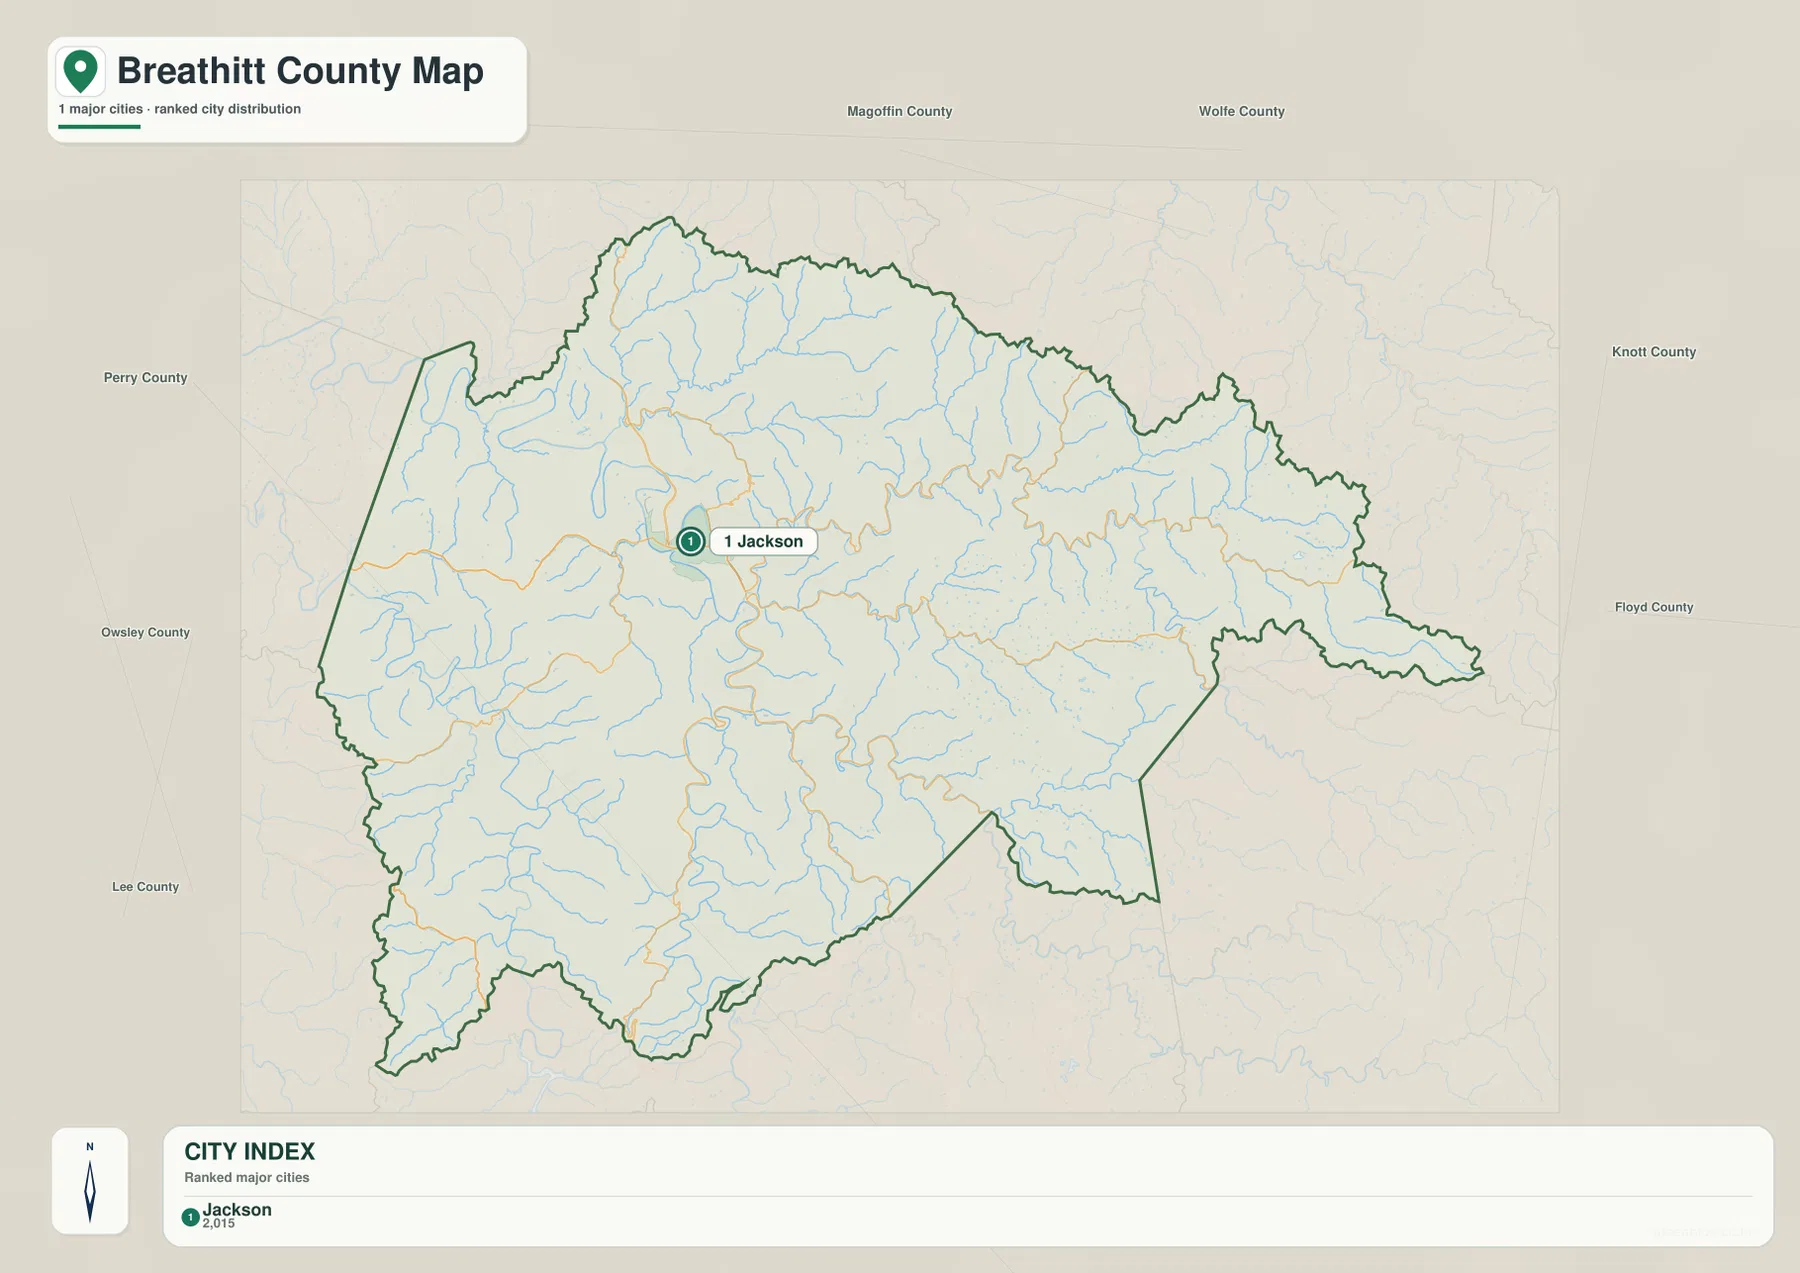
For a presentation, school project, or short regional profile, this version works well when the goal is simply to show where Jackson is. The detailed county map should be used when road numbers or smaller places matter. Keeping those two jobs separate makes both maps easier to read: one answers “Where is the main city?” while the other answers “How do the roads and local labels connect across the county?”
Kentucky River forks and small creeks explain the county’s valley pattern
Waterways are essential to understanding Breathitt County. The county’s official overview identifies the North Fork and Middle Fork of the Kentucky River along with Quicksand, Troublesome, Lost, and Frozen creeks as major waterways. The terrain-and-water map shows why those names matter. Rather than one broad river crossing an open plain, the county contains a dense network of streams threading between narrow ridges. Those stream corridors help explain the shape of roads and the location of settled areas.
The Middle Fork Kentucky River is labeled across the western and southwestern side, while the North Fork Kentucky River appears in the south. Frozen Creek runs through the northern interior; Big Caney Creek is marked farther east; South Fork Quicksand Creek crosses the east-central area; and Buckhorn Creek, Laurel Fork, and Lost Creek appear in the southern half. Boone Fork and Cope Fork are labeled in the north. The eastern extension of the county contains especially tight valleys, with streams pressed between long ridges.
Panbowl Lake near Jackson is another distinctive water feature. Kentucky Tourism notes that the lake formed in 1963 in connection with construction of KY 15 and is located in Jackson. On the map, it provides a recognizable reference near the county’s main city while also showing how water features and transportation corridors occupy the same limited valley space. The lake and stream lines should be treated as geographic references only; they do not show flood zones, property boundaries, or safe boating routes.
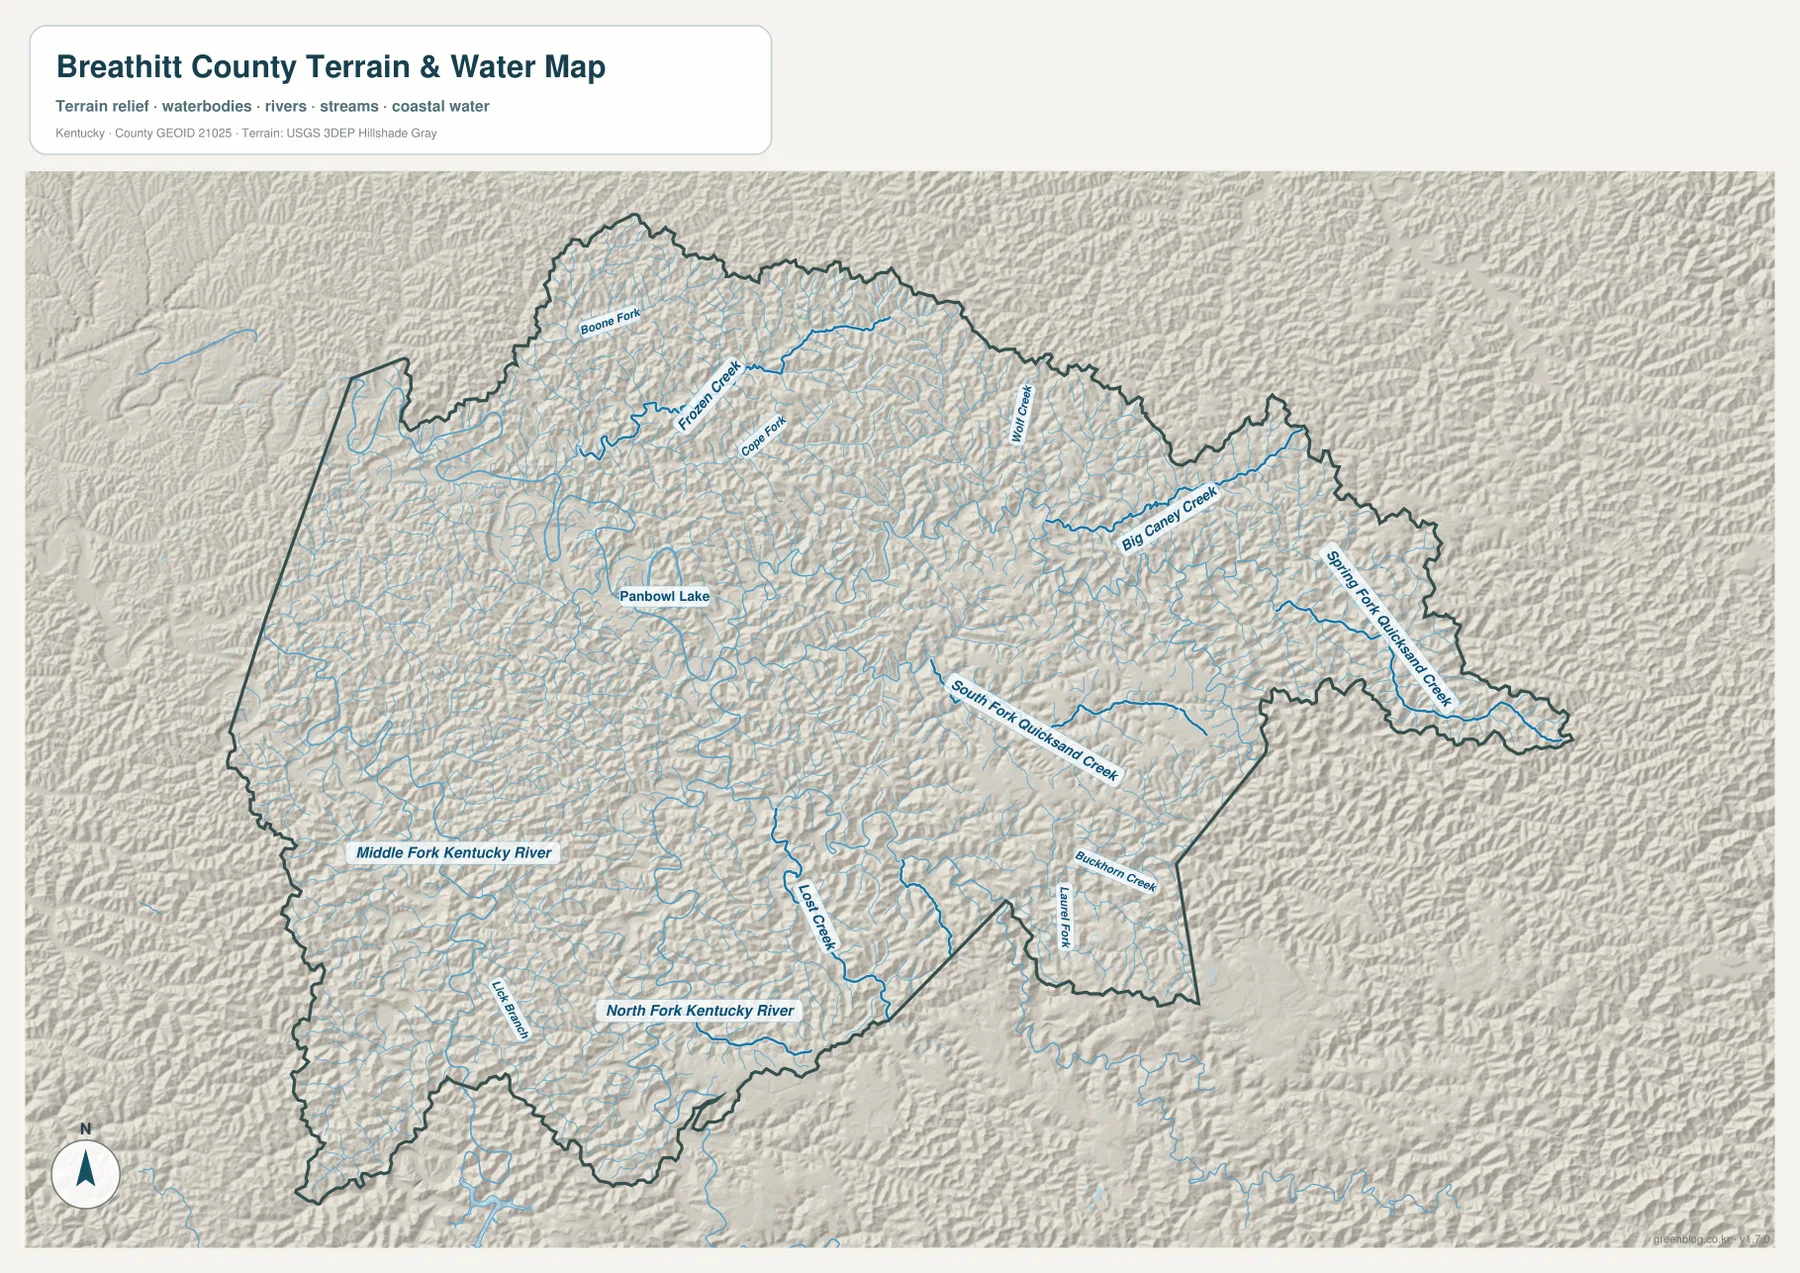
The shaded terrain behind the blue stream network makes the relationship especially clear. Creeks follow low corridors between ridges, and many road bends on the reference map correspond to the same valleys. Comparing the two maps side by side is more informative than looking at either one alone: the county map shows the route, while the terrain-and-water map explains the physical setting through which that route passes.
Elevation colors show narrow ridges rising above the stream valleys
The elevation map displays an actual mapped range of roughly 199 to 486 meters, with a mean near 325 meters. The important feature is not a single high point but the repeated contrast between low green valleys and higher yellow, tan, and brown ridges. Breathitt County is broken into many closely spaced slopes rather than one smooth plateau, so elevation changes can occur over short horizontal distances from a creek bottom to the ridge beside it.
Higher terrain is especially noticeable in parts of the eastern and southeastern county, although ridges occur throughout the map. Lower green corridors trace many of the same valleys seen on the water map. When Jackson and the road network are mentally placed back onto this surface, it becomes easier to understand why travel routes concentrate in valley bottoms and why direct-looking routes may turn repeatedly around higher ground.
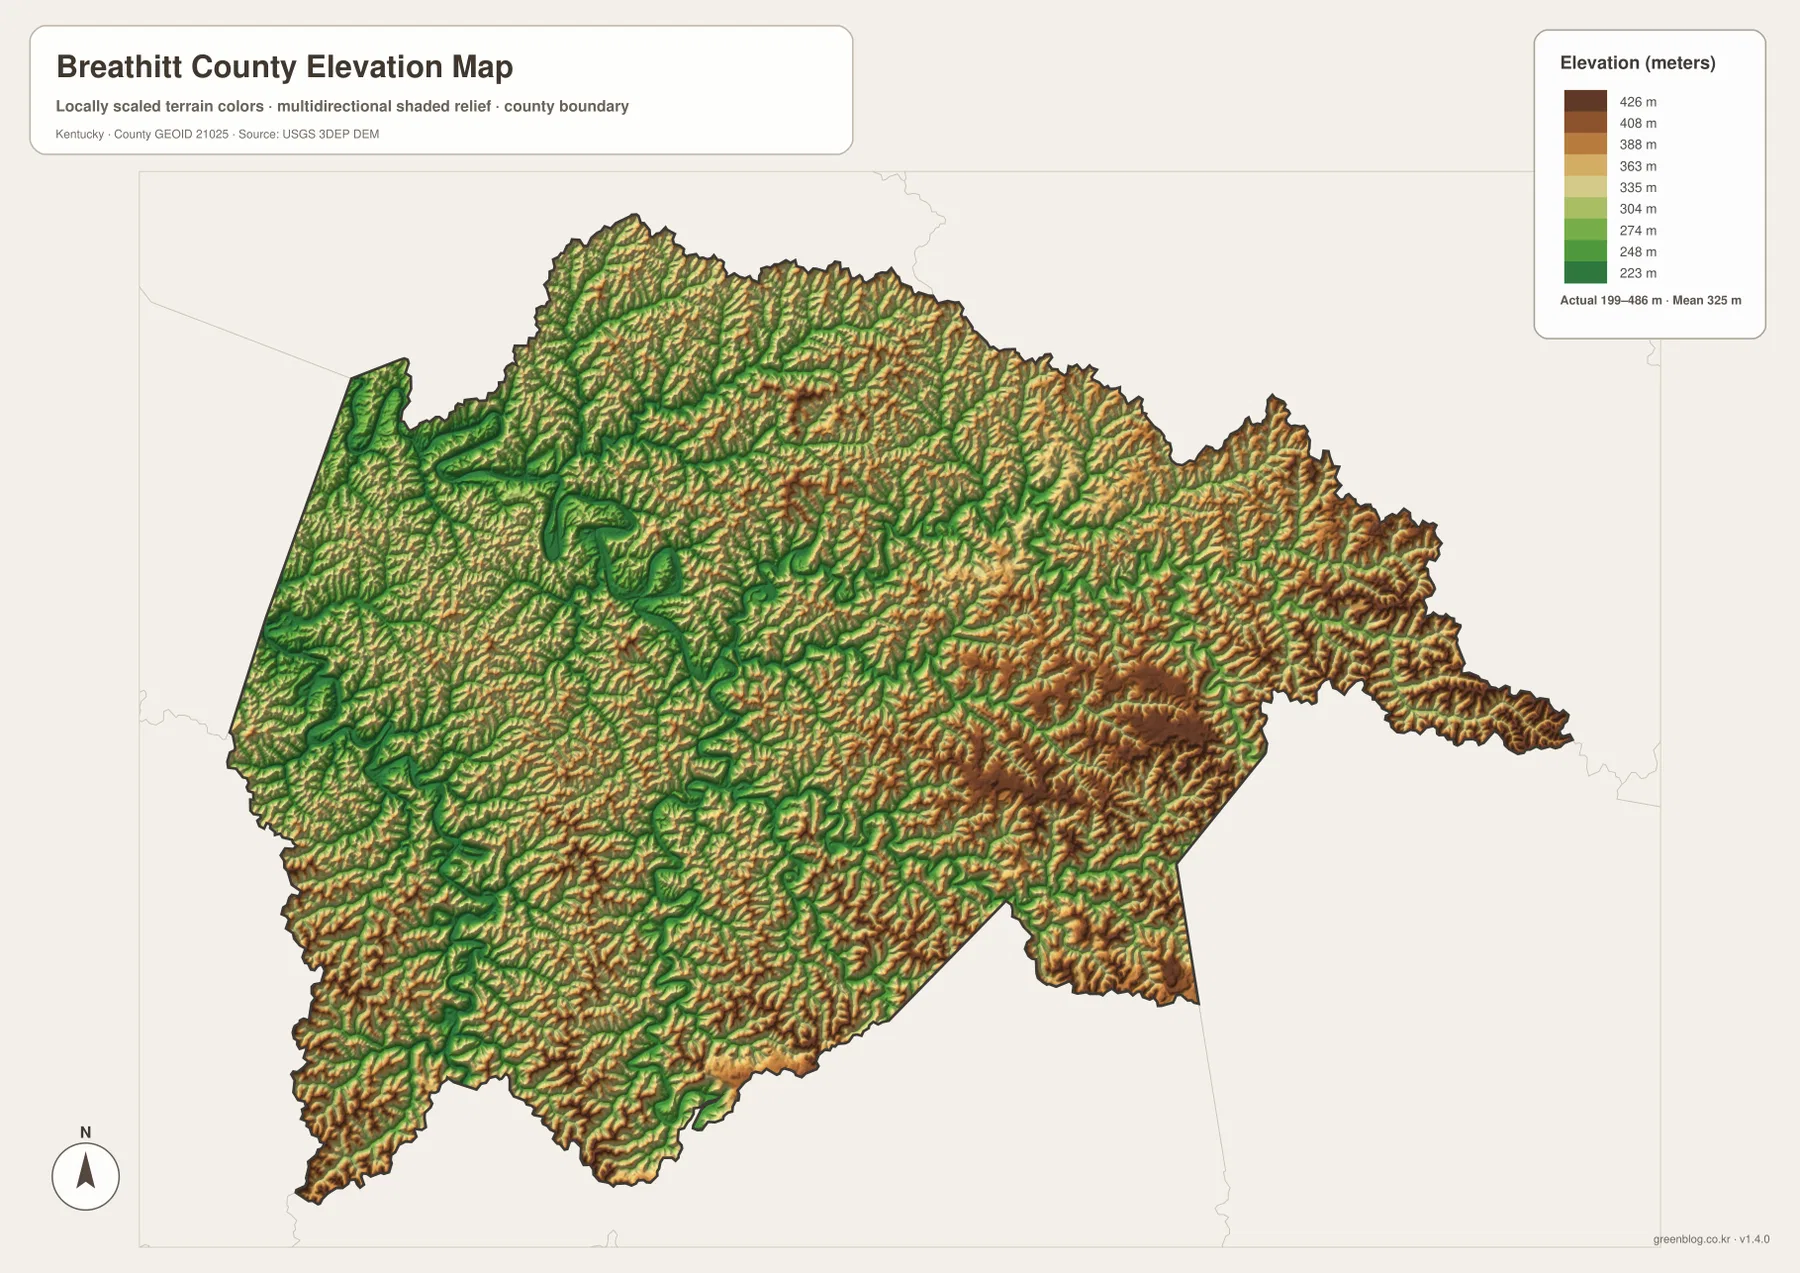
This surface is intentionally generalized for countywide viewing. It is useful for comparing broad elevation differences, identifying valley corridors, and explaining why the terrain feels rugged, but it should not be treated as a survey-grade measurement for a building site, road design, slope stability study, or other engineering decision. For those purposes, readers should use official high-resolution elevation data and professional field measurements.
Choosing the right Breathitt County map for the question
A useful way to work through the set is to begin with the reference map and then move to the specialized view that matches the question. The county map establishes Jackson, highways, local place labels, and the boundary. The city map strips away much of that detail so Jackson stands out immediately. The terrain-and-water map is the strongest choice when the Kentucky River forks, Panbowl Lake, or named creeks are the subject, while the elevation map is best for comparing low valley floors with the ridges around them.
That division is helpful for printed materials as well. A travel-orientation sheet benefits from the road-rich county map; a classroom slide introducing the county seat can use the simpler city map; and a geography lesson can pair the water and elevation maps to show how streams occupy lower ground between ridges. Using one map for every purpose often makes the explanation harder, while choosing the map that emphasizes the needed feature keeps the page readable.
The maps also work best as overview references rather than substitutes for address-level navigation or legal records. They can summarize county shape, major road relationships, named waterways, and regional elevation, but current closures, parcel ownership, legal boundaries, and site-specific measurements should be checked in the appropriate official systems. Keeping those limits in mind preserves the value of the maps without asking them to answer questions they were not designed to answer.
Frequently Asked Questions
Which map is best for finding Jackson and the main highways?
Use the county reference map when you need Jackson together with routes such as KY 15, KY 30, KY 52, and KY 205. It also keeps the county boundary and smaller place labels in view, which makes it easier to explain how a road leaves Jackson and continues toward another part of the county. The city map is better when the only goal is to show Jackson clearly without the extra road detail.
Where can I see Panbowl Lake and the Kentucky River forks most clearly?
The terrain-and-water map is the most useful choice for Panbowl Lake, the North and Middle Forks of the Kentucky River, Frozen Creek, Big Caney Creek, South Fork Quicksand Creek, and other named tributaries. Because the streams are drawn over shaded terrain, the map also helps show that many waterways occupy narrow valleys. It is not a flood-risk, parcel, or navigation map.
Can the elevation map be used for surveying or construction measurements?
No. The map is a countywide reference surface showing an approximate mapped range of 199 to 486 meters and a mean near 325 meters. It is appropriate for comparing lower valleys and higher ridges, but survey, construction, engineering, or site-design work requires authoritative high-resolution elevation data and, where needed, professional field measurements.
Map File Information
The original Breathitt County maps used on this page are packaged as high-resolution JPG files. They are larger than the web previews and are suitable for printing, documents, and offline reference.
- Included Files: county reference map, city-location map, terrain-and-water map, elevation map
- File Type: JPG
Related Maps
Sources and references
County location, history, the county seat, and major waterways are described by the official Breathitt County website. Boundary background data can be reviewed through the U.S. Census Bureau TIGER/Line program, water data through USGS National Hydrography, and elevation data through the USGS 3D Elevation Program. Additional local context for the lake is available from Kentucky Tourism’s Panbowl Lake page.
Green Map creates custom-edited map images using open geographic data sources such as geoBoundaries, Natural Earth, OpenStreetMap, and government open data. These maps are edited visual materials, not raw data files, and are provided for education, documents, presentations, and graphic reference.