A barrel of petroleum liquid does not carry exactly the same amount of energy everywhere it is used. The U.S. Energy Information Administration (EIA) reports an annual average heat-content value for petroleum liquids consumed by the electric power sector in each state. In 2024, the 50 state values ranged from 5.0947 to 6.1403 million Btu per barrel. This measure describes the energy contained in the fuel consumed. It is not a measure of electricity generation, fuel volume, power-plant efficiency, or the share of a state’s electricity produced from petroleum.
Across the 50 states, the unweighted mean was 5.8052 MMBtu per barrel and the median was 5.8108. Those two summary values are almost identical, which fits the tight clustering visible in the data. 39 states were between 5.70 and 5.90 MMBtu per barrel. The main exceptions are a small group above 6.0 and Alaska, whose value sits well below the rest of the distribution.
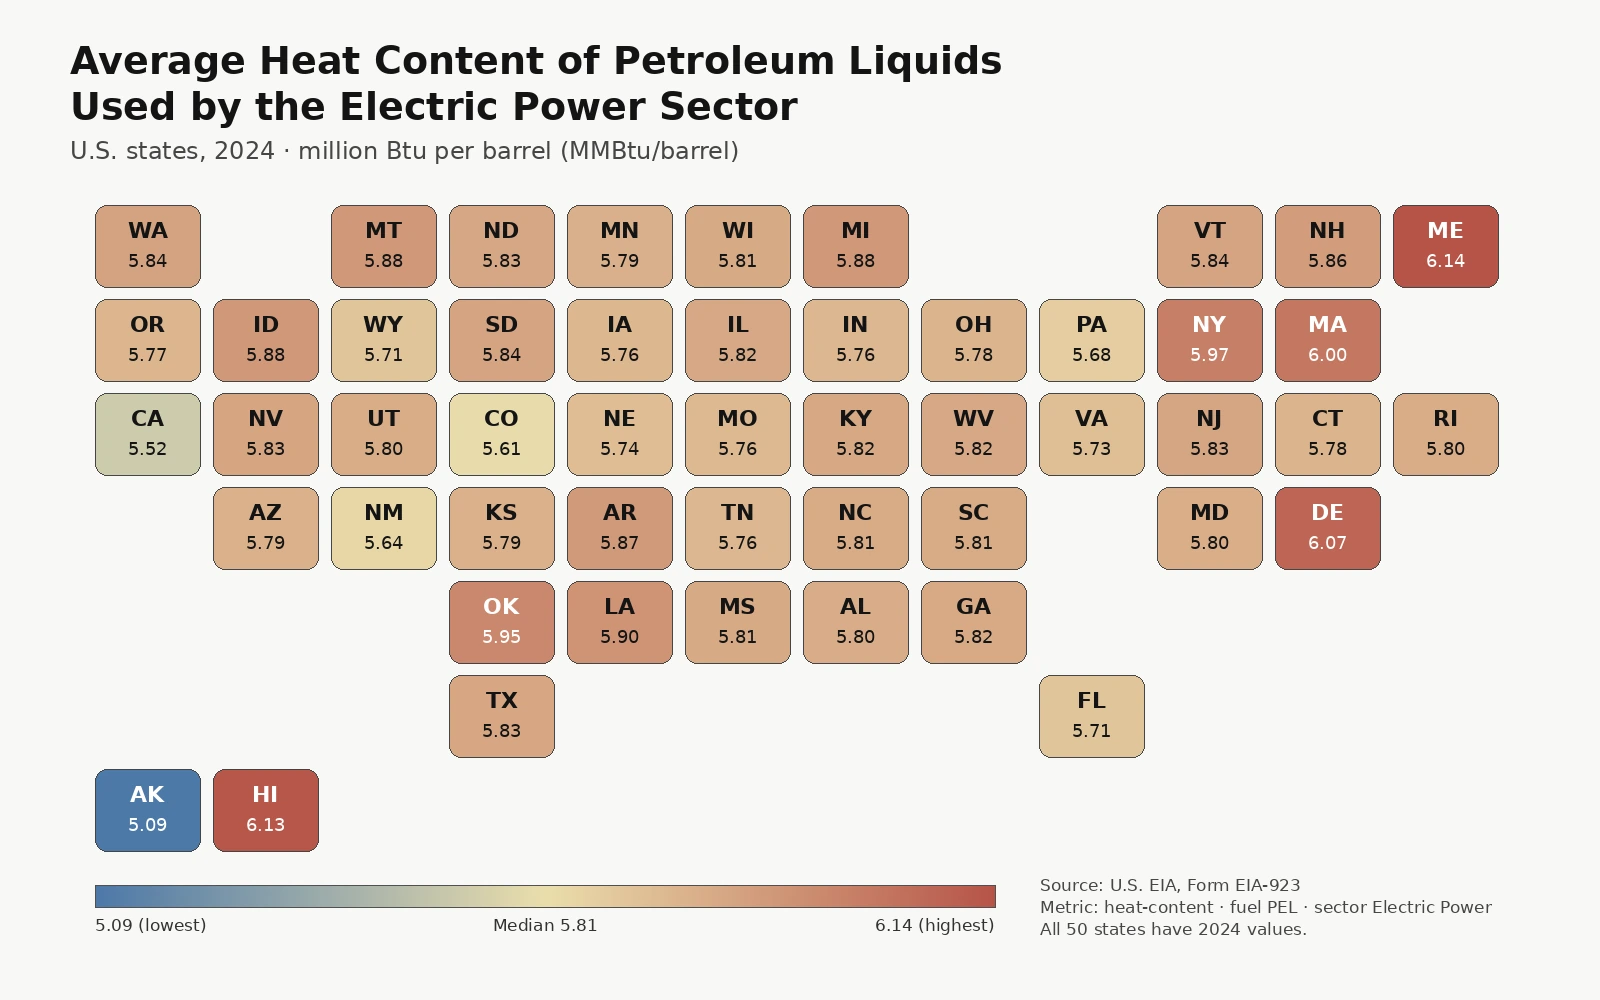
Table of Contents
Maine and Hawaii were above 6.1 MMBtu per barrel
Maine had the highest 2024 value at 6.1403 MMBtu per barrel, followed very closely by Hawaii at 6.1325. Delaware was third at 6.0726 and Massachusetts fourth at 6.0031. Those were the only four states above 6.0. New York, Oklahoma and Louisiana followed at lower but still above-median values. The upper end therefore contains a few clearly separated observations rather than a broad group of states all above 6.0.
| State | Average heat content (MMBtu/barrel) |
|---|---|
| Maine | 6.1403 |
| Hawaii | 6.1325 |
| Delaware | 6.0726 |
| Massachusetts | 6.0031 |
| New York | 5.9744 |
| Oklahoma | 5.9453 |
| Louisiana | 5.9000 |
| Michigan | 5.8809 |
The full high-to-low range was 1.0456 MMBtu per barrel. Maine’s value was about 20.5% higher than Alaska’s when Alaska is used as the base. That percentage should not be interpreted as an efficiency advantage. It simply compares the average amount of chemical energy represented by a physical barrel of the petroleum liquids consumed in each state’s electric power sector.
Most states were packed into a narrow middle band
The first quartile was 5.7650 and the third quartile was 5.8404 MMBtu per barrel. In other words, the middle half of the states occupied a band only about 0.0754 MMBtu wide. The standard deviation was 0.1516, and the coefficient of variation was only 2.6%. These statistics reinforce an important visual caution: noticeable color differences on a state map can represent numerically small differences because the overall distribution is compressed.
The dataset by itself does not explain why one state has a slightly higher or lower average. EIA’s petroleum-liquids category aggregates fuel consumed by power-sector facilities, and a state average can move when the mix of liquid fuels, the plants operating during the year, or the relative amount consumed by those plants changes. The state-level average does not identify the causal contribution of each fuel or facility. A causal explanation would require more detailed EIA-923 fuel and plant records.
Alaska was the clear low-end outlier in 2024
| State | Average heat content (MMBtu/barrel) |
|---|---|
| Alaska | 5.0947 |
| California | 5.5207 |
| Colorado | 5.6056 |
| New Mexico | 5.6442 |
| Pennsylvania | 5.6757 |
| Wyoming | 5.7092 |
| Florida | 5.7096 |
| Virginia | 5.7332 |
Alaska’s 5.0947 MMBtu per barrel was the lowest reported state value and was separated from California, the second-lowest at 5.5207, by about 0.426 MMBtu per barrel. Colorado, New Mexico and Pennsylvania were next on the low side. The gap makes Alaska visually prominent, but the annual state average alone does not tell us whether the difference came from a distinctive fuel mix, facility mix, operational pattern, or another reporting characteristic.
A low heat-content value also does not mean a state consumed little petroleum. Consumption volume and heat content answer different questions. A state can burn a large number of barrels with a lower average energy content and still have a large total energy input. Another state can burn relatively few barrels of a higher-energy liquid and have a small total input. Total energy use depends on both the physical quantity consumed and the energy content per unit.
Heat content is not the same as heat rate
Heat content describes the fuel. Heat rate describes the amount of energy input required to generate a unit of electricity, usually expressed in Btu per kilowatthour. A higher heat-content barrel gives more energy per barrel, but that does not establish how efficiently a generator converts the energy into electricity. Plant technology, operating conditions, combined-heat-and-power configurations and other factors affect conversion efficiency.
This distinction matters because EIA publishes both kinds of statistics. Its Electric Power Annual reports operating heat rates for selected energy sources in Btu per kilowatthour, while petroleum heat-content factors are expressed on a fuel-unit basis such as million Btu per barrel. Treating the state values in this article as heat rates would mix two different denominators and produce a false efficiency comparison.
Why the measure matters when converting barrels into energy
Average heat content is especially useful when analysts need to convert physical fuel consumption into a common energy unit. If a state consumed a known number of barrels, multiplying that volume by the applicable MMBtu-per-barrel factor gives an energy-input estimate, provided the units and aggregation rules are aligned. This makes it possible to compare liquid-fuel energy with energy from coal or gas after each fuel is converted to Btu-based units.
The reverse caution is equally important. If an EIA table already reports petroleum consumption in Btu, applying the heat-content factor again would double-convert the data. Likewise, a series reported in thousand barrels needs the physical-unit scale accounted for before multiplication. Energy datasets often look straightforward because the numbers are small, but the unit label, sector definition and fuel category determine what calculation is valid.
How to read the 50-state tile map
- Color: shows the 2024 average heat content from lower to higher values; it does not encode fuel consumption or electricity generation.
- Number: each tile shows million Btu per barrel. A value of 5.80 means about 5.80 million Btu of energy per barrel.
- Coverage: the dataset contains all 50 states. Washington, D.C. is not part of this 50-state extract.
- Time: every observation is for 2024, so the map does not mix different reporting years.
The tile map intentionally gives every state the same area. It is therefore not a geographic-area map: Alaska and Texas are not drawn larger than Rhode Island or Delaware. That design makes it easier to compare fifty labeled state values without allowing state size to dominate the visual. The map should be read as a compact state index with approximate geographic arrangement.
Source, unit and calculation notes
The source is the U.S. Energy Information Administration Electric Power Operational Data API, filtered to 2024, petroleum liquids (PEL), the Electric Power sector and the heat-content field. EIA’s Electric Power Annual technical notes describe petroleum fuel heat-content units as million Btu per barrel. That unit is consistent with values around 5 to 6; a value such as 5.8 should not be read as only 5.8 Btu per barrel.
The mean, median, quartiles, rankings and state counts in this article were calculated directly from the 50 state observations. No missing values were filled or imputed. Because the dataset is a one-year cross-section, it shows the 2024 pattern but does not establish a trend. A time-series analysis would need the same heat-content field, fuel category and sector definition for multiple years.
One year should not be treated as a permanent state characteristic
A state’s annual average can change when the mix of petroleum liquids consumed changes or when different power plants operate at different rates. Consequently, a state that ranks high in 2024 may not occupy the same position in another year. The map is best interpreted as a snapshot of the average energy content of petroleum liquids actually consumed by the electric power sector during 2024.
To test whether a difference is persistent, the next step would be to retrieve the same EIA series over a longer period and calculate each state’s year-to-year range and average. Plant-level EIA-923 records could then help explain whether changes are associated with fuel categories or facility operations. That additional work is necessary before describing the 2024 pattern as a structural feature of a state’s power system.
What this metric can and cannot answer
The metric can answer a precise question: how much energy, on average, was contained in a barrel of the petroleum liquids consumed by the electric power sector in each state in 2024? It cannot by itself answer how much petroleum was consumed, how much electricity was produced, what share of generation used petroleum, how much fuel cost, or how efficiently plants converted fuel into electricity. Those require different EIA measures.
Keeping those questions separate makes the map more useful rather than less useful. A tight range around 5.8 MMBtu per barrel indicates that the physical energy density of consumed petroleum liquids was broadly similar across most states, while a few states stood out. That is a meaningful fuel-property comparison even though it does not rank the scale or performance of each state’s power sector.
Frequently Asked Questions
Which state had the highest average heat content for petroleum liquids in 2024?
Maine was highest at 6.1403 MMBtu per barrel, followed by Hawaii at 6.1325, Delaware at 6.0726 and Massachusetts at 6.0031.
Which state had the lowest value?
Alaska was lowest at 5.0947 MMBtu per barrel. California was second-lowest at 5.5207.
Does a higher heat-content value mean higher power-plant efficiency?
No. Heat content describes energy per barrel of fuel. Conversion efficiency requires a different measure, such as heat rate in Btu per kilowatthour.
What does a value such as 5.8 mean?
For petroleum liquids, the relevant unit is million Btu per barrel. A value of 5.8 means roughly 5.8 million Btu of energy per barrel.
Related Articles
Green Map creates custom-edited map images using open geographic data sources such as geoBoundaries, Natural Earth, OpenStreetMap, and government open data.
These maps are edited visual materials, not raw data files, and are provided for education, documents, presentations, and graphic reference.