“Using AI” is not a single business activity. An enterprise may classify customer messages, inspect images, recognise speech, automate workflows, analyse data or generate new text. This article isolates one specific Eurostat measure: the share of enterprises using AI technologies to analyse written language, often described as text mining. The 2025 extract contains 32 European countries. Each value is a percentage of enterprises in the survey population that reported using this particular type of AI technology.
The country values range from 2.10% to 29.10%. Denmark is highest at 29.10%, while Poland is lowest at 2.10%. The 32-country median is 10.30% and the unweighted mean is 12.48%. Because several countries are above 20%, the mean sits above the median. That gap matters: the leading countries should not be treated as representative of the entire 32-country distribution.
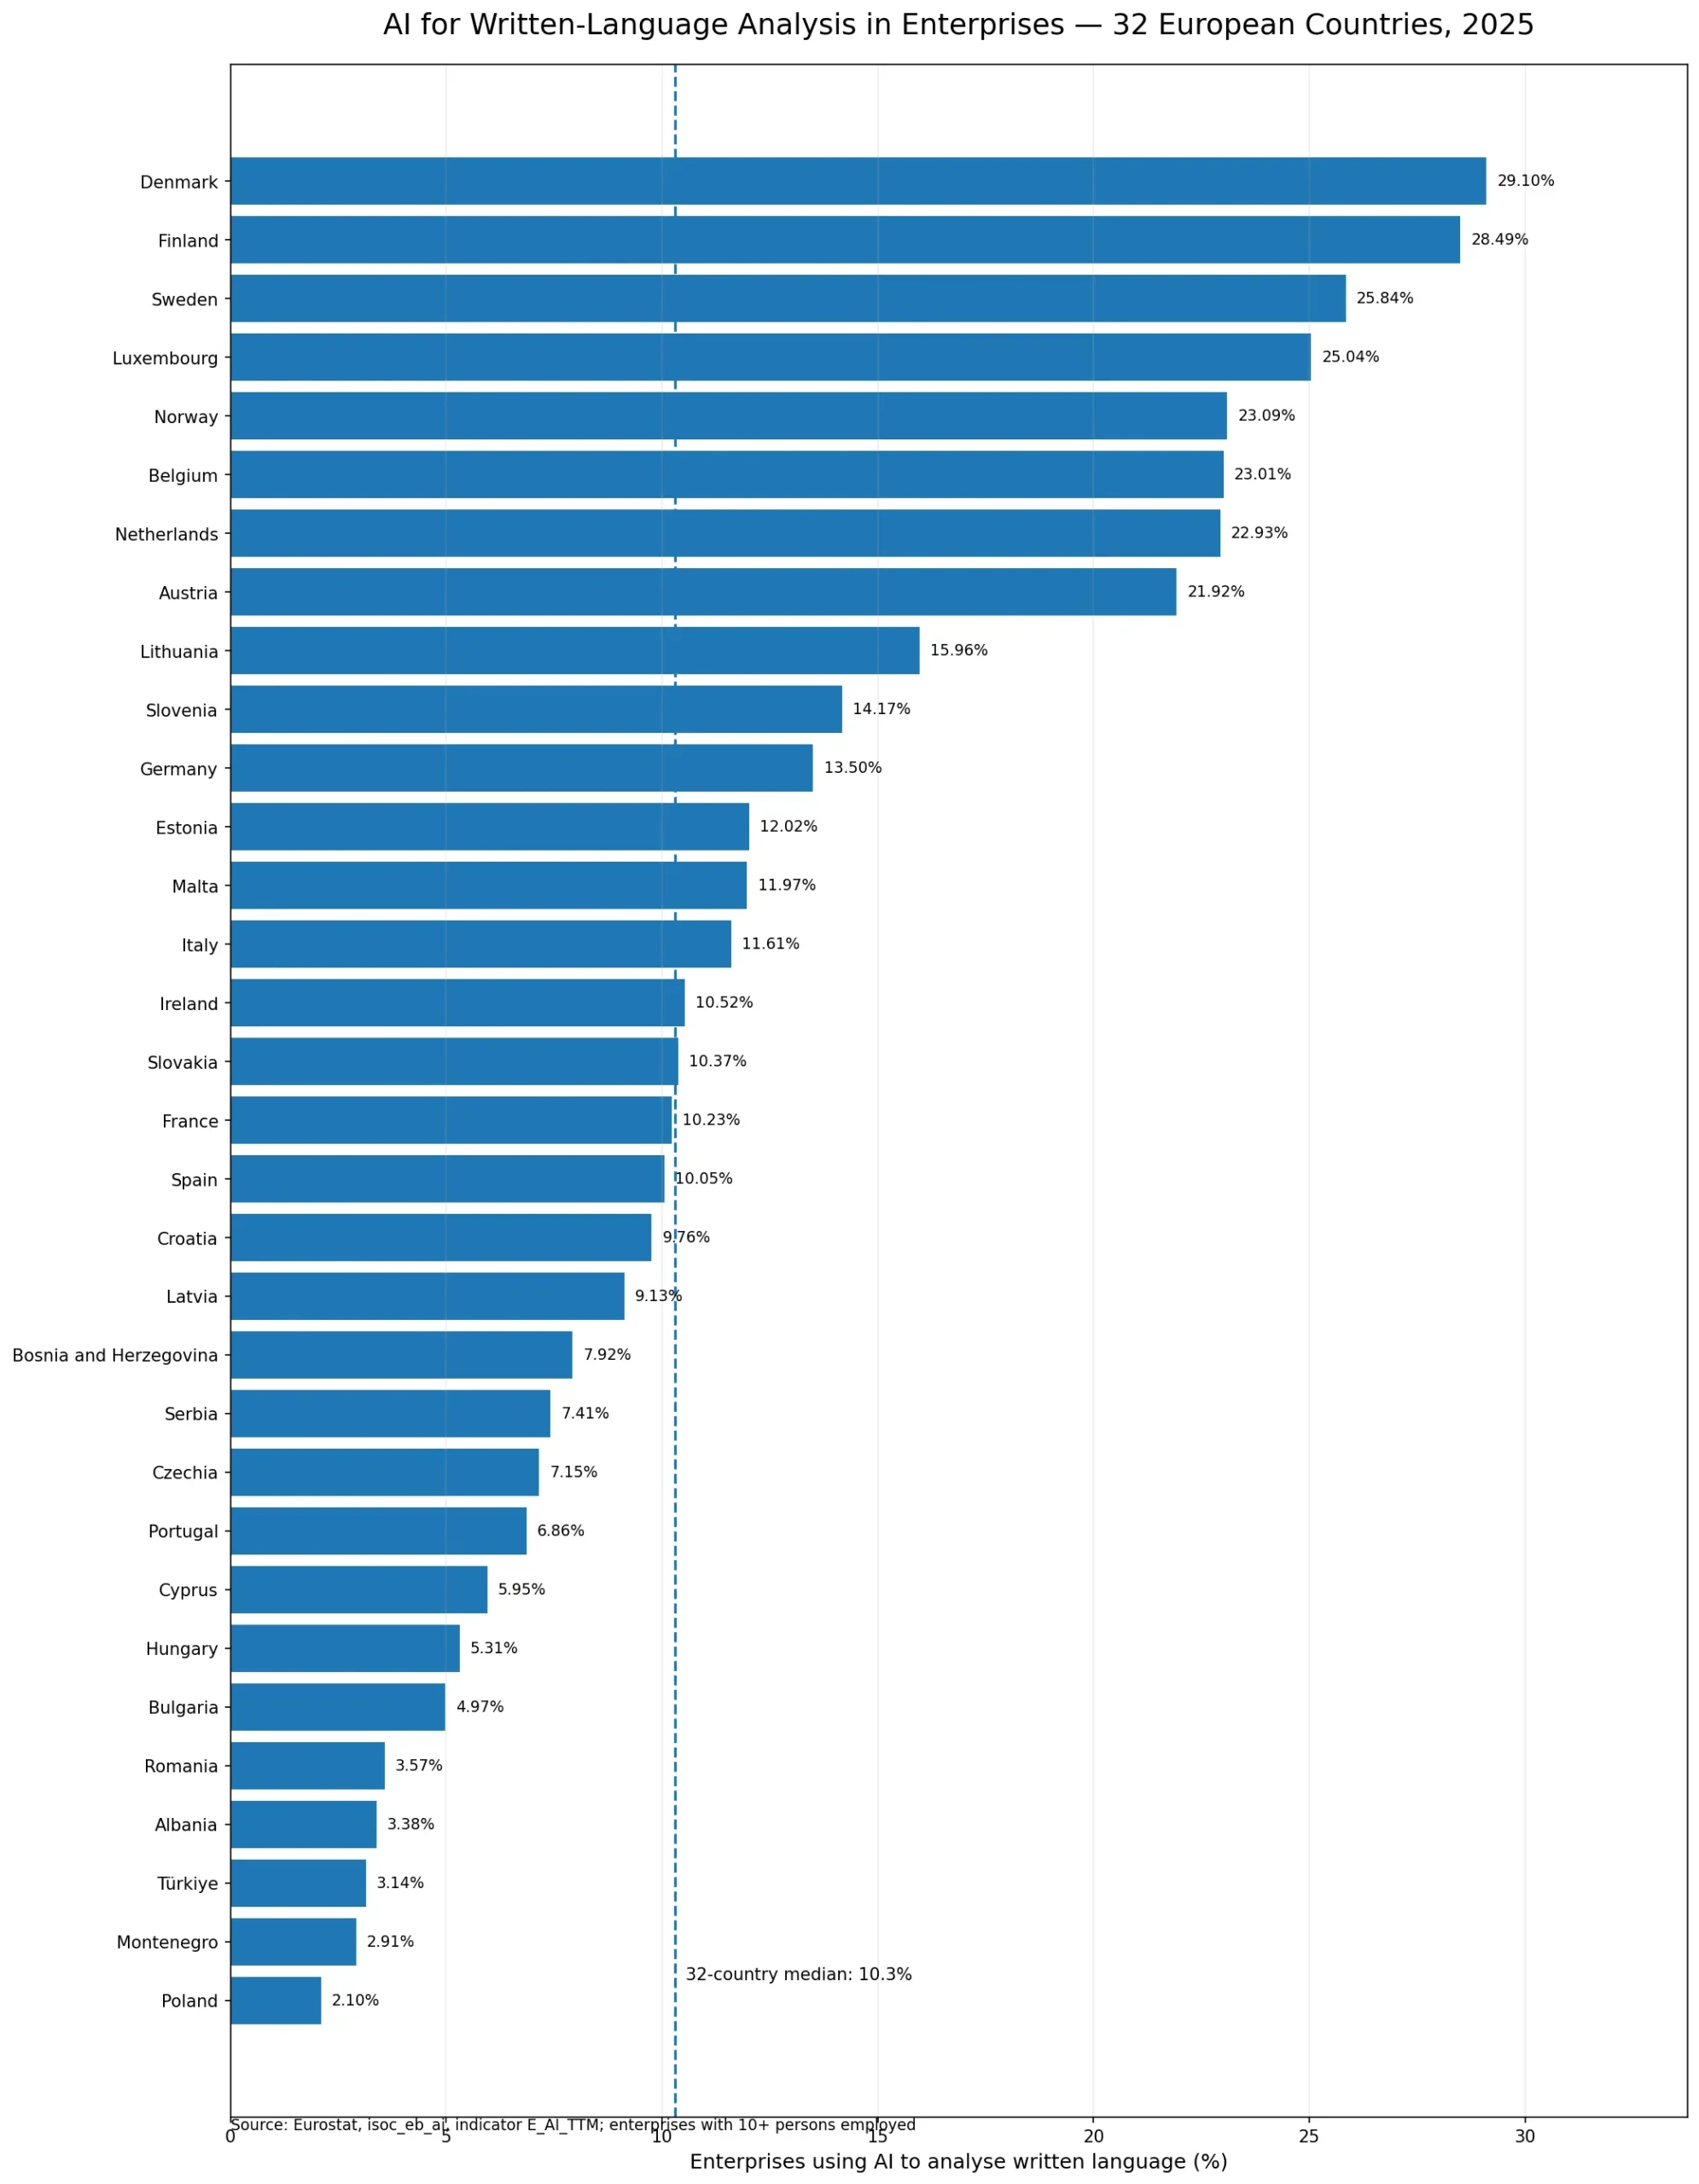
Table of Contents
Denmark and Finland were close to 30% in 2025
The upper end of the distribution is dominated by northern and western European countries. Denmark reports 29.10%, Finland 28.49%, Sweden 25.84% and Luxembourg 25.04%. Norway is at 23.09%, Belgium at 23.01%, the Netherlands at 22.93% and Austria at 21.92%. Eight of the 32 countries are at or above 20%. At the other end, Poland is at 2.10%, Montenegro 2.91%, Türkiye 3.14%, Albania 3.38% and Romania 3.57%.
| Country | Enterprises using AI for written-language analysis |
|---|---|
| Denmark | 29.10% |
| Finland | 28.49% |
| Sweden | 25.84% |
| Luxembourg | 25.04% |
| Norway | 23.09% |
| Belgium | 23.01% |
| Netherlands | 22.93% |
| Austria | 21.92% |
These percentages are not the same as the share of enterprises using any AI technology. A business can use several AI technologies at once, and a business that does not use text mining may still use image recognition, speech recognition, machine learning, workflow automation or generative technologies. Conversely, reporting written-language analysis does not prove that the enterprise uses generative AI. The measure is one functional slice of enterprise AI adoption.
The 10.3% median shows how uneven adoption is
The median across the 32 reported countries is 10.30%. The lower quartile is about 6.63% and the upper quartile begins around 17.45%. This means the central half of the observations lies roughly between those two values, while a smaller group of leaders extends well above 20%. In a distribution like this, the unweighted mean of 12.48% is useful but incomplete. The median and quartiles give a better sense of what a typical reported country looks like.
France at 10.23%, Slovakia at 10.37% and Ireland at 10.52% sit close to the median. Spain at 10.05%, Croatia at 9.76% and Latvia at 9.13% are also nearby. Small percentage-point differences can therefore change the ranking around the middle without representing a large practical gap. Reading the actual percentages is more informative than focusing on one or two positions in the table.
Low values do not mean that enterprises are barely using AI overall
| Country | Enterprises using AI for written-language analysis |
|---|---|
| Poland | 2.10% |
| Montenegro | 2.91% |
| Türkiye | 3.14% |
| Albania | 3.38% |
| Romania | 3.57% |
| Bulgaria | 4.97% |
| Hungary | 5.31% |
| Cyprus | 5.95% |
A low value means that this specific AI function was less commonly reported in the survey population. It is not a score for the country’s overall level of digitalisation. Enterprises may prioritise other AI functions, and sector structure, firm size, language conditions and software adoption patterns can all differ. The country values alone do not establish why one country is high and another is low.
The percentages also do not represent the number of enterprises. Ten percent in a large economy can correspond to more businesses than twenty percent in a small economy. This indicator answers a proportional question: among enterprises covered by the survey, what share reported using AI to analyse written language? Enterprise counts, investment, productivity effects and AI-related revenue would require different datasets.
The survey population and technology definition matter
Eurostat’s enterprise ICT statistics generally cover enterprises with at least 10 persons employed in the specified business activities. For the 2025 AI indicator, the activity scope follows the relevant NACE coverage used in the dataset. The percentages therefore should not be read as the share of every registered business, because micro-enterprises below the employment threshold and activities outside the survey scope are not represented in the same way.
The technology itself is written-language analysis. In practical terms, this refers to text-mining tasks that analyse documents or other written material to identify patterns, topics, keywords, classifications or relationships. It is closer to “reading and analysing text” than to creating new prose. Eurostat reported that, for the EU aggregate in 2025, written-language analysis was used by 11.75% of enterprises and was the most commonly reported AI technology in its technology breakdown.
Written-language analysis is not the same statistic as generative AI use
Current AI products often combine many capabilities, so a single software service can both analyse and generate text. Statistical classification still separates the functions. Eurostat lists written-language analysis and the generation of written or spoken language as distinct technology types. Calling the 29.10% Danish figure a “generative AI adoption rate” would therefore change the meaning of the indicator.
This distinction also matters for time-series work. AI products change rapidly, but an indicator remains comparable only when the underlying definition is held stable. If the goal is to track the spread of text mining, the same E_AI_TTM definition should be followed over time. If the goal is to study language generation, the corresponding generation category should be used instead. Combining the two merely because both involve text would obscure different adoption patterns.
Three checks make the 32-country comparison easier to read
- Coverage: the extract contains 32 European country rows for 2025; countries outside the extract are not treated as zero.
- Denominator: values are percentages of enterprises with 10 or more persons employed in the Eurostat survey scope, not percentages of all registered businesses.
- Meaning: the indicator measures use of AI for written-language analysis, not overall AI maturity, productivity, investment or the adoption rate of generative AI.
A ranked chart is used as the main visual rather than a filled map. With a 32-country extract, a map could easily make countries outside the supplied rows look like measured zeroes or ordinary missing observations. The ranking keeps the visual faithful to the actual coverage and makes the wide gap between the leaders, the middle group and the lower values easier to see.
Source and calculation notes
The source is Eurostat dataset isoc_eb_ai, using the E_AI_TTM written-language-analysis indicator for 2025, enterprises with 10 or more persons employed, the specified activity coverage and percentage of enterprises (PC_ENT). Eurostat’s official 2025 enterprise AI release provides additional methodological context. The rankings, 32-country mean, median and quartiles in this article are calculated directly from the 32 reported country values. Countries not present in the supplied extract are not inserted as zeroes.
Frequently Asked Questions
Which country had the highest share of enterprises using AI for written-language analysis in 2025?
Denmark was highest among the 32 reported countries at 29.10%, followed by Finland at 28.49%, Sweden at 25.84% and Luxembourg at 25.04%.
Is this a generative AI adoption rate?
No. Eurostat’s E_AI_TTM indicator covers AI used to analyse written language, or text mining. Generating written or spoken language is a separate AI technology category.
Does the percentage cover every business?
No. The indicator is based on the Eurostat enterprise ICT survey population, generally enterprises with at least 10 persons employed in the specified activity scope.
What are the mean and median across the 32 reported countries?
The unweighted mean is 12.48% and the median is 10.30%. The higher mean reflects the cluster of countries with adoption above 20%.
Related Articles
Green Map creates custom-edited map images using open geographic data sources such as geoBoundaries, Natural Earth, OpenStreetMap, and government open data.
These maps are edited visual materials, not raw data files, and are provided for education, documents, presentations, and graphic reference.