External financing can support a health system through transfers that originate outside the country, but total dollar amounts are hard to compare across populations of very different sizes. World Bank indicator SH.XPD.EHEX.PC.CD expresses external health expenditure on a per-person basis in current US dollars. The underlying concept includes direct foreign transfers and foreign transfers distributed through government into the national health system.
The latest-available dataset contains 181 economies, but it is not a single-year panel. Of those observations, 170 are from 2023, Canada, Chile and Luxembourg are from 2024, and eight economies have latest values from 2008 through 2022. The map therefore shows latest available values, while same-year comparisons and summary statistics below focus on the 170 observations from 2023.
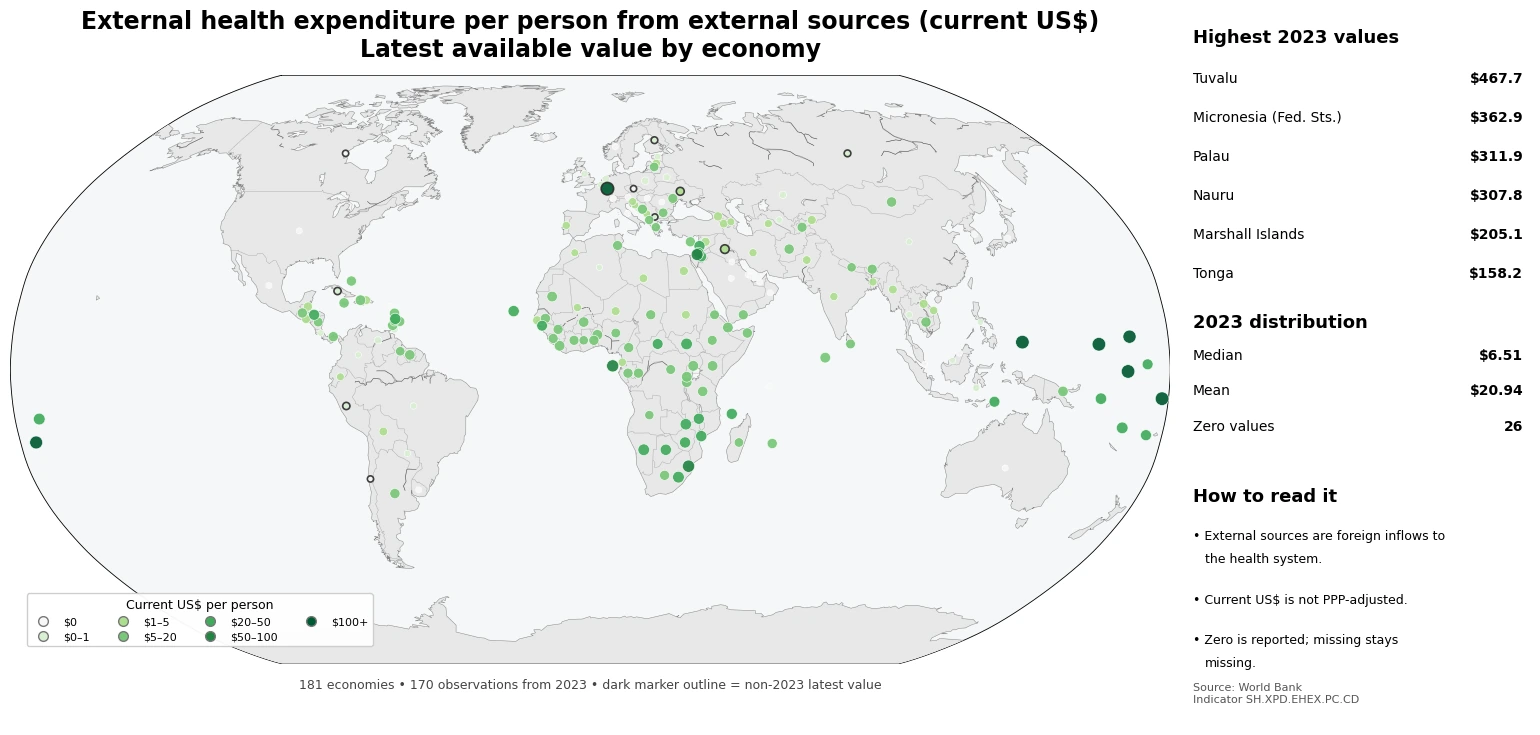
Table of Contents
What the indicator measures
The numerator is health expenditure financed from external sources and the denominator is population. A value of US$20 means that externally financed health expenditure was equivalent to 20 current US dollars per resident in that observation year. This is not the same as the share of total health spending financed externally. Two countries can both record US$20 per person while external funding accounts for very different shares of their overall health systems.
Current US dollars are not purchasing-power adjusted. They are useful when the question is about the nominal dollar amount of external financing relative to population, but they do not equalize the local price of health services. A PPP-adjusted measure answers a different question: how much purchasing power that spending represents locally. That distinction is why a current-dollar article and a PPP article can coexist without being the same metric.
The 2023 median was US$6.51 per person
Among the 170 economies with 2023 observations, the median was US$6.51 per person and the simple mean was US$20.94. The first quartile was US$0.77 and the third quartile was US$15.45. The mean is more than three times the median because a small set of very high per-capita values stretches the upper tail of the distribution. For a typical reporting economy, the median is therefore more informative than the mean.
| 2023 current US$ per person | Economies |
|---|---|
| $0 | 26 |
| $0–1 | 21 |
| $1–5 | 31 |
| $5–20 | 60 |
| $20–50 | 23 |
| $50–100 | 3 |
| $100+ | 6 |
The largest group is the US$5–20 range with 60 economies. Another 31 are between US$1 and US$5, while 21 are above zero but below US$1. 26 economies report an exact zero. Only 6 exceed US$100 per person, which shows how thin the extreme upper end is.
Small Pacific states dominate the very top of the 2023 distribution
Tuvalu has the highest 2023 value at US$467.66 per person. It is followed by the Federated States of Micronesia at US$362.90, Palau at US$311.86, Nauru at US$307.77, the Marshall Islands at US$205.10 and Tonga at US$158.17. The first six places are all relatively small Pacific island states.
| Economy | 2023 external health expenditure per person |
|---|---|
| Tuvalu | $467.66 |
| Micronesia (Fed. Sts.) | $362.90 |
| Palau | $311.86 |
| Nauru | $307.77 |
| Marshall Islands | $205.10 |
| Tonga | $158.17 |
| Eswatini | $84.19 |
| Sao Tome and Principe | $75.13 |
| Israel | $56.84 |
| Lesotho | $49.62 |
That pattern should not be translated directly into a ranking of total aid received. This is a per-capita measure: a given amount of external financing produces a larger per-person figure when the population denominator is small. The observed value still depends on both the amount of external financing and the population. Total external health financing and total health expenditure are needed for a fuller interpretation.
A reported zero is not the same as missing data
In the 2023 panel, 26 economies have a reported value of zero. Those observations are retained as zero on the map and in the distribution. Missing data are not imputed as zero. Confusing those two states would artificially increase the number of economies that appear to receive no external health financing.
The latest-available file also contains several older observations. Russia is represented by 2008, North Macedonia by 2018, Ukraine and Peru by 2019, Czechia, Finland and Cuba by 2020, and Iraq by 2022. These points are useful for showing where a latest value exists, but they are excluded from the 2023 ranking table because nominal current-dollar values from different years are not clean same-year comparisons.
Current US dollars and PPP answer different questions
Current-dollar values reflect nominal US-dollar amounts at the exchange rates embedded in the source series. They are suitable for describing the dollar scale of external financing per resident, but they do not adjust for differences in local health-care prices. PPP-adjusted figures are designed to make purchasing power more comparable across countries. Neither unit is universally better; the appropriate one depends on the question.
For that reason, a country can look relatively high in one measure and less exceptional in the other. Exchange rates and local price levels can alter the relationship between nominal dollars and purchasing power. The two units should not be mixed in a single ranking as though they were interchangeable.
High external spending per person is not a health-system score
A high value does not by itself show that access, outcomes or system performance are better. It records the amount of health expenditure financed from external sources per person. The reasons behind a high observation can include many factors that this dataset does not identify on its own, such as the scale and timing of externally funded programs or exceptional health needs.
Likewise, a low or zero value does not mean that total health spending is low. A health system may be financed mainly from domestic government revenue, social insurance, households or other domestic private sources. Total health expenditure per person and the external-financing share are useful companion indicators when the goal is to understand the whole financing structure.
Three rules for reading the map
- The map uses the latest available value for 181 economies, while same-year comparisons focus on the 170 observations from 2023.
- Current US dollars are not PPP-adjusted, so current-dollar and PPP figures should not be combined as if they used the same unit.
- A reported zero is a real observation, not missing data, and a high per-capita value is not equivalent to high total funding or better health outcomes.
Source: World Bank World Development Indicators, SH.XPD.EHEX.PC.CD. The source defines external financing as inflows into the national health system from outside the country, including direct foreign transfers and foreign transfers distributed through government. Missing observations are not interpolated or converted to zero.
Frequently Asked Questions
Does a high per-capita value mean a country depends heavily on external health funding?
Not necessarily. This indicator measures current US dollars per person, not the share of total health expenditure financed externally. The external-financing share is a separate indicator.
What is the difference between current US dollars and PPP-adjusted values?
Current US dollars show nominal dollar amounts, while PPP adjustment accounts for differences in purchasing power. They answer different questions and should not be treated as the same unit.
Does a zero on the map mean the data are missing?
No. Zero is a reported observation. Missing values are not converted to zero, and latest values outside 2023 are visually distinguished from the main 2023 panel.
Related Articles
Green Map creates custom-edited map images using open geographic data sources such as geoBoundaries, Natural Earth, OpenStreetMap, and government open data.
These maps are edited visual materials, not raw data files, and are provided for education, documents, presentations, and graphic reference.