Safely managed sanitation is a stricter measure than simply asking whether people have access to a toilet. It measures the share of the population using improved sanitation facilities that are not shared with other households and where excreta are either safely disposed of in place or removed and treated offsite. That makes it a useful indicator of the full sanitation service chain rather than access alone.
The latest non-missing observations for World Bank indicator SH.STA.SMSS.ZS cover 146 countries and economies and reveal a very wide distribution. The median is about 60.7% and the mean is about 59.4%. Thirty-seven observations are at or above 90%, while 62 are below 50% and 26 are below 25%. The central story is therefore not a small difference around a global average, but a large gap between places approaching universal coverage and places where safely managed sanitation reaches only a minority of the population.
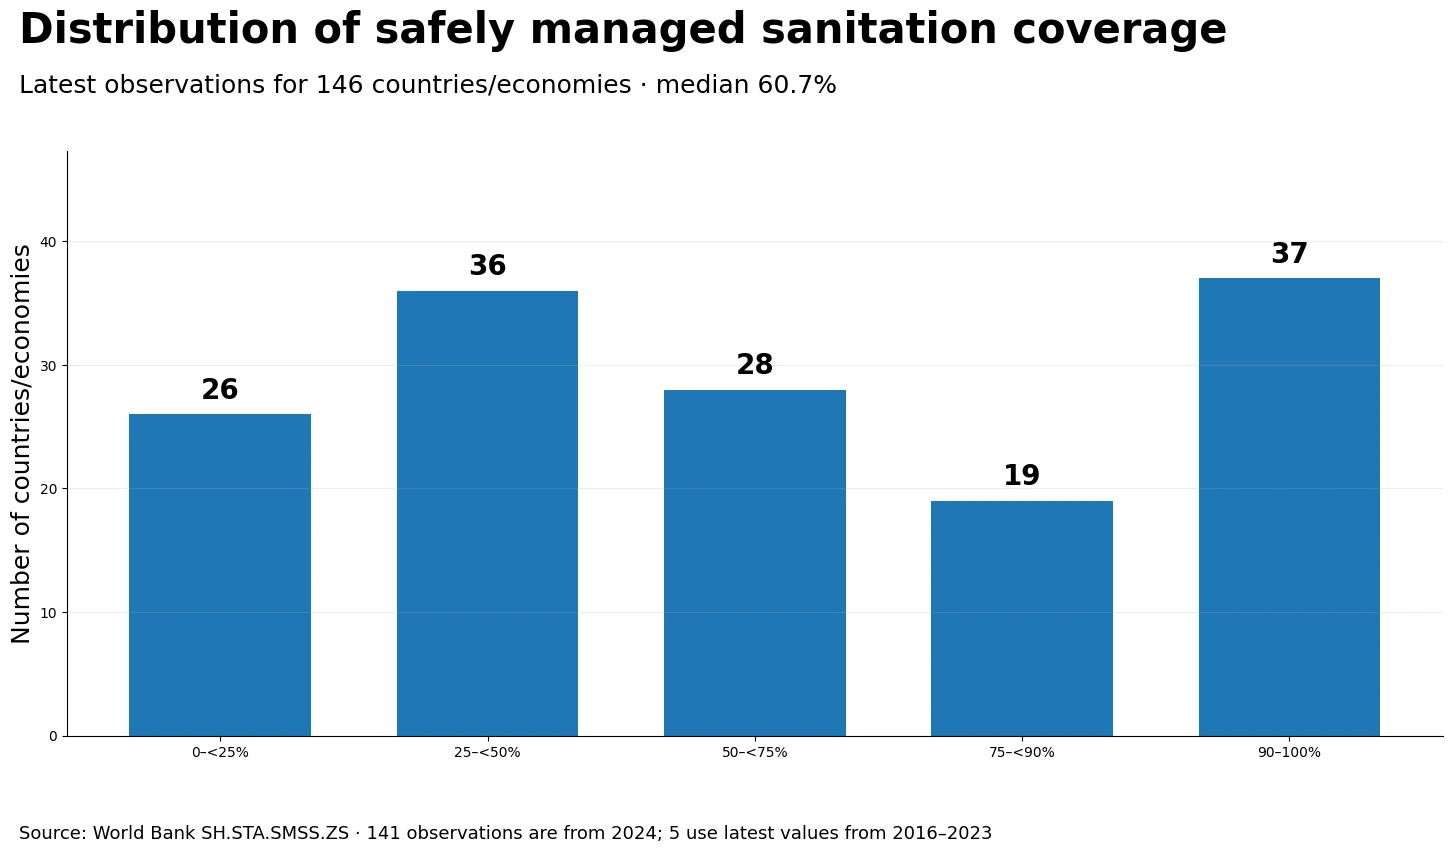
Table of Contents
What the indicator actually measures
The indicator combines two ideas: use of an improved sanitation facility and safe management of excreta. Improved facilities can include flush or pour-flush systems connected to sewers, septic tanks or pit latrines, as well as ventilated improved pit latrines, composting toilets and pit latrines with slabs when they meet the relevant standards. But the facility type alone is not enough. The service must not be shared with other households, and the waste must be safely managed either onsite or after collection and transport.
This is why the measure should not be read as a sewer-connection rate. A country can achieve a high safely managed sanitation share through a mix of sewered and well-managed onsite systems. Conversely, wider access to improved toilets does not automatically produce the same level of safely managed service if waste treatment and disposal are inadequate. The number reflects both access and what happens after use.
How the 146 observations are distributed
| Coverage band | Countries/economies | Share of 146 observations |
|---|---|---|
| 90–100% | 37 | 25.3% |
| 75–<90% | 19 | 13.0% |
| 50–<75% | 28 | 19.2% |
| 25–<50% | 36 | 24.7% |
| Below 25% | 26 | 17.8% |
The distribution is heavy at both ends. A quarter of the observations are at 90% or above, yet 26 are below 25%. Another 36 fall between 25% and 50%, meaning about 42.5% of the dataset is below the halfway mark. Looking only at the median would hide this polarization. For a country comparison, the size of the lower bands is at least as informative as the average.
A large gap between the highest and lowest observations
Andorra, Kuwait, Malta, Monaco and Singapore are recorded at 100% in their latest observations. Qatar is about 99.9%, Switzerland about 99.7%, Japan about 99.2% and Denmark about 98.9%. At this end of the distribution, differences are measured in fractions of a percentage point because the remaining uncovered share is very small.
At the other end, Ethiopia is about 8.1%, Morocco 8.4%, Niger 9.1%, Armenia 10.7% and Chad 11.1%. Greenland has a 2022 observation of 0% in the dataset, but its reference year differs from nearly all of the 2024 values. That year mismatch is important: a ranking based on latest available observations is not exactly the same thing as a synchronized one-year league table.
Why “2024 data” needs a qualification
Of the 146 observations, 141 are from 2024. Five use the most recent non-missing value available for an earlier year: Argentina is from 2016, Bosnia and Herzegovina from 2018, Croatia from 2021, Greenland from 2022 and Djibouti from 2023. The most accurate description is therefore a latest-observation comparison centered on 2024.
This matters most when interpreting older observations alongside current ones. Sanitation infrastructure, collection systems and treatment capacity can change over time, so an older figure should not automatically be treated as a precise description of present conditions. The observation year should be checked before making close comparisons or drawing conclusions from small differences.
Safely managed sanitation is not the same as basic sanitation
A closely related measure is the share of people using at least basic sanitation services. Basic sanitation focuses on the use of improved facilities that are not shared with other households. Safely managed sanitation adds the requirement that excreta be safely disposed of onsite or removed and treated offsite. Because of that extra condition, high basic-sanitation access does not guarantee an equally high safely managed sanitation rate.
The distinction changes how progress is interpreted. Adding toilets or improving household access is only one part of the sanitation chain. Collection, transport, treatment and safe onsite management determine whether improved facilities ultimately deliver a safely managed service. A country may therefore make visible gains in access while still facing a separate challenge in treatment and waste management.
Important cautions when reading the numbers
- The reference year is not identical for every observation. Most values are from 2024, but five come from earlier years.
- A value near 100% does not summarize every sanitation or public-health outcome. It measures the coverage defined by this indicator, not all aspects of wastewater quality, water safety or environmental performance.
- The dataset does not by itself prove why a value is high or low. Income, settlement patterns, infrastructure, governance and service operations may all matter, but causal explanations require additional evidence.
- National averages can hide internal inequality. Urban-rural differences, regional variation and household-level disparities are not visible in a single national percentage.
What the distribution tells us
Three points stand out. First, safely managed sanitation is close to universal in a meaningful group of countries and economies. Second, the lower half of the distribution remains large: 62 observations are below 50%. Third, the simultaneous presence of 37 observations above 90% and 26 below 25% shows that the cross-country gap is measured in tens of percentage points, not in minor differences around a common level.
The most useful way to use this dataset is to start with the distribution, then inspect an individual country’s value and reference year. Where the latest observation is old, future updates may materially change its position. For deeper analysis, the next step would be to combine this indicator with time series or urban-rural breakdowns, which can show whether improvements in facility access are being matched by safe management throughout the sanitation chain.
Source and measurement basis
The figures use the World Bank indicator People using safely managed sanitation services (% of population), SH.STA.SMSS.ZS. The comparison uses the latest non-missing observation for each included country or economy. Of 146 observations, 141 are from 2024. Values are percentages of the population.
Frequently Asked Questions
What does safely managed sanitation mean?
It means using an improved sanitation facility that is not shared with other households, with excreta safely disposed of onsite or removed and treated offsite.
Are all observations from 2024?
No. Of 146 observations, 141 are from 2024 and five use the latest non-missing value from 2016 to 2023.
How is safely managed sanitation different from basic sanitation?
Basic sanitation focuses on improved, non-shared facilities. Safely managed sanitation adds a requirement for safe onsite disposal or offsite treatment of excreta.
Related Articles
Green Map creates custom-edited map images using open geographic data sources such as geoBoundaries, Natural Earth, OpenStreetMap, and government open data.
These maps are edited visual materials, not raw data files, and are provided for education, documents, presentations, and graphic reference.