March 2026 QCEW employment by state shows how the absolute size of covered payroll employment is distributed across the United States. The data come from the Bureau of Labor Statistics Quarterly Census of Employment and Wages and compare the last month of the first quarter across the 50 states and the District of Columbia. Monthly employment represents covered workers who worked during, or received pay for, the pay period including the 12th day of the month.
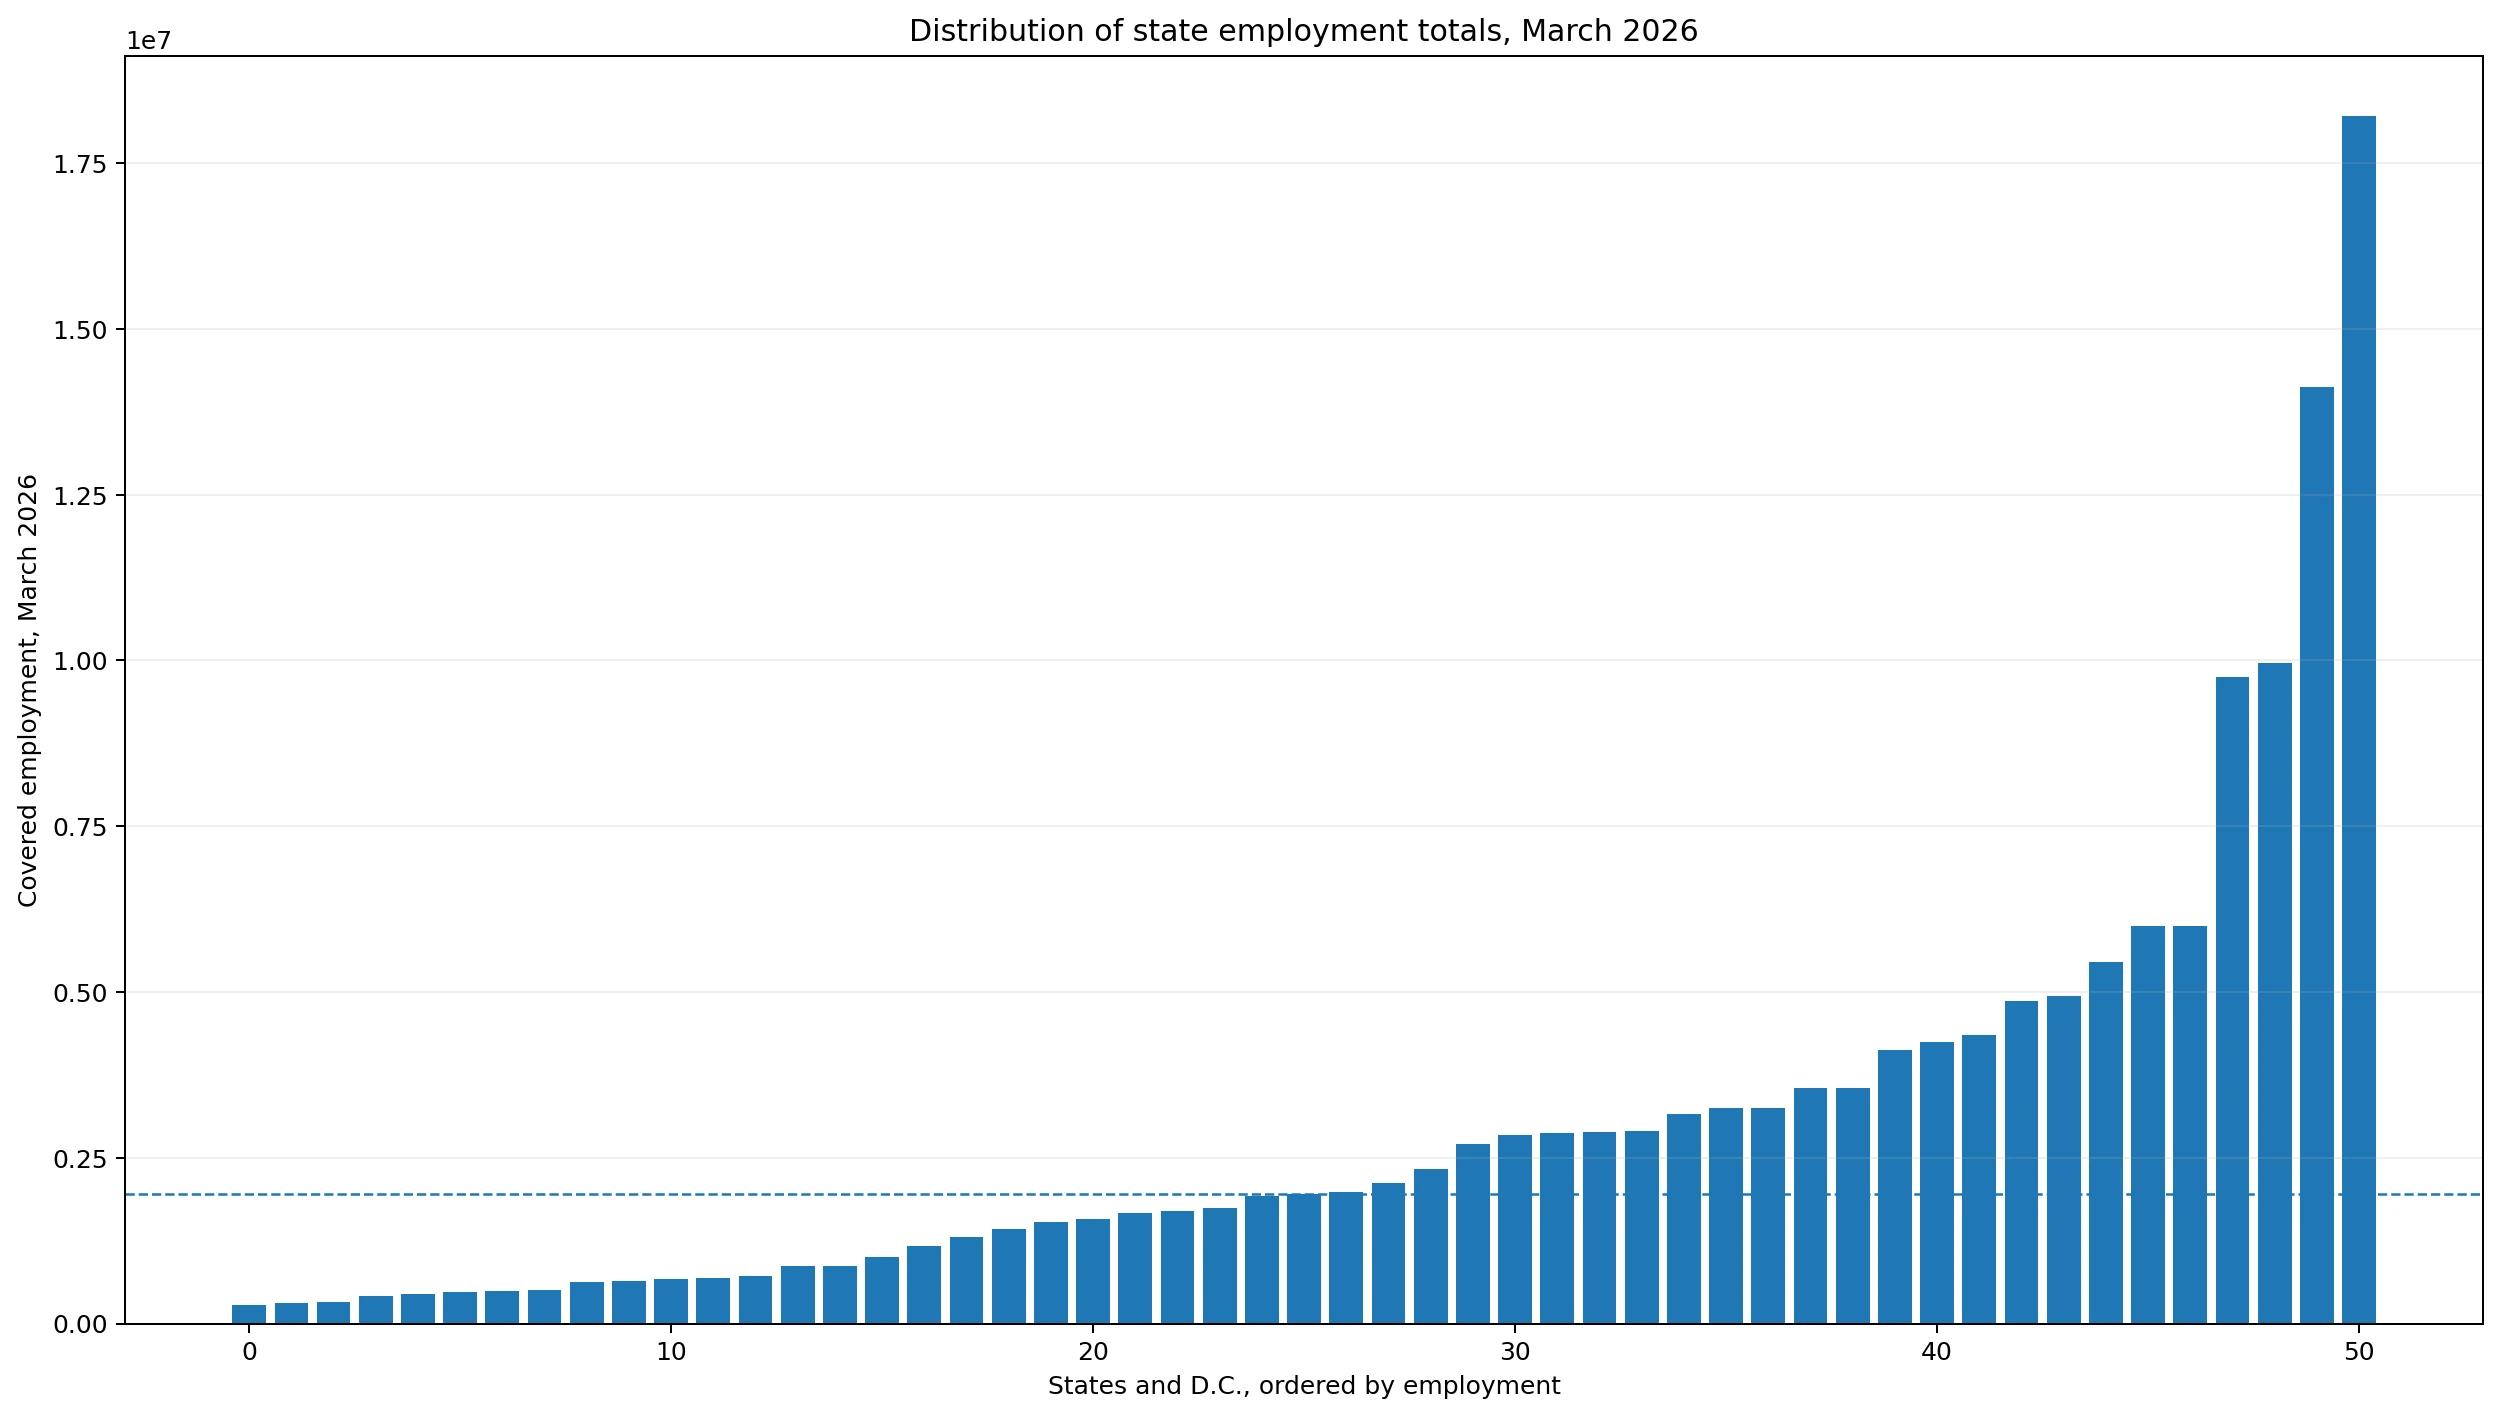
All 51 state-level areas have reported values, with no missing observations. The median is 1,952,327 jobs and the mean is 3,034,744. The first quartile is 791,586 and the third quartile is 3,555,752. California has the largest observation at 18,211,770 jobs, while Wyoming has the smallest at 275,190.
This is an absolute job count, not an employment rate, employment-to-population ratio, or growth rate. Large states naturally tend to rank high because they contain more residents, establishments, and economic activity. A high value should therefore be interpreted as a large employment base rather than stronger labor-market performance.
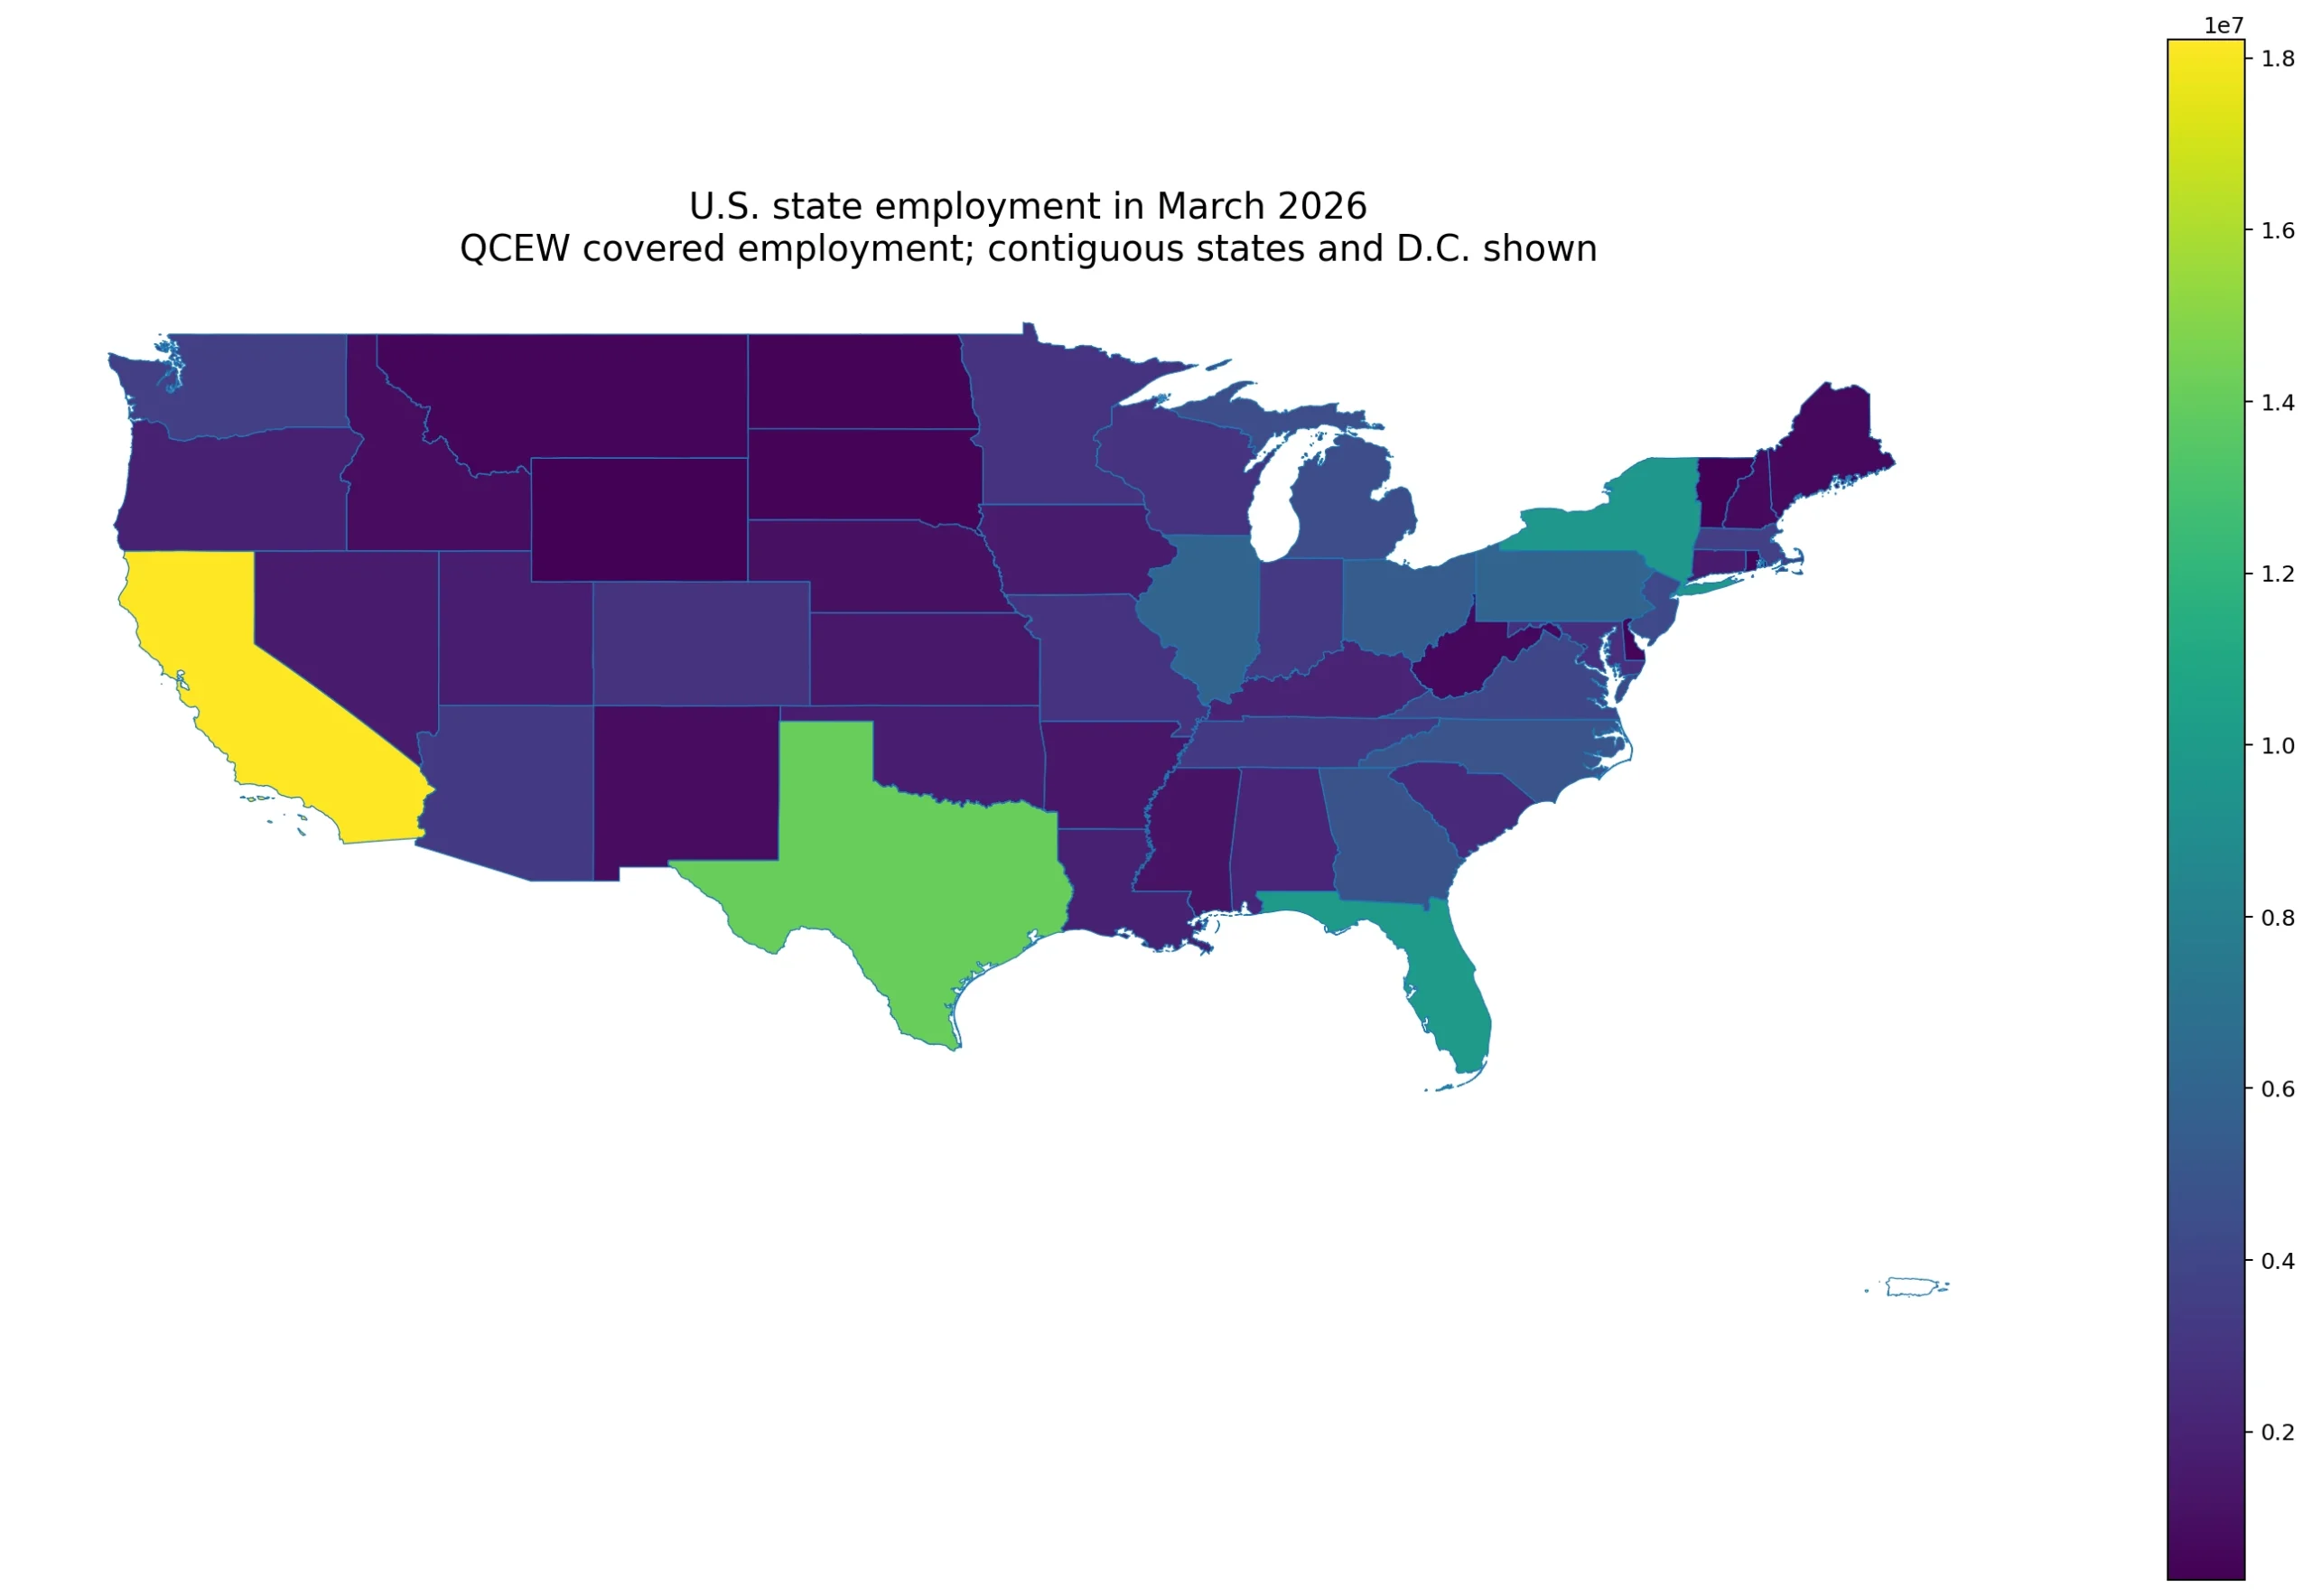
Table of Contents
California and Texas form the two largest state employment bases
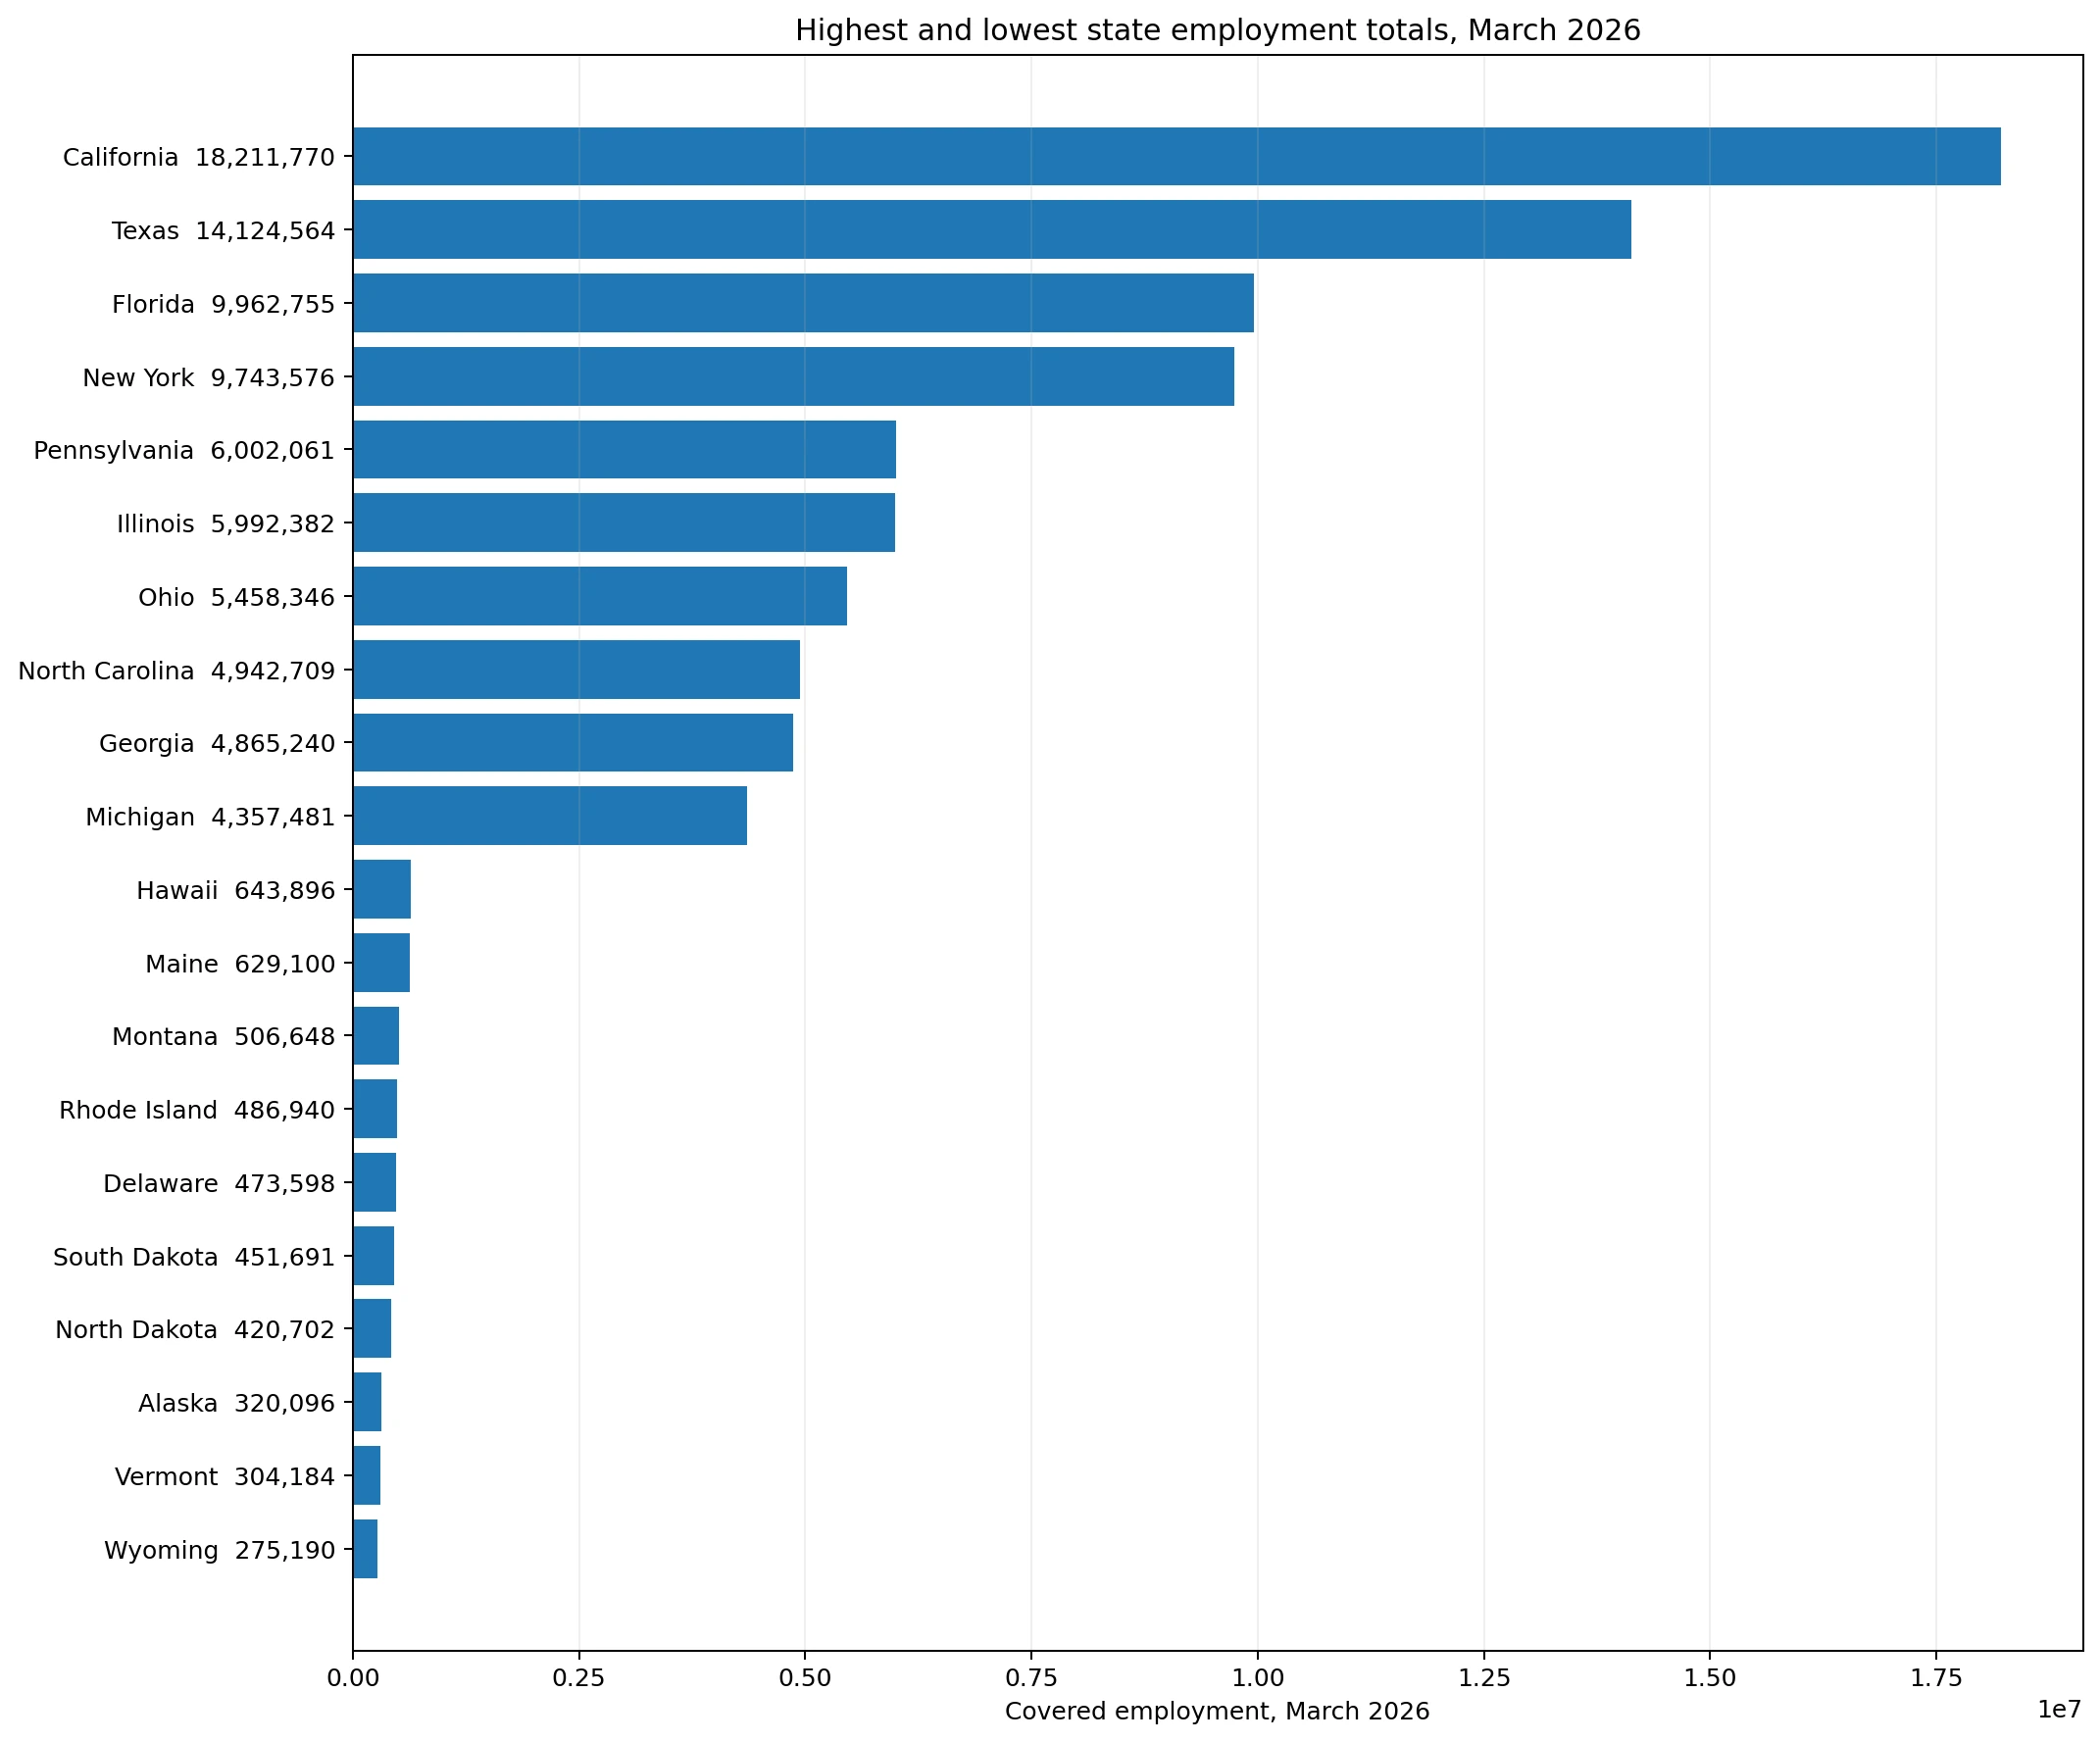
California records 18,211,770 covered jobs and Texas 14,124,564. Florida follows at 9,962,755 and New York at 9,743,576. Pennsylvania, Illinois, Ohio, and North Carolina also record several million jobs. The top of the ranking is therefore dominated by states with large populations and dense concentrations of employers.
The total includes employment across industries rather than one specific sector. Manufacturing, services, health care, education, logistics, construction, government, and other covered activities are combined. Industry structure requires separate NAICS-level QCEW data.
| Highest state-level areas | March employment |
|---|---|
| California | 18,211,770 |
| Texas | 14,124,564 |
| Florida | 9,962,755 |
| New York | 9,743,576 |
| Pennsylvania | 6,002,061 |
| Illinois | 5,992,382 |
| Ohio | 5,458,346 |
| North Carolina | 4,942,709 |
| Georgia | 4,865,240 |
| Michigan | 4,357,481 |
The smallest totals mainly occur in low-population states
Wyoming has the smallest state-level total at 275,190 jobs, followed by Vermont at 304,184 and Alaska at 320,096. North Dakota, South Dakota, Delaware, Rhode Island, and Montana are also near the lower end. Their small absolute totals are closely related to smaller populations and establishment bases.
A low job count is not the same as a weak labor market. A small state can have low unemployment or strong job growth while still ranking near the bottom in absolute employment. Measures of performance require rates or changes over time.
| Lowest state-level areas | March employment |
|---|---|
| Wyoming | 275,190 |
| Vermont | 304,184 |
| Alaska | 320,096 |
| North Dakota | 420,702 |
| South Dakota | 451,691 |
| Delaware | 473,598 |
| Rhode Island | 486,940 |
| Montana | 506,648 |
| Maine | 629,100 |
| Hawaii | 643,896 |
The gap between the median and the largest states is substantial
The median across the 51 areas is 1,952,327 jobs, while the 90th percentile is 5,992,382. California and Texas extend the upper tail far beyond the middle of the distribution. The state employment distribution is therefore highly uneven in absolute size.
There are 7 areas below 500,000 jobs, 8 from 500,000 to under 1 million, 19 from 1 million to under 3 million, 12 from 3 million to under 6 million, and 5 at 6 million or more. The median is more informative than the mean when a few very large states pull the average upward.
| Employment range | States / D.C. |
|---|---|
| Below 500,000 | 7 |
| 500,000 to under 1 million | 8 |
| 1 million to under 3 million | 19 |
| 3 million to under 6 million | 12 |
| 6 million or more | 5 |
State data answer a different question from county data
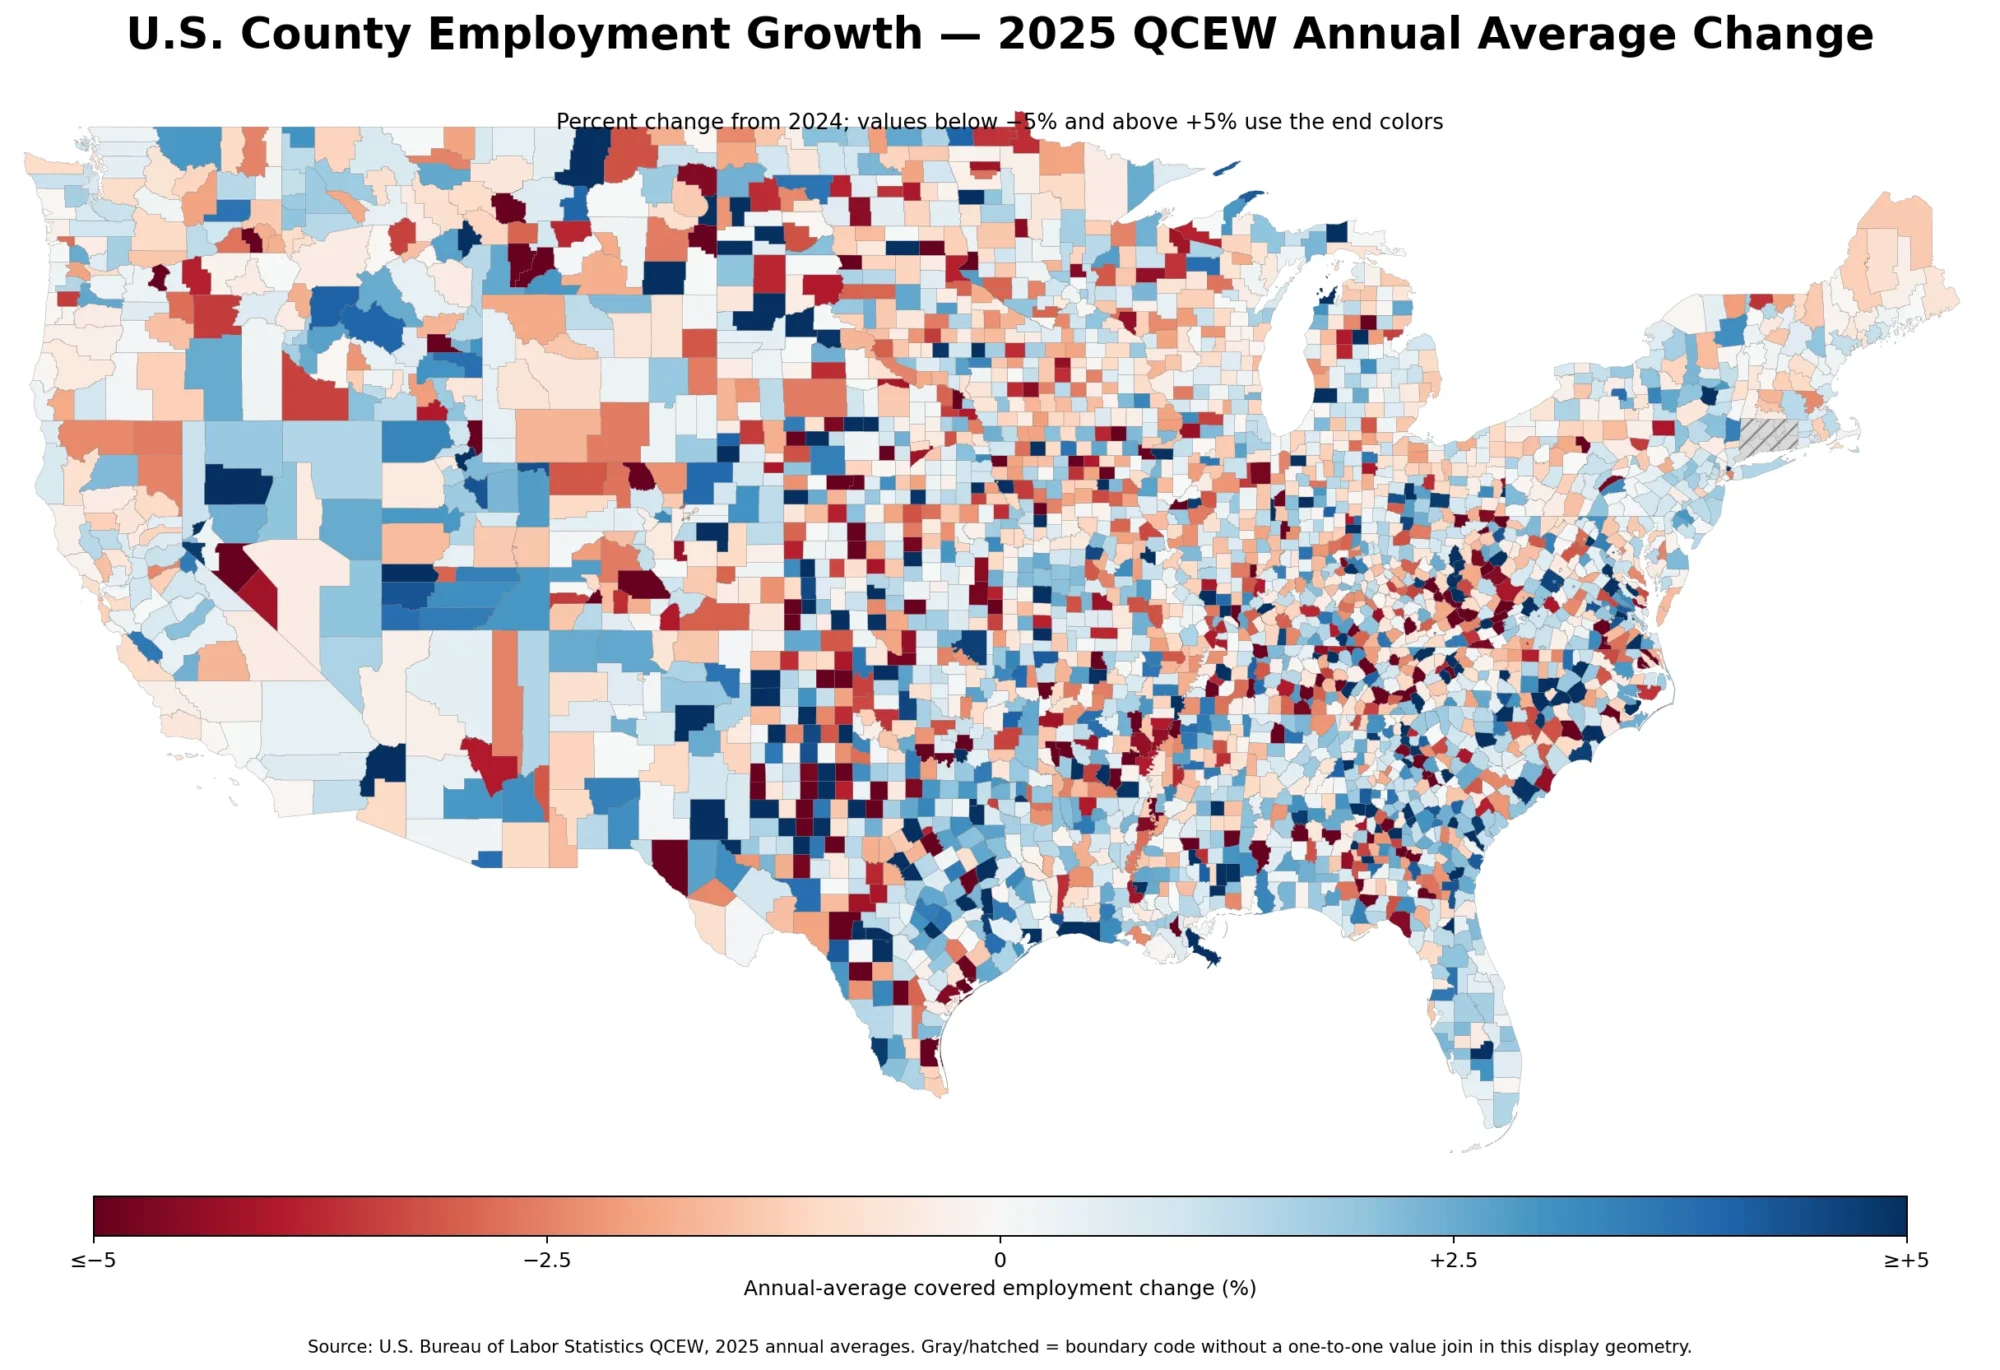
The state-level series provides a broad overview of where large employment bases are located. County data reveal the internal geography that the state total hides. A state can have millions of jobs while a large share of those jobs is concentrated in a relatively small number of metropolitan counties.
The two levels are therefore complementary. State data are useful for national-scale comparison, while county data are better for locating specific employment centers, suburban job clusters, and rural contrasts within the same state.
QCEW employment is based on establishment location
QCEW is built largely from unemployment-insurance administrative records and reports employment where establishments are located. This differs from household surveys that classify employed people by where they live. Interstate commuting and multi-location employers can therefore create differences between establishment-based jobs and resident employment.
Population-normalized comparisons require a separate denominator. Two states can have very different job totals simply because their populations differ. Employment rates, labor-force participation, and jobs per resident answer different questions from the absolute QCEW count.
March is the last month of the quarter, not the quarterly average
The observation refers to March 2026, the final month of the first quarter. It is not the average of January, February, and March. Seasonal industries can produce meaningful monthly changes, so March should be treated as a snapshot rather than a permanent annual employment level.
Trend analysis requires comparisons with earlier months, quarters, or years. A high March level does not indicate growth unless it is compared with a prior period using the same definition.
All 51 areas have reported values
The state-level dataset has no missing observations for the 50 states and the District of Columbia. That means the ranking and summary statistics do not need to substitute zeros for missing values or exclude unreported states.
Alaska and Hawaii are not drawn on the main contiguous-state map because of geographic layout and readability, but both are fully included in the statistics, rankings, and charts.
Key takeaways
March 2026 QCEW employment is available for all 51 state-level areas, with a median of 1,952,327 jobs. California is highest at 18,211,770 and Wyoming lowest at 275,190. A relatively small group of large states forms the upper tail of the distribution.
The key interpretation rule is that the measure represents absolute establishment-based employment. It does not tell us which state has the highest employment rate or the fastest job growth. Those questions require population, unemployment, labor-force, and time-series indicators.
Frequently Asked Questions
Is March 2026 state employment an employment rate?
No. It is an absolute count of covered workers reported in QCEW for the March reference pay period.
Is March employment the first-quarter average?
No. It is the employment level for March, the last month of the first quarter.
Does California having the most jobs mean it has the strongest labor market?
Not necessarily. The total measures market size. Labor-market performance requires rates or changes over time.
Are Alaska and Hawaii included?
Yes. They are included in every statistic and ranking even though the main map focuses on the contiguous states for readability.
Related Articles
Green Map creates custom-edited map images using open geographic data sources such as geoBoundaries, Natural Earth, OpenStreetMap, and government open data.
These maps are edited visual materials, not raw data files, and are provided for education, documents, presentations, and graphic reference.