The share of men aged 65–69 varies sharply across the 217 countries and economies with a 2025 World Bank observation. Hong Kong SAR, China has the highest value at 8.31%, while Mozambique has the lowest at 0.72%. A value of 6% means that about six out of every 100 males in that reporting economy are aged 65–69. It does not mean that men aged 65–69 are 6% of the total population.
This five-year age band captures a cohort just beyond the conventional 65-year threshold often used in population statistics. In 2025, most of the men in the group were born in the late 1950s. Their current share reflects the size of that birth cohort, survival over roughly six and a half decades, migration, and the size of every other male age group in the denominator. The indicator is therefore best read as a measure of age structure, not as a standalone score of how old a population is.
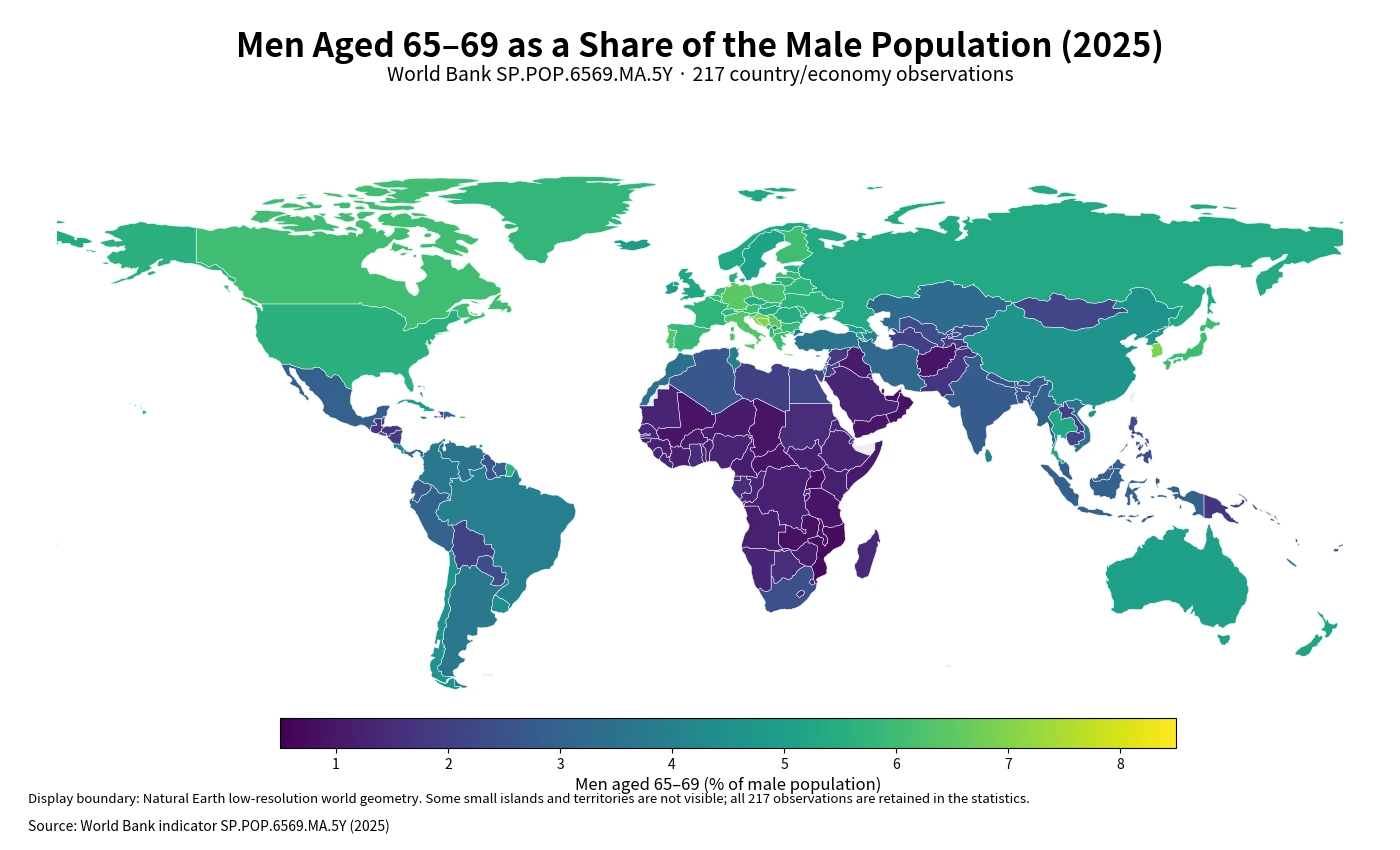
Table of Contents
Higher shares cluster in parts of Europe and East Asia
The map shows a broad concentration of higher values in Europe, with several Balkan, Central European, and Southern European countries above 6%. Hong Kong SAR, China stands out above 8%, while Bosnia and Herzegovina, Croatia, Serbia, Germany, Italy, Portugal, and Slovenia are among the larger visible values. Several very small economies and territories also appear near the top of the ranking, although some are too small to be legible as polygons on a world map.
At the other end, many countries in Sub-Saharan Africa are close to or below 1%. Mozambique, Uganda, Zambia, Malawi, Chad, and the Central African Republic are among the lowest observations. The United Arab Emirates, Qatar, and Oman are also low, but similar percentages do not imply similar demographic histories. Young age structures, male-dominated labour migration, survival patterns, and changes in the rest of the male population can all affect the numerator or denominator. The 2025 cross-section describes the result of those processes without identifying a single cause.
The highest and lowest observations differ by 7.59 percentage points
Hong Kong SAR, China at 8.31% and Mozambique at 0.72% are separated by about 7.59 percentage points. The highest share is roughly 11.5 times the lowest. That is a large difference for a single five-year age band: in one case the group is around one in twelve males, while in the other it is less than one in one hundred.
| High rank | Country/economy | Share | Low rank | Country/economy | Share |
|---|---|---|---|---|---|
| 1 | Hong Kong SAR, China | 8.31% | 1 | Mozambique | 0.72% |
| 2 | Monaco | 7.46% | 2 | United Arab Emirates | 0.79% |
| 3 | Bosnia and Herzegovina | 7.02% | 3 | Uganda | 0.79% |
| 4 | Virgin Islands (U.S.) | 6.96% | 4 | Zambia | 0.83% |
| 5 | Bermuda | 6.93% | 5 | Qatar | 0.85% |
| 6 | Korea, Rep. | 6.92% | 6 | Oman | 0.85% |
| 7 | Croatia | 6.82% | 7 | Malawi | 0.89% |
| 8 | San Marino | 6.55% | 8 | Chad | 0.90% |
| 9 | Serbia | 6.48% | 9 | Afghanistan | 0.91% |
| 10 | Germany | 6.48% | 10 | Central African Republic | 0.92% |
The top ten include a mixture of European countries, small territories, and East Asian economies. Korea, Rep. is sixth at 6.92%. The bottom ten are dominated by African countries plus several Gulf economies. These rankings should not be interpreted as rankings of the number of older men. A small economy can have a high percentage but far fewer men aged 65–69 than a large country with a lower share.
The median is 3.26%, with the middle half between 1.60% and 5.28%
Across all 217 observations, the mean is 3.48% and the median is 3.26%. The first quartile is 1.60% and the third quartile is 5.28%, so the middle half of reporting economies falls within a range of about 1.60–5.28%. The mean sits only modestly above the median, but the full distribution remains wide because substantial groups of economies sit near 1–2% while another cluster lies around 5–6%.
| Share of males aged 65–69 | Countries/economies | Share of 217 |
|---|---|---|
| Below 1% | 14 | 6.5% |
| 1% to under 2% | 58 | 26.7% |
| 2% to under 3% | 32 | 14.7% |
| 3% to under 4% | 24 | 11.1% |
| 4% to under 5% | 24 | 11.1% |
| 5% to under 6% | 41 | 18.9% |
| 6% or more | 24 | 11.1% |
The largest single band is 1% to under 2%, containing 58 observations, or 26.7% of the total. Another 41 economies fall between 5% and 6%, while 24 are at 6% or above. This spread helps explain why a single global average would hide much of the demographic contrast visible on the map.
This is not the same as the share of all older men
The indicator includes only ages 65 through 69. Men aged 70–74, 75–79, 80–84, and older are outside the numerator. A country with 6% of its male population in the 65–69 band could have a very different total 65-plus population from another country with the same 6%. For a broader view of population ageing, this measure should be paired with indicators such as the total share aged 65 and older, median age, life expectancy, or old-age dependency ratios.
The narrow band is useful for a different reason: it makes the size of a specific cohort visible. Comparing adjacent five-year groups can reveal whether the population is thickest at 60–64, 65–69, or 70–74. That type of cohort profile is especially valuable when age structure matters for retirement, health services, or labour-force transitions. This article uses only the 65–69 series, however, so it does not infer the shape of adjacent age groups that are not included in the dataset.
Percentages and headcounts answer different questions
A percentage controls for the size of the male population. That makes it possible to compare age composition across economies ranging from small islands to countries with tens or hundreds of millions of residents. But it also means the ranking does not tell us where the largest number of men aged 65–69 live. A 7% share in a small territory can correspond to fewer people than a 2% share in a very large country.
For planning questions, both measures matter. Health-care systems, pension administration, transport, housing, and other services depend on the number of people as well as their percentage of the population. Conversely, headcounts alone are heavily influenced by total country size and can obscure differences in age structure. The percentage and the absolute count are complementary, not substitutes.
The late-1950s cohort is shaped by much more than births
Most men who were 65–69 in 2025 were born around 1956–1960. A relatively large birth cohort can still be visible decades later, but survival and migration continually reshape it. The denominator matters just as much: if younger male cohorts grew rapidly, the 65–69 group can make up a smaller percentage even when its own headcount is substantial. If younger cohorts are smaller, the same number of 65–69-year-old men can represent a larger share.
Male migration can be especially important in economies with large flows of working-age labour. A large influx of younger adult men expands the denominator and may mechanically reduce the percentage represented by older age groups. Out-migration can work in the opposite direction. Still, this dataset alone cannot establish how much migration contributed to any particular value. Confirming a cause would require age-specific migration, mortality, birth, and historical population series.
A 2025 map cannot establish whether the share is rising or falling
This dataset is a cross-section for one year. Five years later, much of the 2025 population aged 60–64 will have moved into the 65–69 band, while the current 65–69 cohort will have shifted to 70–74. An economy that ranks high today can therefore move lower later even without a sudden demographic shock. Determining a trend requires multiple years of the same indicator.
The percentage can also move differently from the headcount. The number of 65–69-year-old men may rise while their share falls if the total male population grows faster. The reverse is possible if the rest of the male population contracts more quickly. Any trend analysis should separate changes in the numerator from changes in the denominator rather than treating the percentage as a direct count.
Small territories may be more visible in the table than on the map
The World Bank country series includes separately reported economies and territories as well as sovereign states. Monaco, Bermuda, the U.S. Virgin Islands, San Marino, and several other small places have valid observations but are difficult or impossible to see as polygons at this world-map scale. Their values remain part of every statistical calculation.
The low-resolution boundary layer used for display has 170 polygons that match a 2025 World Bank observation by ISO3 code. Statistical coverage is broader: the maximum, minimum, mean, median, quartiles, rankings, and distribution bands use all 217 observations. Map visibility and statistical inclusion are therefore separate issues.
Data source and calculation
The analysis uses the 2025 values from the World Bank API series SP.POP.6569.MA.5Y. The World Bank indicator page provides the definition and country-level time series. The unit is men aged 65–69 as a percentage of the total male population. Aggregate regional and income-group rows are excluded; the dataset contains 217 country and economy observations.
All 217 rows have a reported 2025 value. No missing value is replaced with zero, and no earlier year is substituted. The rankings, mean, median, quartiles, range, and band counts are calculated directly from those observations. The map uses a separate low-resolution geographic layer only for visualization, so tiny territories may be absent from the visible geometry even though their observations remain in the statistics.
Frequently Asked Questions
What does a 6% value mean for this indicator?
It means that about 6 out of every 100 males in that reporting economy are aged 65–69. It is not 6% of the total population.
Does a higher share automatically mean the population is older overall?
No. This indicator covers only the five-year 65–69 age band. A broader assessment of population ageing requires other age groups and indicators as well.
Can the 2025 data show whether the share is increasing?
No. A one-year cross-section does not establish a trend. Multiple years of the same indicator are needed to determine whether the share is rising or falling.
Related Maps
Green Map creates custom-edited map images using open geographic data sources such as geoBoundaries, Natural Earth, OpenStreetMap, and government open data.
These maps are edited visual materials, not raw data files, and are provided for education, documents, presentations, and graphic reference.