Male current tobacco use varies widely across the 166 countries and separately reported areas with a numeric 2024 observation in the World Bank table. The median is 27.0%, the unweighted mean is 29.34%, and the range extends from 5.8% to 76.2%. Most observations are not at either extreme: 122 of the 166 values fall between 10% and 40%. The map is therefore more useful as a view of broad geographic differences than as a list of a few high or low countries.
The indicator is World Bank code SH.PRV.SMOK.MA, Prevalence of current tobacco use, males (% of male adults). It covers men ages 15 and older who currently use any tobacco product either daily or non-daily. The definition includes smoked tobacco such as cigarettes, cigars, pipes, waterpipes and heated tobacco products, as well as oral and nasal smokeless tobacco. Electronic products that do not contain tobacco, including e-cigarettes, are outside this indicator. The rates are age-standardized to the WHO Standard Population, which matters when countries have very different age structures.
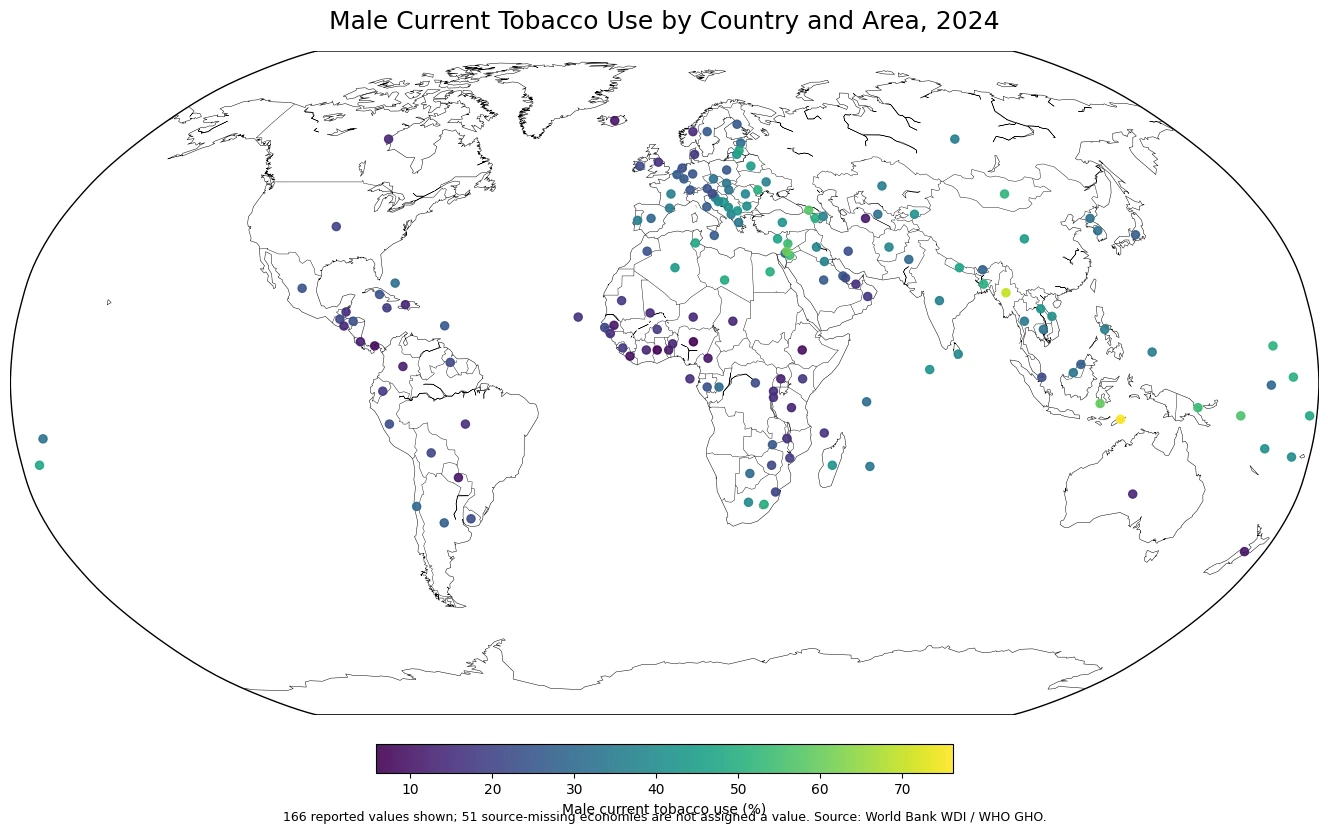
Table of Contents
Current tobacco use is broader than cigarette smoking
A country’s value should not be read as its cigarette-smoking rate. “Current tobacco use” combines several product categories and counts both daily and occasional users. That distinction is especially important in countries where smokeless tobacco or non-cigarette products account for a meaningful part of use. Two countries can have similar values in this series while the products behind those values are quite different.
The indicator also does not measure nicotine use from every product. Because tobacco-free electronic nicotine products are excluded, an area with substantial e-cigarette use could still have a comparatively low value here. Conversely, a high value can reflect a mix of smoked and smokeless tobacco. The cleanest interpretation is therefore the one in the indicator name: the age-standardized prevalence of current tobacco-product use among males ages 15 and older.
The median is 27.0%, with half of observations between 17.55% and 38.98%
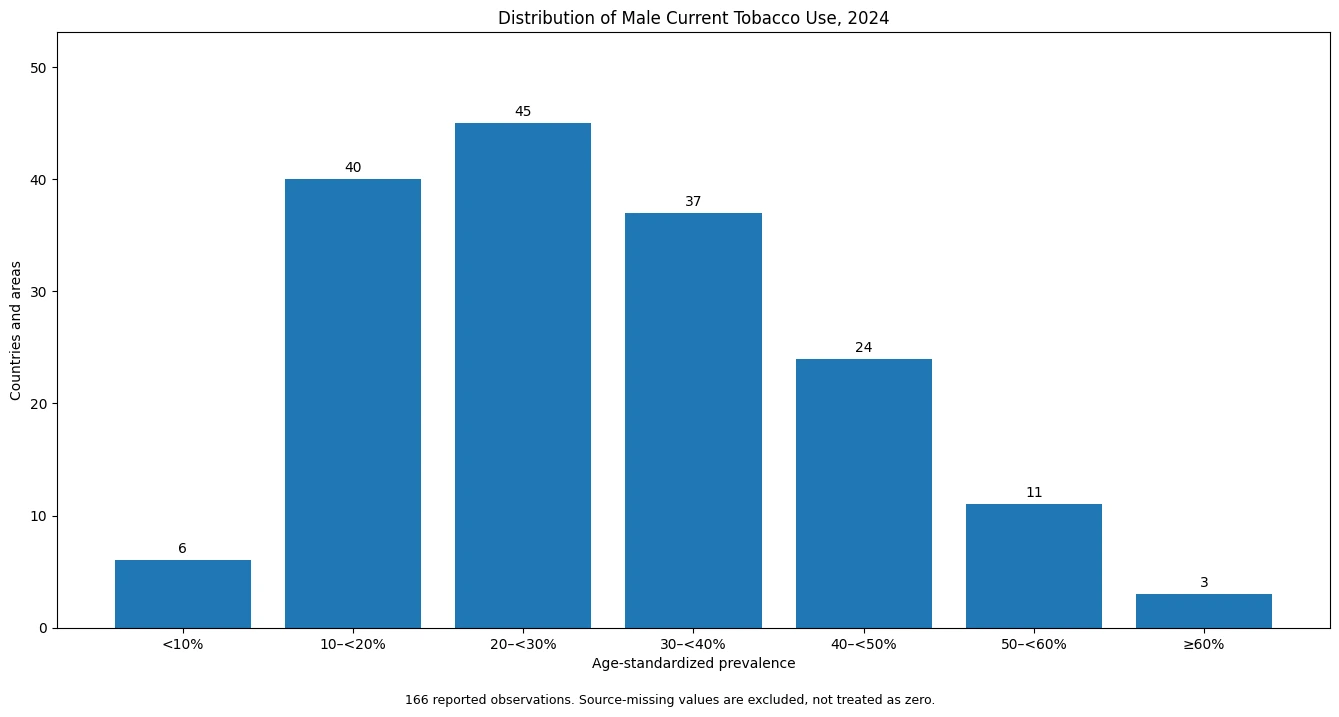
Giving each reporting country or area one equal observation, the first quartile is 17.55%, the median is 27.0%, and the third quartile is 38.98%. The simple mean, 29.34%, is somewhat higher than the median because the upper tail includes several values above 50%. This is not a population-weighted global prevalence rate. A very populous country and a small territory each contribute one value to these summary statistics.
| 2024 male tobacco-use band | Countries and areas |
|---|---|
| Below 10% | 6 |
| 10 to <20% | 40 |
| 20 to <30% | 45 |
| 30 to <40% | 37 |
| 40 to <50% | 24 |
| 50 to <60% | 11 |
| 60% or more | 3 |
The largest band is 20% to under 30%, containing 45 observations. Another 40 are between 10% and 20%, and 37 are between 30% and 40%. At the high end, 14 observations are at least 50%, including three at 60% or more. That distribution is why the median is a useful reference point: it describes the middle country or area without being pulled upward as much by the small group of very high values.
Higher values appear across parts of Southeast Asia, the Pacific, West Asia and the Caucasus
Timor-Leste has the highest reported 2024 value at 76.2%, followed by Myanmar at 70.1%. The World Bank row labeled West Bank and Gaza is 60.3%, Indonesia is 59.3%, and Georgia is 57.5%. Other values above 50% include Solomon Islands at 56.2%, Jordan at 55.1%, Lebanon at 54.1%, Papua New Guinea at 53.5%, Mongolia at 51.7%, Marshall Islands at 51.3%, Moldova at 50.7%, Armenia at 50.5% and Kiribati at 50.4%.
The map does not support a single explanation for those high observations. Tobacco price, taxation, regulation, income, product mix, survey history and social patterns may all differ, but none of those variables is included in this one-series dataset. The inclusion of smokeless tobacco also means that a high male tobacco-use prevalence should not automatically be described as a high cigarette-smoking prevalence.
| Higher observation | Rate | Lower observation | Rate |
|---|---|---|---|
| Timor-Leste | 76.2% | Nigeria | 5.8% |
| Myanmar | 70.1% | Ghana | 6.0% |
| West Bank and Gaza | 60.3% | Panama | 7.8% |
| Indonesia | 59.3% | Liberia | 8.7% |
| Georgia | 57.5% | Ethiopia | 8.8% |
Several lower observations are in West Africa, but low values are not confined to one region
Nigeria has the lowest numeric observation at 5.8%, closely followed by Ghana at 6.0%. Panama is 7.8%, Liberia 8.7% and Ethiopia 8.8%. Iceland is also below 10% at 9.4%. Cameroon is 10.0%, Paraguay 10.1%, Senegal 10.2%, and both New Zealand and Turkmenistan are 10.3%. A cluster of lower values can be seen across parts of West Africa, yet the low end also includes countries from other regions.
A lower number in this male series should not be treated as a complete measure of a country’s tobacco-related health burden. It says nothing directly about female prevalence, former tobacco use, secondhand smoke, consumption intensity, disease outcomes, or electronic-cigarette use. Those questions require separate indicators. The series is strongest when used for the narrow question it was designed to answer: how age-standardized current tobacco use among adult males differs across reporting countries and areas.
Age standardization makes cross-country comparison cleaner, but it does not remove all uncertainty
Countries have different age structures, and tobacco use can vary substantially by age. WHO standardizes the rates to a common reference population so that an older or younger male population does not by itself drive the international comparison. That makes a map of the standardized values more comparable than a collection of crude national percentages.
The WHO tobacco series also uses statistical modeling to produce comparable estimates by country and sex from available survey evidence. For that reason, very small gaps between countries should not be treated as exact league-table differences. A value of 27% versus 28% is useful context, but it does not mean the underlying behavior has been measured with one-percentage-point precision in identical national surveys. Broad ranges, clusters and large differences are more robust ways to use the map.
Fifty-one source-missing rows remain missing rather than becoming zeros
The validated 2024 table contains 217 country and area rows. A numeric value is present for 166 of them, while 51 are marked as source-missing. Those missing entries are excluded from the mean, median, quartiles, distribution bands and high/low tables. They are also not assigned a value on the map. Treating a missing entry as 0% would falsely imply that no adult men currently use tobacco there.
The same caution applies to the mean. The 29.34% figure is the arithmetic mean of the 166 reported percentages, not the share of all men in the world who use tobacco. A global male prevalence estimate would need population weights or an official WHO global aggregate. The unweighted country mean is useful for describing the shape of this country-level dataset, but it answers a different question from a worldwide person-level rate.
Tobacco prices can add context, but price and prevalence are not interchangeable
Retail price data are a natural companion topic because they describe the market environment in which tobacco is sold. They still measure something different. A cigarette-price series refers to a particular product and retail unit, while this prevalence series covers current use of a much broader set of tobacco products. A country with a high cigarette price does not automatically have a low male tobacco-use rate, and this cross-section alone cannot establish that price caused any observed difference.
Source and calculation method
Country values come from World Bank World Development Indicators series SH.PRV.SMOK.MA. World Bank identifies the WHO Global Health Observatory as the original source and defines the measure as the percentage of males ages 15 and older who currently use tobacco products on a daily or non-daily basis, age-standardized to the WHO Standard Population. All statistics on this page use the 166 numeric observations dated 2024. No population weighting is applied, and the 51 missing values remain missing.
The formal definition is available in the World Bank WDI metadata and the WHO tobacco-use indicator documentation. Those sources also clarify the product coverage and the exclusion of tobacco-free electronic products.
Frequently Asked Questions
Is current tobacco use the same as cigarette smoking prevalence?
No. The indicator includes smoked and smokeless tobacco products and counts both daily and non-daily users. Tobacco-free electronic products such as e-cigarettes are excluded.
What is the median male current tobacco-use rate across the 166 reported 2024 observations?
The median is 27.0%. This is the median of country and area percentages, not a population-weighted global male prevalence rate.
Why are the country rates age-standardized?
Countries have different age structures and tobacco use varies by age. Standardizing to the WHO reference population reduces the effect of those age-structure differences on cross-country comparisons.
Were the 51 missing country and area rows treated as zero?
No. Source-missing values remain missing and are excluded from the map statistics, mean, median and rankings.
Related Article
What Did the Most-Sold Cigarette Brand Cost Across Countries? (2020) — a separate WHO-based comparison of cigarette retail prices. Price and tobacco-use prevalence should be read as different measures rather than treated as direct substitutes.
Related Maps
Green Map creates custom-edited map images using open geographic data sources such as geoBoundaries, Natural Earth, OpenStreetMap, and government open data.
These maps are edited visual materials, not raw data files, and are provided for education, documents, presentations, and graphic reference.