Greene County in southwestern Indiana changes character quickly from west to east. Around Linton, the land is broad and comparatively low, and the main roads and communities are easy to pick out. Around Bloomfield, the central river lowlands become more important. Farther east toward Solsberry and Richland Creek, short ridges and narrow valleys crowd the map. This page follows that west-to-east change, and the matching high-resolution JPG maps are available together in a downloadable ZIP below.
This Greene County Indiana Map page uses Linton and Bloomfield as practical reference points without treating them as the same kind of center. Linton is the strongest western landmark and ranks first on the supplied city index. Bloomfield is the county seat and lies nearer the middle of the county. Switz City sits between them, Jasonville is in the northwest, Worthington is farther north, and Lyons is southwest. To the east, Solsberry becomes more useful as a terrain reference than as part of the six-place city ranking.
A useful way to read the page is to locate Linton and Bloomfield first, then follow the major river lowlands toward the more dissected Richland Creek side. The elevation colors make that same transition even clearer. The images embedded in the article are web-sized previews, while the download box provides the full-resolution JPG originals for closer viewing, printing, or use in larger documents.
Table of Contents
Linton and Bloomfield give the road network two useful anchors
Start on the western side of the general map at Linton. State Road 59 runs north toward Jasonville, while Route 54 heads east through Switz City toward Bloomfield. A 200 road label appears south of Linton, and Route 67 angles toward Lyons in the southwest. Those connections make Linton a convenient place to establish direction before moving into the denser network around the center of the county.
Bloomfield sits farther east and connects a different set of directions. U.S. 231 runs north and south through the area, providing a useful line toward Worthington to the north and the Newberry and Scotland side to the south. Route 445 appears east of Bloomfield, with Solsberry farther toward the eastern side. The roads are still easy to follow, but the land around them becomes more dissected by small valleys and streams than it is on the Linton side.
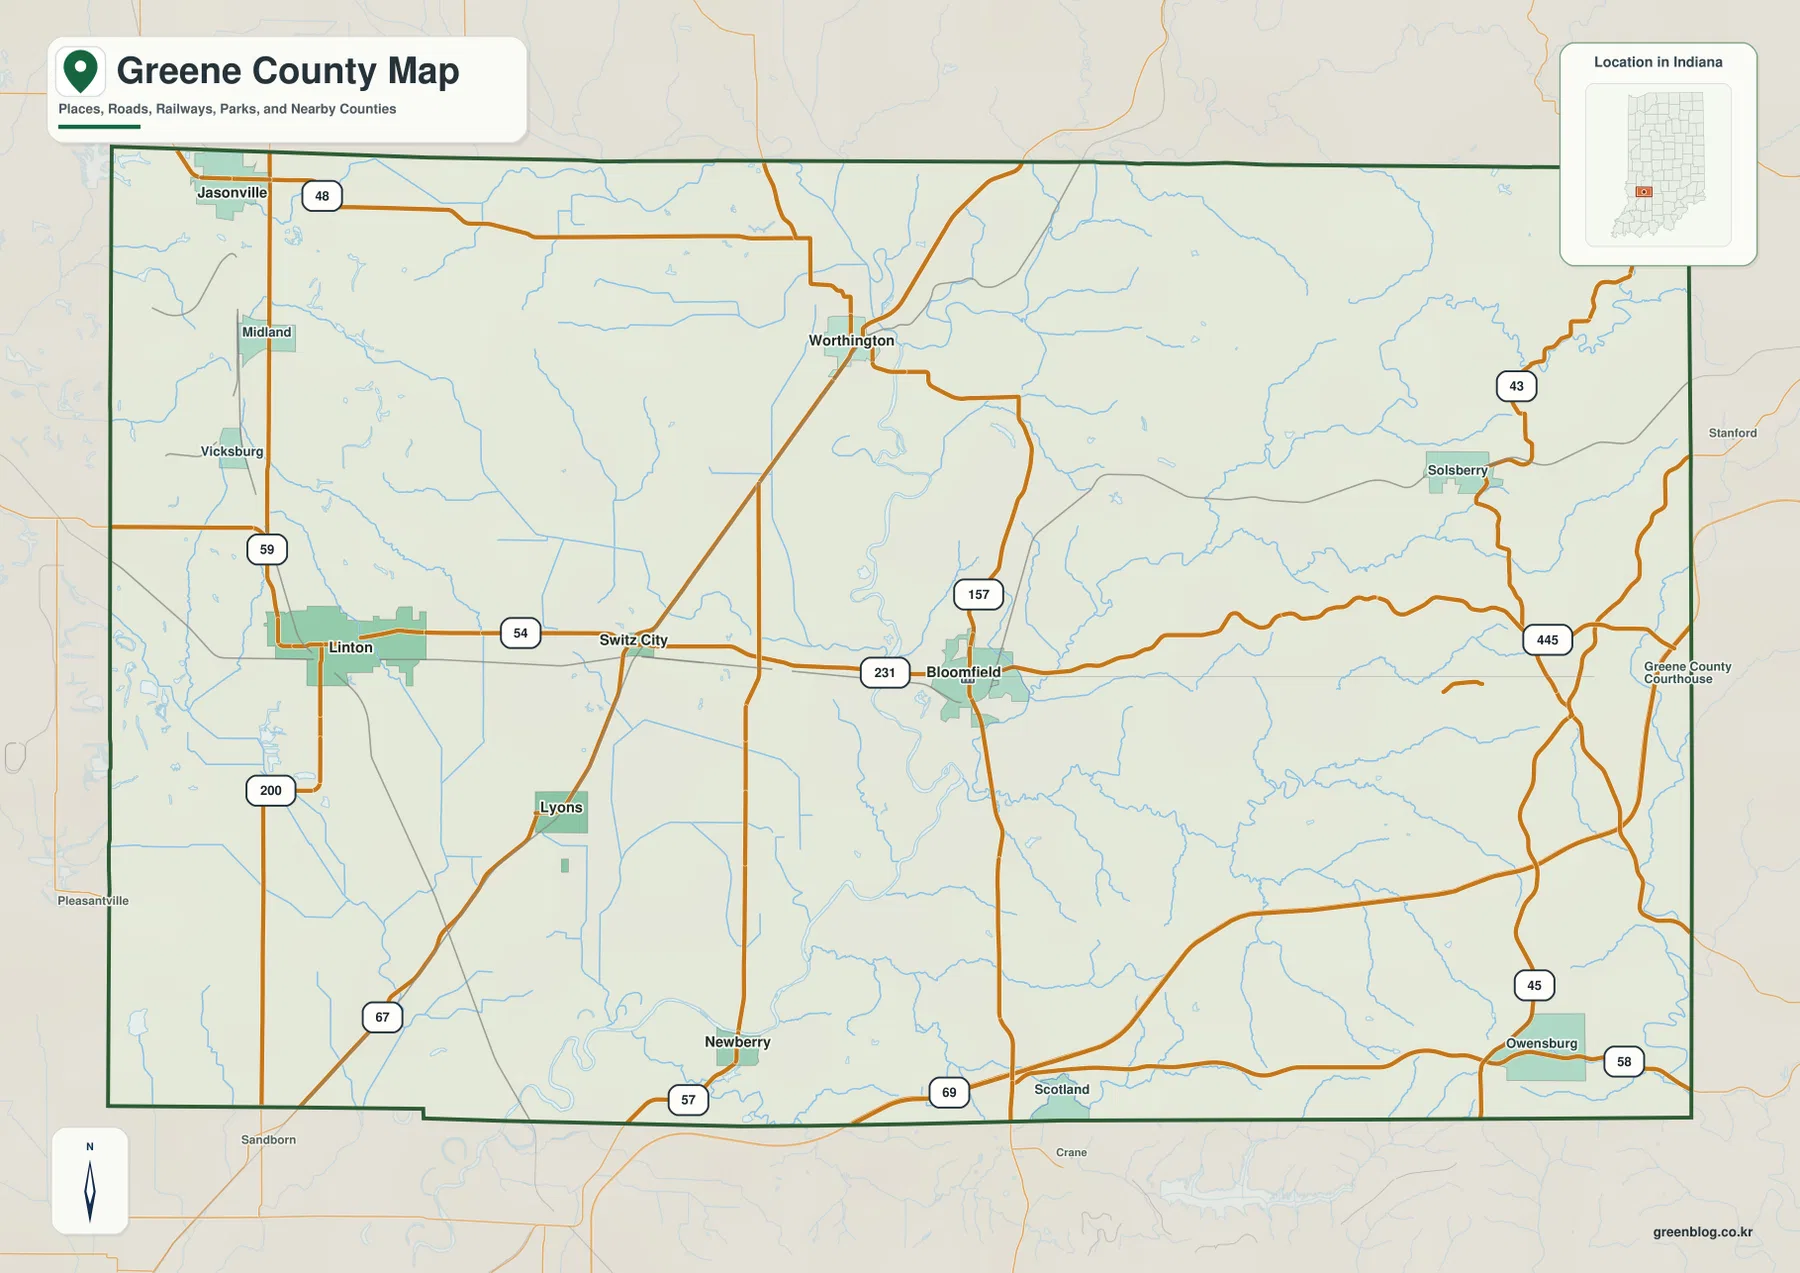
Jasonville and Worthington help define the northern half. Jasonville is close to the northwest corner, while Worthington lies farther east in the north-central part of the county. In the south, Newberry appears below the center and Owensburg is near the southeast. Learning those locations on the general map pays off later because the water and elevation maps remove much of the road emphasis and make rivers, creeks, and landform changes more prominent.
The labels outside the county boundary also provide useful orientation. Sullivan County is to the west, Clay and Owen counties are to the north, and Monroe County lies to the east. The Greene County outline itself is fairly simple, but the interior is not uniform. Roads and named communities are visually stronger across much of the west and center, while the east becomes increasingly defined by drainage lines and relief.
The six highlighted communities lean heavily toward the west and center
The city-distribution map removes many minor roads and labels so the six ranked communities can be compared directly. Its printed CITY INDEX lists Linton at 5,260, Bloomfield at 2,713, Jasonville at 1,979, Worthington at 1,411, Lyons at 920, and Switz City at 306. Those numbers are the values shown on the supplied map; they should not automatically be treated as current population estimates. Current population questions are better checked against U.S. Census Bureau data.
The spatial pattern is more important here than the numeric ranking. Linton and Jasonville occupy the west, Lyons sits southwest, and Switz City and Bloomfield fill the west-central to central corridor. Worthington stands farther north. None of the six highlighted places occupies the far eastern half, so the simplified view makes the west-central concentration unusually obvious.
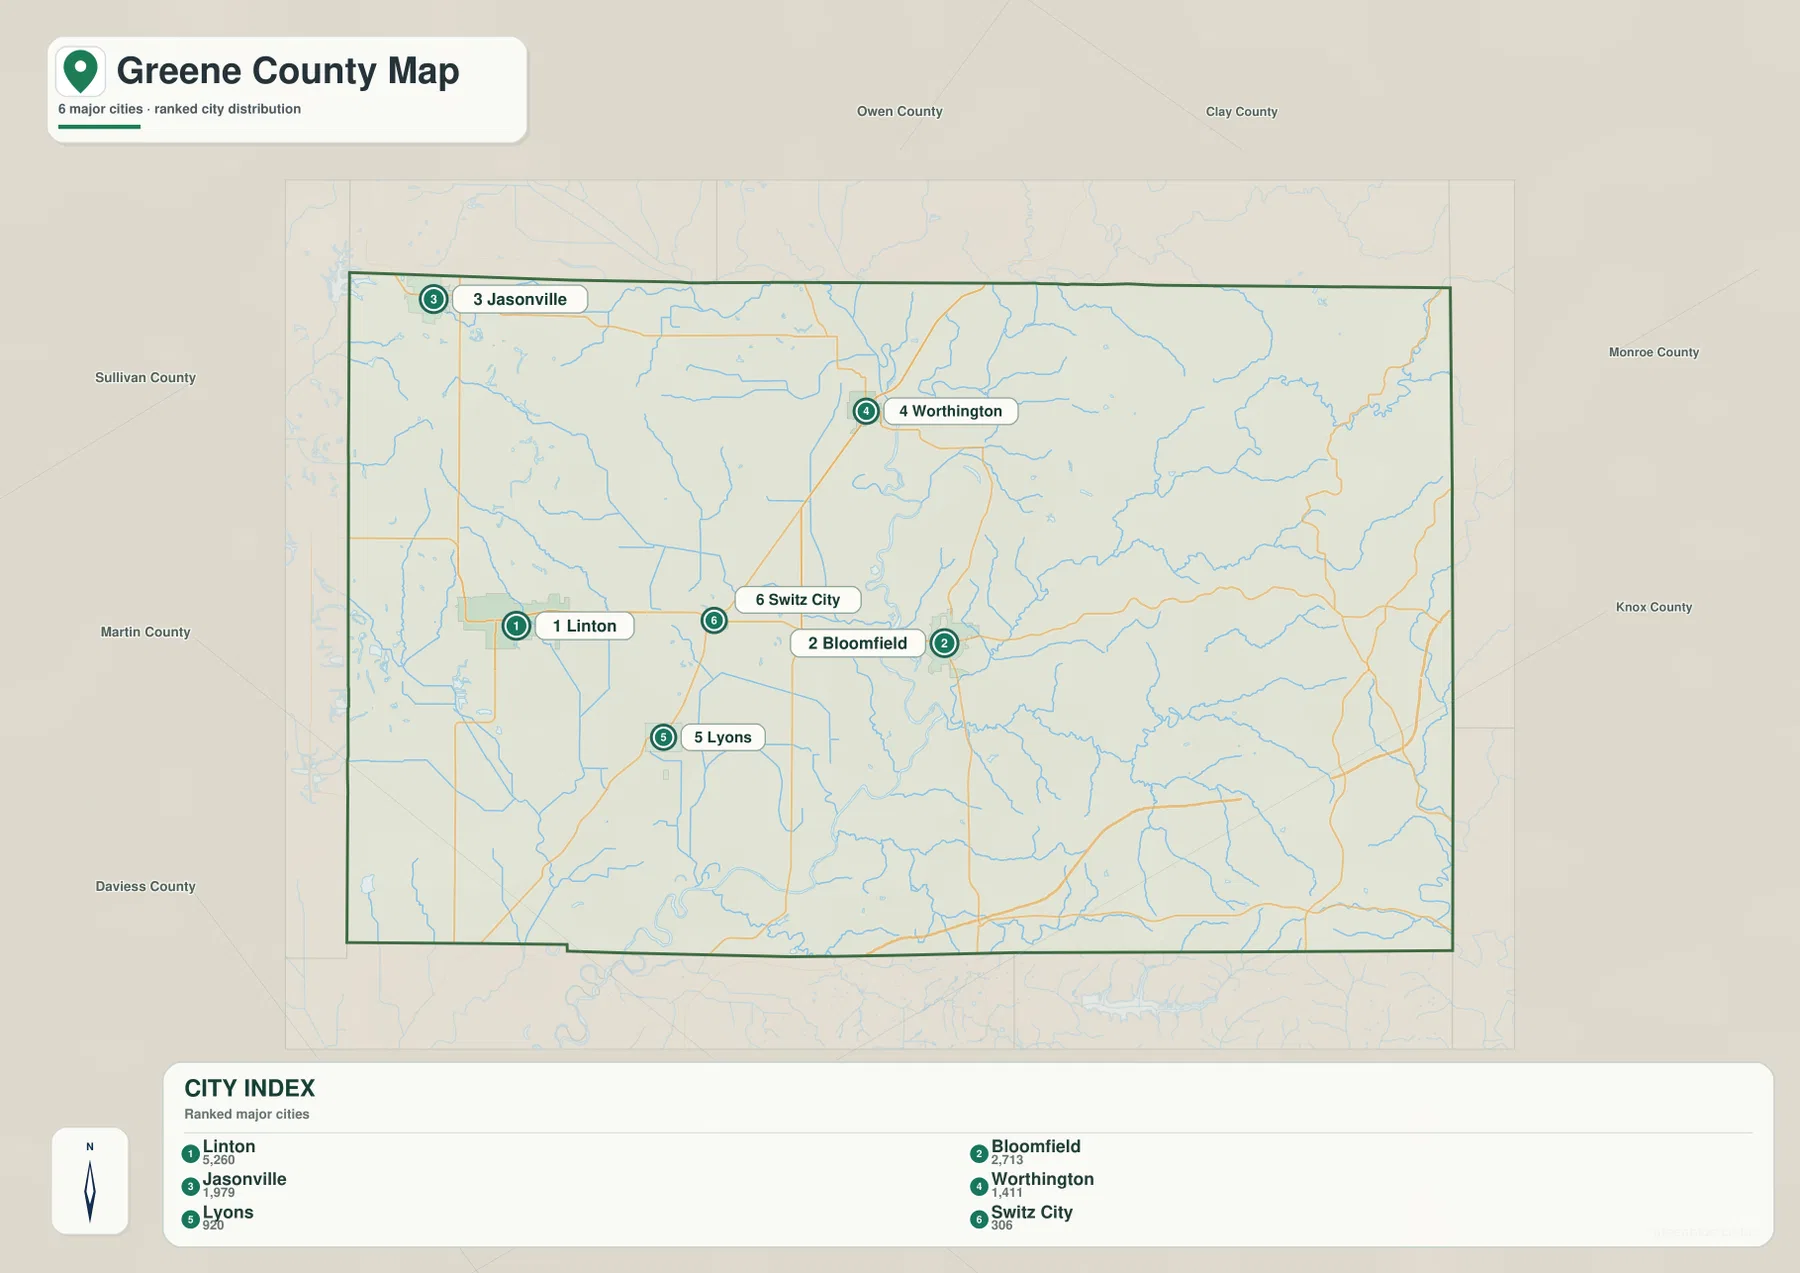
Solsberry is visible on the general map but is not part of this six-place city index. That difference is useful rather than contradictory. It shows that the map layers emphasize different parts of the county: the city view is strongest for settlement distribution, while the eastern side becomes much more informative when terrain and drainage are displayed. Greene County is therefore a place where a single layer can give a misleadingly incomplete impression if it is read by itself.
Linton and Bloomfield also answer different orientation questions. Linton works best for the western road network and for relating Jasonville and Lyons to the rest of the county. Bloomfield is better for connecting north, south, and east because it sits closer to the county’s middle and near the transition into more broken terrain. Using both as anchors makes the rest of the settlement pattern easier to remember.
Broad river lowlands give way to narrow creek valleys in the east
The terrain-and-water map shifts attention away from roads. Eel River descends from the north-central part of the county, and the White River label appears on the larger river corridor nearby. Latta Creek and Black Creek are visible farther west. In the northwest, Bennington Lake, Powell Pond, Boat Lake, and Harmons Lake form a compact cluster, while Lake Shiners and Wampler Lake appear farther south on the western side.
The eastern drainage looks different. Richland Creek follows a long, winding valley through a much more textured landscape. Plummer Creek crosses the southeast, and Indian Creek runs close to the eastern boundary. Beechwood Lake appears by itself in the central-east. Rather than looking like open channels across broad flats, these eastern streams occupy narrow low corridors enclosed by repeated ridges.
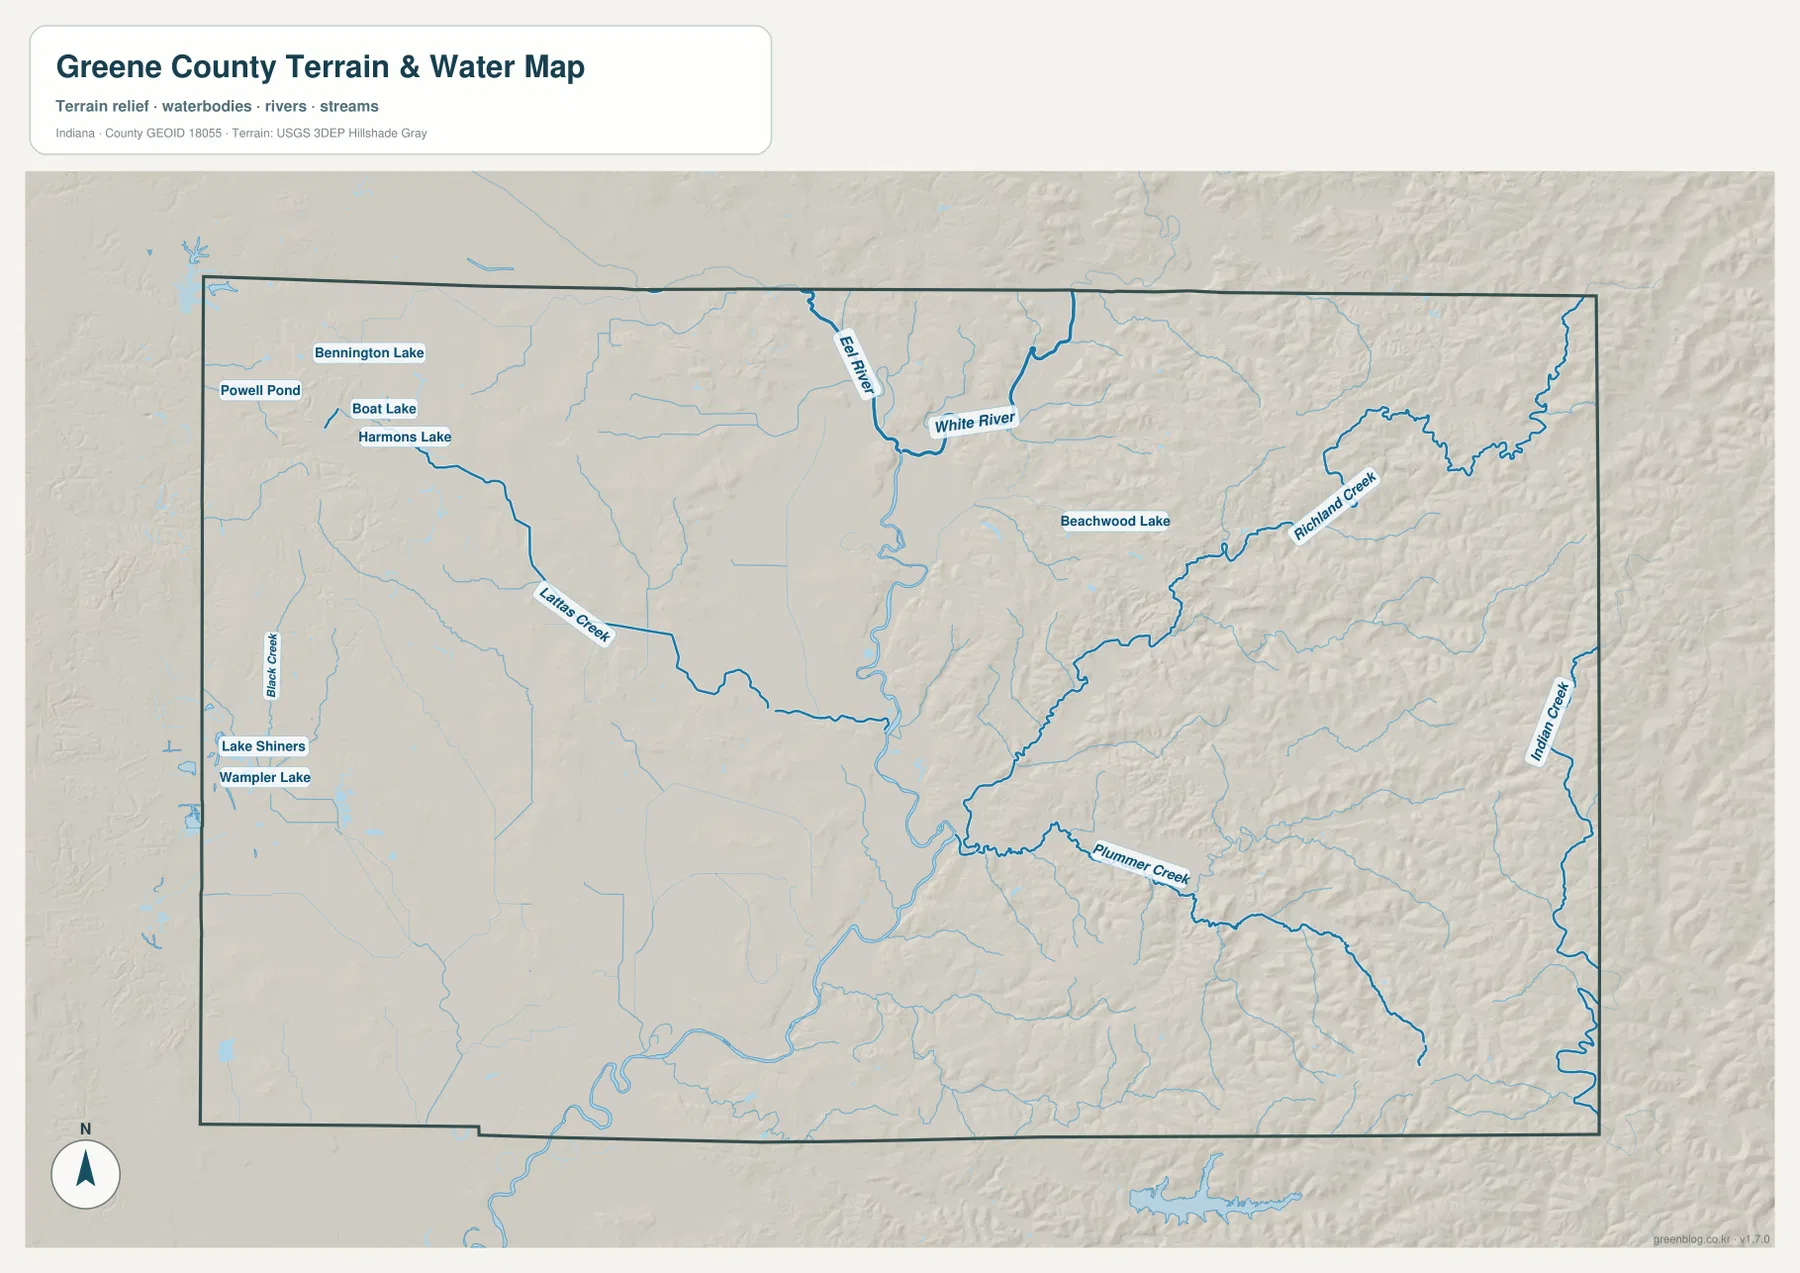
The shaded relief behind the water lines explains why the eastern creeks look so different. Richland Creek is bordered by repeated hills, and Plummer Creek winds through a similarly broken part of the county. Around Linton and Lyons, the background is broader and smoother. The map therefore does more than identify water names; it shows how drainage responds to the county’s west-to-east change in relief.
This water layer is a county-scale geographic reference, not a floodplain, parcel, legal-water-boundary, or navigation product. A blue line does not establish flood risk, public access, navigability, ownership, stream depth, or regulatory status. Those questions require current information from FEMA, USGS, Indiana DNR, or the relevant local authority.
The 140–281 m elevation range exposes the county’s strongest east-west contrast
The elevation map provides the clearest single view of Greene County’s terrain split. Its legend reports an actual countywide range of 140 to 281 meters and a mean of 181 meters. Greens dominate much of the west and the broad central lowlands. Yellows, oranges, and browns become increasingly common toward the east, where short ridges and valleys repeat across the northeast and southeast.
A lower corridor winds through the center in roughly the same area occupied by the major rivers on the water map. Smaller low branches extend from it into tributary valleys. Bloomfield lies near the transition: the terrain around it is not as uniformly low as the far western flats, yet it is still less rugged than the Solsberry and Richland Creek side. That makes Bloomfield a useful geographic midpoint as well as an administrative one.
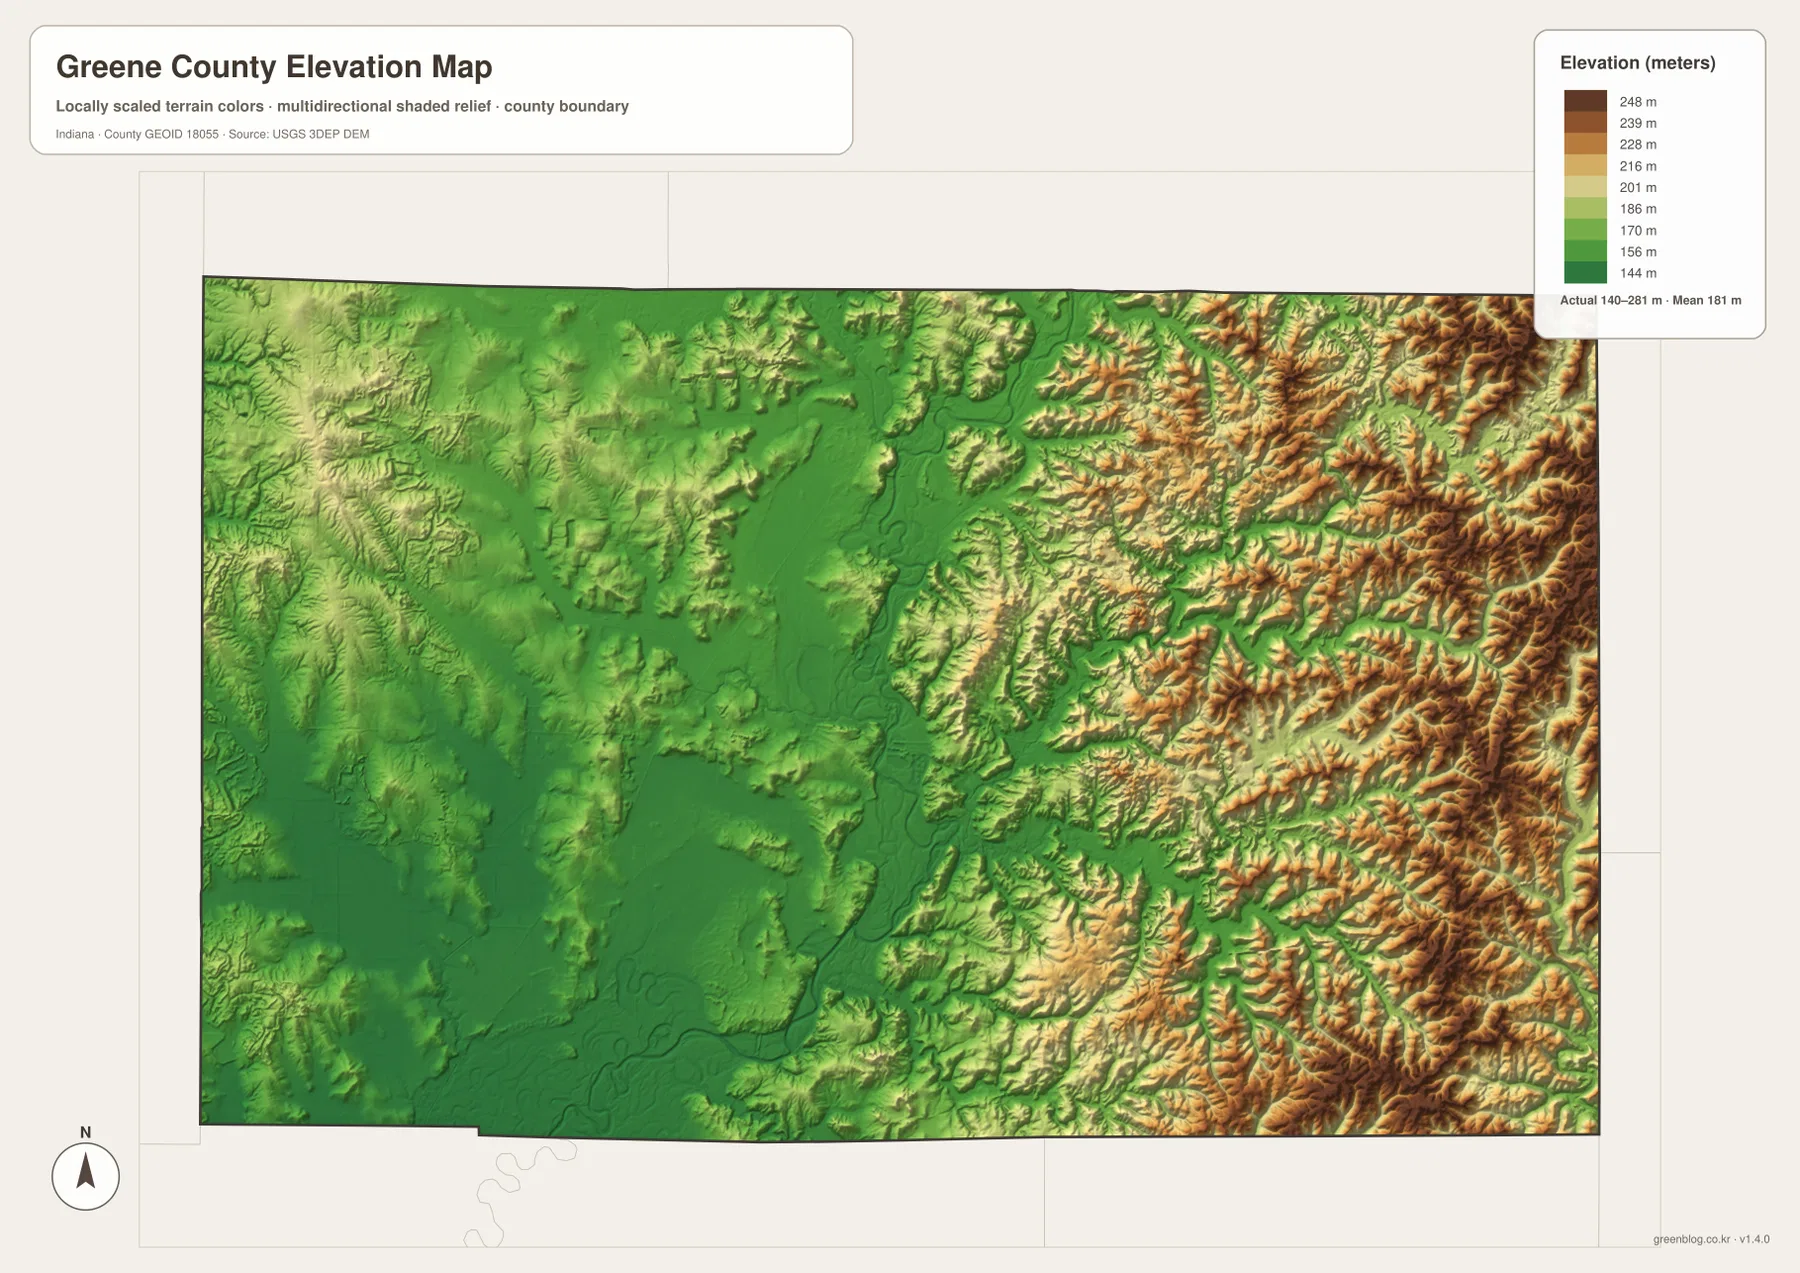
The west is not perfectly flat. Small stream valleys and modest rises remain visible near the local drainage network and along parts of the southern edge. The important difference is scale and frequency. Western elevation changes are generally broader and more gradual, while the east contains many short ridges separated by narrow valleys. That is why a simple description of Greene County as either flat or hilly misses the most useful feature of the map.
The colored elevation surface is generalized for county-level comparison. The stated minimum, maximum, and mean do not make an individual color patch an exact property elevation. Engineering design, grading, drainage calculations, or site-specific elevation work should use source data such as USGS 3DEP or a professional survey.
A west-to-east trip from Linton to Solsberry ties all four views together
Following the county from Linton toward Solsberry is the simplest way to combine the four map layers. Around Linton, the general map has a clear developed area and strong road connections, the city map ranks the community first, the western water map contains several small lakes and gentler drainage, and the elevation surface stays largely green. Those independent cues all point to a broad, relatively low western setting.
Moving east through Switz City toward Bloomfield brings the central road network and the major river lowlands into the same area. Bloomfield remains prominent as a community, but the physical landscape begins to change around it. The lower river corridors are still obvious, yet the terrain immediately east becomes more broken and the drainage network gains tighter curves and narrower valleys.
East of Bloomfield, Solsberry and Richland Creek become more useful references than the six-city ranking. Richland Creek occupies a long valley, Plummer Creek and Indian Creek extend through other parts of the east, and the elevation colors shift toward higher ridges. The farther east the comparison goes, the less the map is dominated by highlighted settlements and the more it is dominated by landform and drainage.
Even the western communities have distinct settings. Jasonville is close to the northwest lake cluster and the northern rural side of the county, whereas Lyons is southwest and nearer the broad southern lowlands and larger river system. Reading those local differences prevents the western half from being reduced to one featureless flat zone.
Use Linton and Bloomfield to connect settlement patterns with the Richland Creek terrain
For a first look, find Linton and Bloomfield on the general county map and use them as anchors for Jasonville, Worthington, Lyons, and Solsberry. The city view then makes the west-central concentration of the highlighted communities easier to see. When the comparison moves east of Bloomfield, the terrain-and-water and elevation views become more informative because the Richland Creek side is defined less by large highlighted settlements and more by repeated ridges and narrow drainage valleys.
The pair of physical maps is especially useful for comparing the White River and Eel River lowlands with the Richland Creek and Plummer Creek valleys. The water map supplies the names and drainage paths; the elevation map supplies the broader height pattern around them. That combination is useful for geographic understanding, but it is still not a substitute for current hazard mapping, parcel data, road-condition information, or survey-grade elevations.
The images embedded in this article are optimized for web viewing. For printing, classroom material, reports, or large-screen presentations, the high-resolution JPG originals preserve smaller labels and terrain colors more clearly. The ZIP contains separate JPG files corresponding to the general county map, city-distribution map, terrain-and-water map, and elevation map.
Frequently Asked Questions
Which map best shows the difference between western Greene County and the eastern ridges?
The elevation map shows the contrast most directly. Broad green lowlands dominate the Linton side and much of the center, while higher yellow, orange, and brown ridges become much more common toward Solsberry and Richland Creek. Pairing it with the terrain-and-water map also shows how Richland Creek and Plummer Creek occupy valleys between those ridges.
Is Linton or Bloomfield the better reference point for reading the county?
Linton is better for organizing the western side because it is a strong road hub and the first-ranked community on the supplied city index. Bloomfield is better for relating multiple directions because it lies nearer the center and connects naturally to Worthington, Solsberry, Newberry, and the central river corridors. Using both gives a clearer mental map than forcing one place to serve every purpose.
Does the 140–281 m range give the exact elevation of a house or parcel?
No. The range and the 181 m mean describe the countywide elevation information printed on the supplied map, while the colored surface is generalized for regional comparison. Property-specific or construction-grade elevation work should use USGS source data or a professional survey.
Map File Information
The ZIP contains the high-resolution JPG originals for the Greene County general map, city-distribution map, terrain-and-water map, and elevation map. Use the originals when the reduced web previews are not large enough for print or detailed viewing.
- File Type: ZIP containing 4 JPG files
Related Maps
Sources and References
Road, place, water, terrain, and elevation descriptions in this article are based primarily on the supplied Greene County map set. The following official and public resources provide additional county information, public-land context, and source elevation data.
- Indiana State Government – Greene County information
- Greene County Government – county departments
- Indiana DNR – Goose Pond Fish & Wildlife Area
- Indiana DNR – Greene-Sullivan State Forest
- USGS – 3D Elevation Program
Green Map creates custom-edited map images using open geographic data sources such as geoBoundaries, Natural Earth, OpenStreetMap, and government open data.
These maps are edited visual materials, not raw data files, and are provided for education, documents, presentations, and graphic reference.