The share of national income or consumption received by the lowest fifth of the distribution is a compact way to see how much of the total reaches people at the bottom of each country’s distribution. World Bank indicator SI.DST.FRST.20 reports that share as a percentage. The latest retained observation table used here contains 171 countries and areas, with values ranging from 2.8% to 10.8%. The unweighted median is 7.1% and the simple mean is about 7.00%.
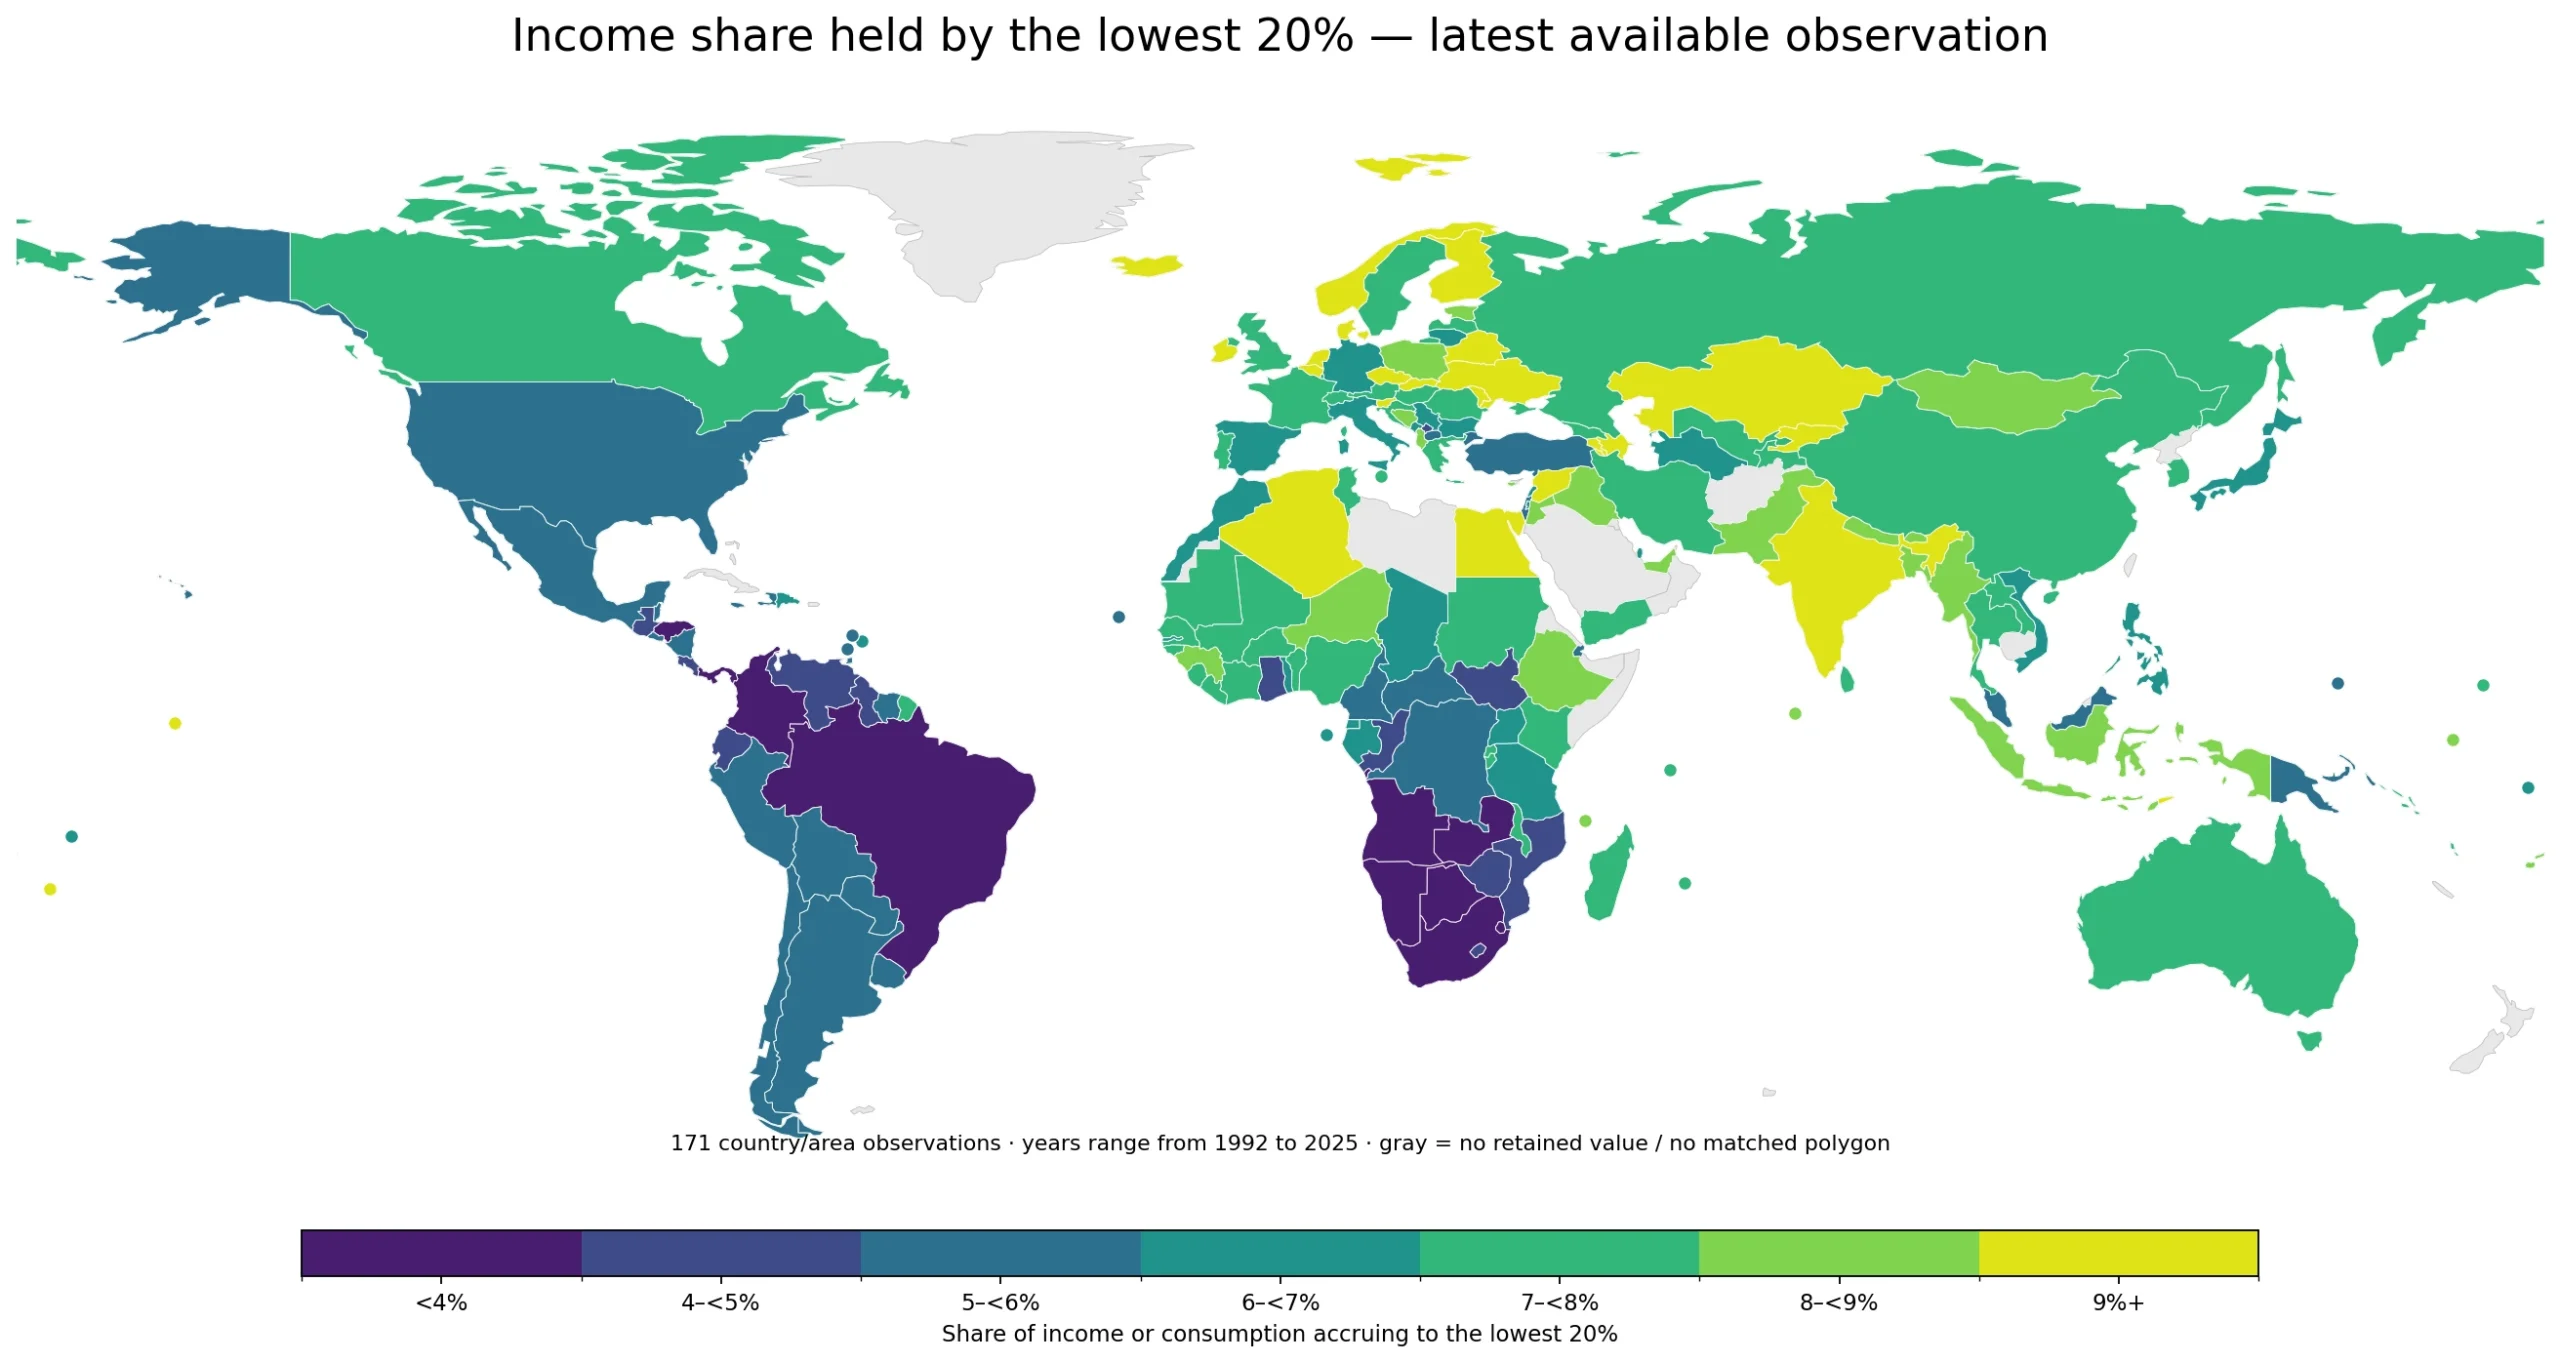
Table of Contents
What does the income share held by the lowest 20% measure?
The World Bank series SI.DST.FRST.20 is formally titled “Income share held by lowest 20%.” The metadata defines it as the percentage share of income or consumption accruing to a population subgroup defined by quintiles. In practical terms, a value of 8% means that the lowest fifth of the national distribution receives about 8% of the income or consumption total measured by the underlying household survey.
The lowest 20% is defined within each country. It is not the poorest 20% of the world population pooled into one global group. The welfare concept can also differ across national survey systems: some countries measure household income while others rely more heavily on consumption. The World Bank Poverty and Inequality Platform compiles primary household-survey information from government statistical agencies and World Bank country departments, with high-income economy data often drawing on the Luxembourg Income Study. Those differences make the observation year and survey context part of the statistic, not a footnote.
The latest-value median is 7.1%, but it is not a global income share
Giving each of the 171 country and area rows equal weight produces a median latest observation of 7.1%. The first quartile is 5.7% and the third quartile is 8.2%, while the simple mean is about 7.00%. These statistics summarize the cross-country rows in the retained table. They are not population weighted, they are not weighted by national income, and they do not imply that the poorest fifth of the world population receives 7% of global income.
| Share received by the lowest 20% | Countries/areas |
|---|---|
| Below 4% | 10 |
| 4% to under 5% | 12 |
| 5% to under 6% | 28 |
| 6% to under 7% | 27 |
| 7% to under 8% | 48 |
| 8% to under 9% | 22 |
| 9% or more | 24 |
The largest class is 7% to under 8%, containing 48 observations. Another 24 are at 9% or above, while 10 are below 4%. These bands are descriptive map classes, not World Bank policy thresholds or grades. A higher share means that a larger portion of the measured national income or consumption total accrues to the bottom quintile, but the number should not be turned into a one-dimensional score of a country’s economy or social policy.
The biggest limitation is the 1992–2025 spread in observation years
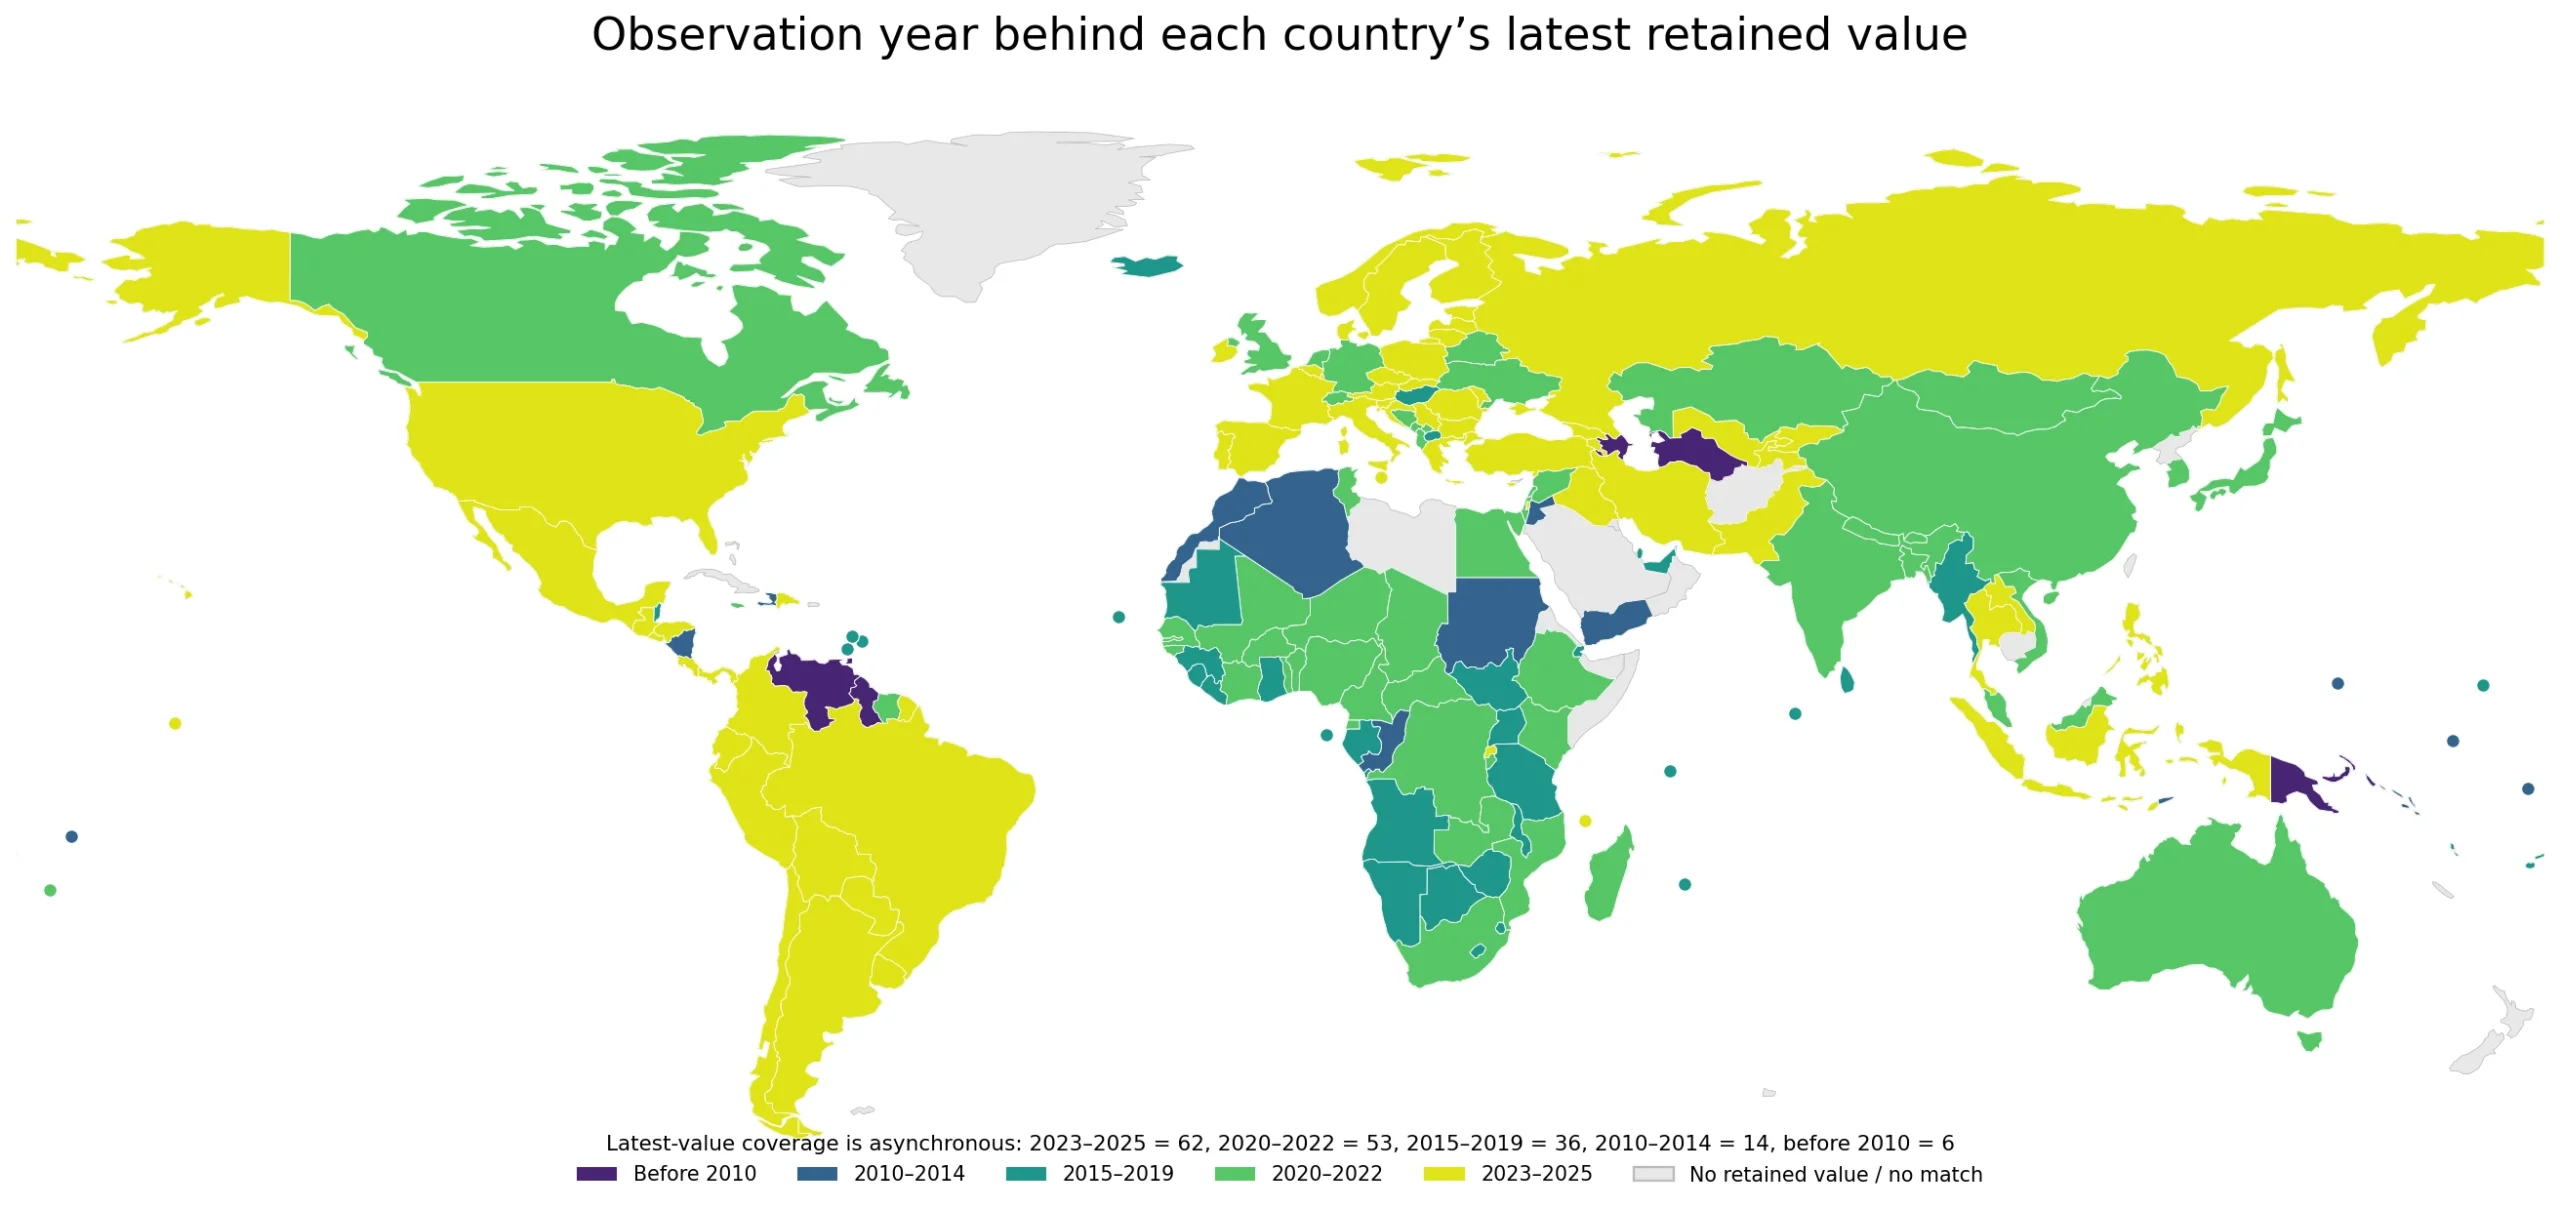
The opportunity metadata identifies 2025 as the newest year in the retained series, but the 171 rows are not a synchronized 2025 cross-section. Only four observations are dated 2025: Indonesia, Uzbekistan, Ecuador and Costa Rica. There are 21 rows from 2024 and 37 from 2023, while the oldest retained value dates to 1992. Calling all 171 values a “2025 country ranking” would therefore attach the newest year in the file to observations measured much earlier.
| Observation-year group | Countries/areas |
|---|---|
| 2023–2025 | 62 |
| 2020–2022 | 53 |
| 2015–2019 | 36 |
| 2010–2014 | 14 |
| Before 2010 | 6 |
A total of 115 observations, about 67% of the file, are dated 2020 or later. Only 62, about 36%, are from 2023–2025. Twenty observations are older than 2015. Keeping older rows preserves geographic coverage, but it also means that the first map must be read as a latest-available-value map rather than a current synchronized comparison. The reference-year map below makes that timing visible.
The highest and lowest retained values need their years attached
The largest retained value in the 171-row table is Azerbaijan at 10.8%, but that observation is from 2005. India is 10.4% in 2022, Belarus 10.3% in 2020, Kiribati 10.2% in 2023, and Slovenia 10.0% in 2023. At the lower end, Namibia is 2.8% in 2015, Colombia 3.2% in 2024, Panama 3.6% in 2024, Honduras 3.7% in 2024, and South Africa 3.7% in 2022.
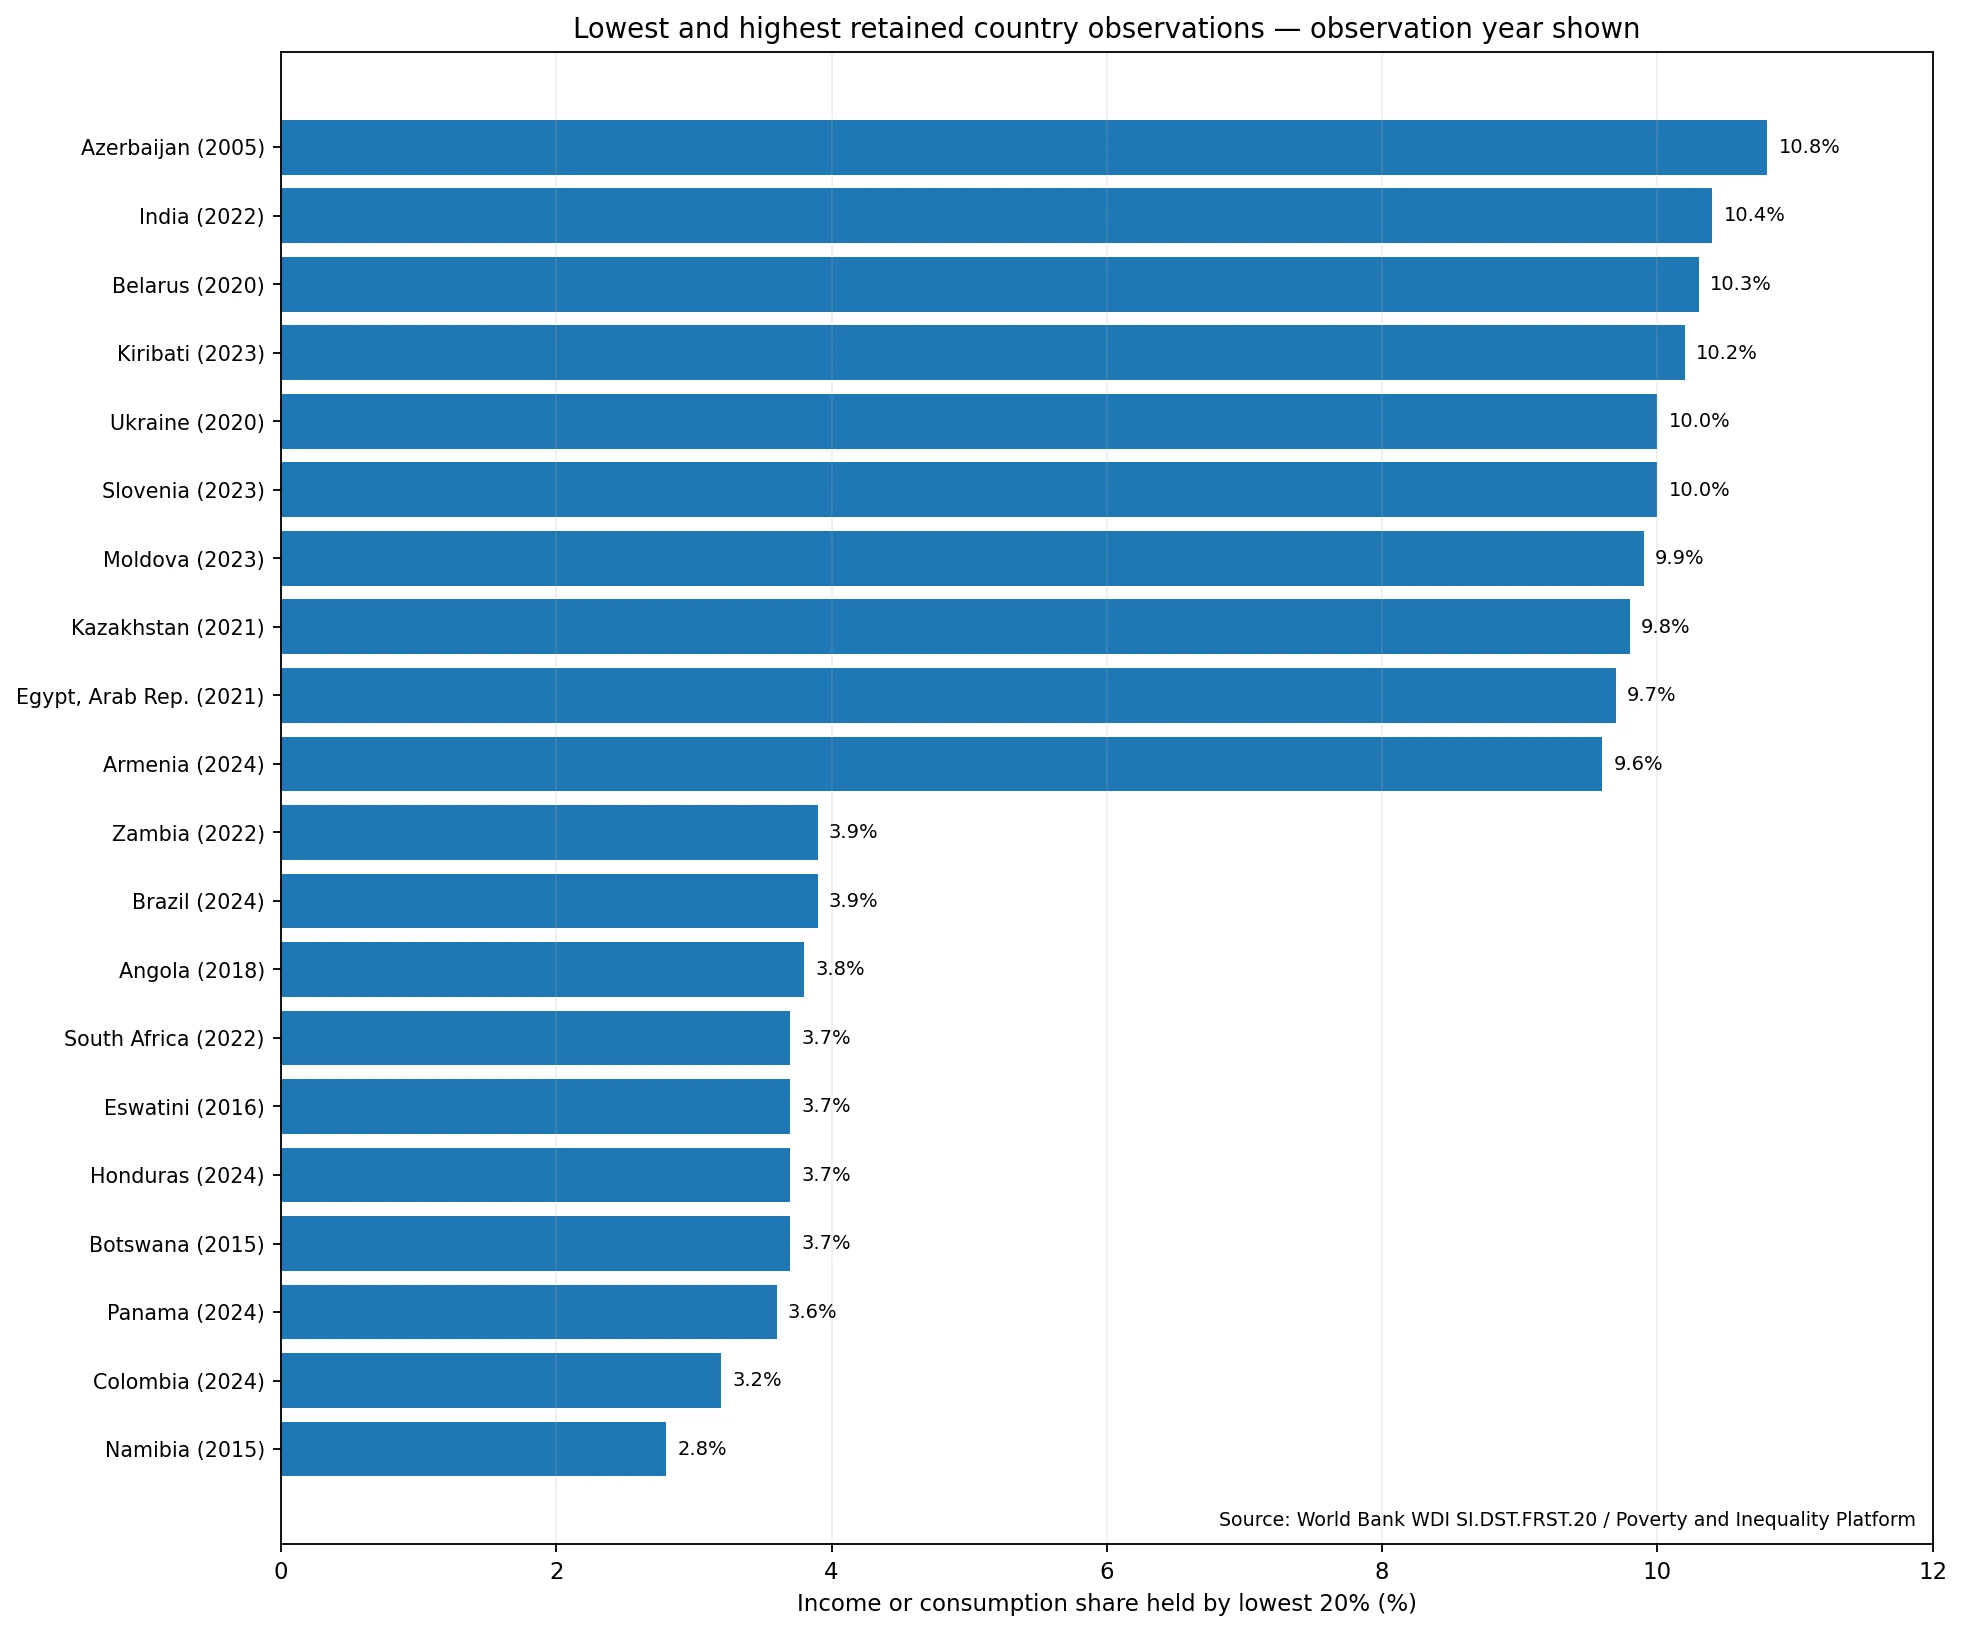
This is why a value such as Azerbaijan’s 2005 observation should not be compared with Colombia’s 2024 observation as though both described the same economic moment. Restricting attention to the 62 observations dated 2023–2025 reduces, but does not eliminate, timing differences. Within that recent group, Kiribati is 10.2% in 2023, Slovenia 10.0% in 2023, Moldova 9.9% in 2023, and Armenia and the Kyrgyz Republic are both 9.6% in 2024. Colombia is 3.2% in 2024, Panama 3.6%, Honduras 3.7%, Brazil 3.9%, Guatemala 4.6% in 2023, Costa Rica 4.7% in 2025 and Ecuador 4.8% in 2025.
Recent observations show large differences within Europe and a lower cluster across much of Latin America
Among observations dated 2023–2025, Europe contains some of the higher shares in the file but is far from uniform. Slovenia is 10.0%, Moldova 9.9%, Czechia 9.5%, Ireland and Finland 9.2%, and Norway, Denmark and Belgium 9.1%. Spain is 6.5%, Italy 6.6% and Bulgaria 6.0%. The regional pattern is therefore not a simple Europe-versus-rest divide; substantial differences remain among neighboring and nearby countries.
Latin America contains several of the lower recent observations: Colombia 3.2%, Panama 3.6%, Honduras 3.7%, Brazil 3.9%, Guatemala 4.6%, Costa Rica 4.7%, Ecuador 4.8% and Argentina 5.1%. Uruguay is 5.7%, Chile 5.8% and the Dominican Republic 6.1%, showing variation within the region as well. These patterns identify where the bottom quintile’s share differs, but the indicator alone cannot establish which tax, labor-market, transfer or demographic factor caused those differences.
Major economies illustrate why the observation year matters
The latest retained value for Korea, Rep. is 7.4% in 2021. Japan is 6.8% in 2020, China 7.3% in 2022, the United States 5.1% in 2024 and Canada 7.7% in 2022. Because the years differ, those figures are best used as broad reference points rather than as a decimal-place ranking. Each one describes the bottom quintile’s share at its own survey date.
A higher bottom-quintile share is not the same as higher absolute living standards
A larger share means that the bottom fifth receives a larger portion of the national income or consumption total measured by the survey. That can be consistent with a less concentrated distribution at the bottom, but it does not fully describe overall inequality. The distribution within the remaining 80% can differ sharply, and the shares accruing to the top 10%, top 1% or middle groups are not contained in this one series. A Gini coefficient or a fuller set of quantile shares answers a broader distributional question.
The indicator also says nothing directly about the absolute size of the income or consumption “pie.” A low-income country in which the bottom quintile receives 9% does not necessarily provide a higher absolute standard of living to that group than a high-income country in which the bottom quintile receives 5%. Poverty rates, real income or consumption per person, purchasing power and prices are separate dimensions. This series is most useful for the relative share question: how much of the measured total accrues to the lowest fifth within each country?
Source and calculation method
The statistical source is World Bank World Development Indicators series SI.DST.FRST.20, with underlying survey information compiled through the World Bank Poverty and Inequality Platform. The World Bank metadata states that the values are based on primary household survey data obtained from government statistical agencies and World Bank country departments. It also notes that percentage shares by quintile can fail to sum to exactly 100 because of rounding.
All medians, means, quartiles, class counts, year counts and country examples on this page are calculated from the 171 latest non-missing country and area observations in the supplied series. Missing values are not replaced with zero. ISO-3 country codes are joined to a low-resolution world boundary layer: 154 observations are shown as filled polygons and 17 small countries or areas without a distinct polygon at that scale are added as points, so every statistical row is represented visually. Because the observation years vary widely, value, year and geographic pattern should be read together rather than converted into a current league table.
Frequently Asked Questions
What does income share held by the lowest 20% mean?
It is the percentage of a country’s measured income or consumption total that accrues to the lowest fifth of the national distribution.
Can the 171 observations be treated as a 2025 country ranking?
No. The retained observation years range from 1992 to 2025, and only four rows are dated 2025. Each value should be read together with its survey year.
Does a higher bottom-20% share mean poverty is lower?
Not necessarily. The indicator measures a relative share of income or consumption, not the absolute living standard or poverty rate of the bottom quintile.
Why does the indicator refer to income or consumption?
National household-survey systems can use different welfare concepts. Some countries measure income while others rely more on consumption, so the survey basis matters for cross-country interpretation.
Related Articles
- Bottom 40% real income or consumption growth
- Real consumption or income growth per capita
- World Bank multidimensional poverty rate by country
Green Map creates custom-edited map images using open geographic data sources such as geoBoundaries, Natural Earth, OpenStreetMap, and government open data.
These maps are edited visual materials, not raw data files, and are provided for education, documents, presentations, and graphic reference.