How much of government revenue comes from taxes on personal income, business profits, and capital gains? World Bank series GC.TAX.YPKG.RV.ZS provides a country-level fiscal composition measure by expressing that tax category as a percentage of government revenue. It is not a statutory personal-income-tax rate, a corporate tax rate, or a measure of the total tax burden on an economy. It describes the mix of recorded government revenue.
The latest non-null table contains 159 countries and economies, but the reference years range from 1979 to 2024. Only 88 observations are dated 2024, while the remaining 71 are older. The first map therefore shows each economy’s latest retained observation rather than a synchronized 2024 ranking. The 88 observations actually dated 2024 are separated later for cleaner same-year comparisons.
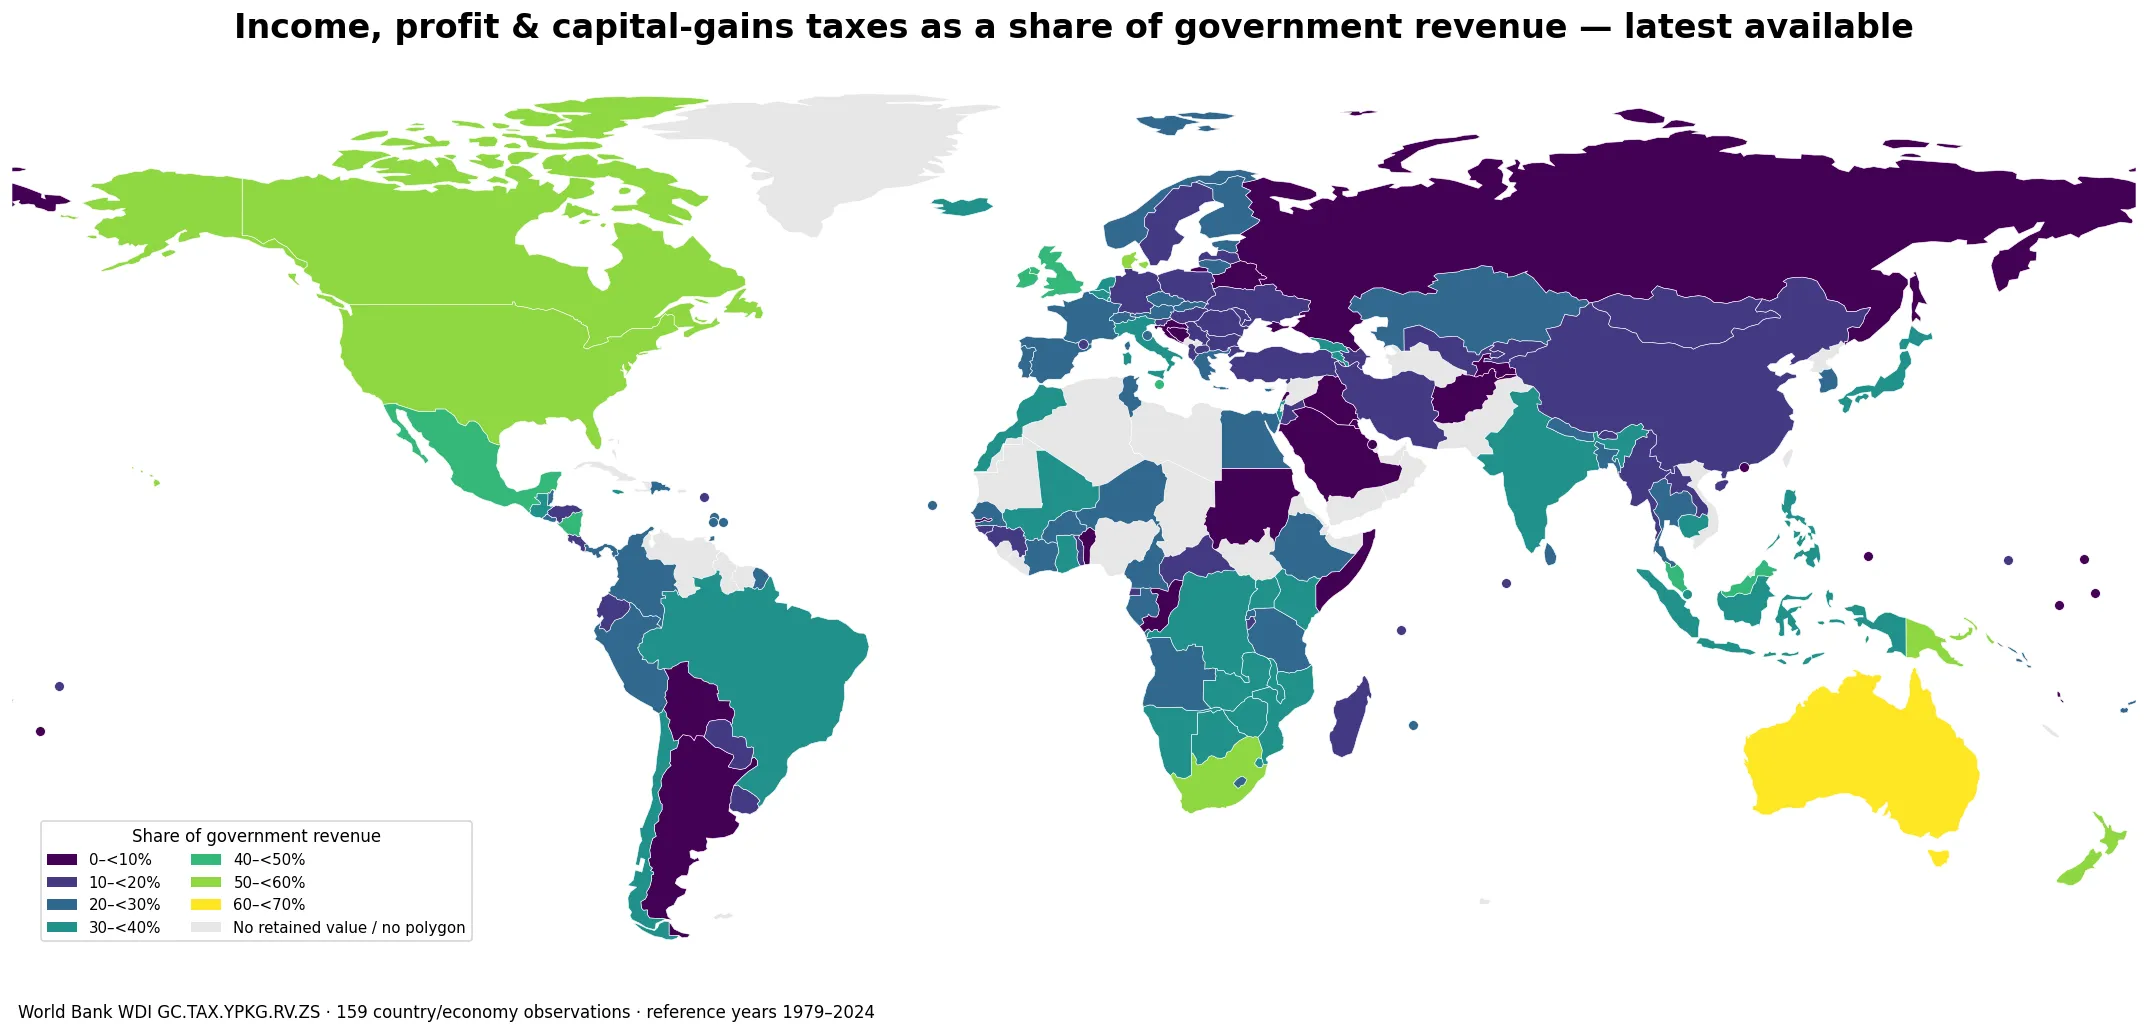
Table of Contents
The denominator is government revenue, not total tax revenue
The World Bank definition covers taxes payable on actual or presumed incomes, profits and capital gains. The denominator, revenue, is broader than taxes alone: the metadata describes it as transactions that add to the economic value of a government unit or sector. That makes GC.TAX.YPKG.RV.ZS different from the related indicator GC.TAX.YPKG.ZS, which uses total taxes as the denominator. Confusing the two can materially change the interpretation.
A 40% observation does not mean that households or companies face a 40% tax rate. It means the recorded income-, profit- and capital-gains-tax category is equivalent to 40% of the government revenue measure used in the fiscal statistics. Social contributions, fees, property income and other revenue sources can affect the denominator. Statutory rates, deductions, exemptions, effective tax rates and tax compliance require different datasets.
Latest available does not mean the same year: the observations span 1979–2024
The age of the retained observations varies sharply. There are 88 rows dated 2024, 21 dated 2023, 8 dated 2022, 10 dated 2021 and 10 dated 2020. The rest are older. Benin’s retained observation is from 1979, Niger’s from 1980, The Gambia’s from 1990, Guinea’s from 1992 and Japan’s from 1993. Those older values remain valid historical observations, but they should not be presented as current fiscal structures.
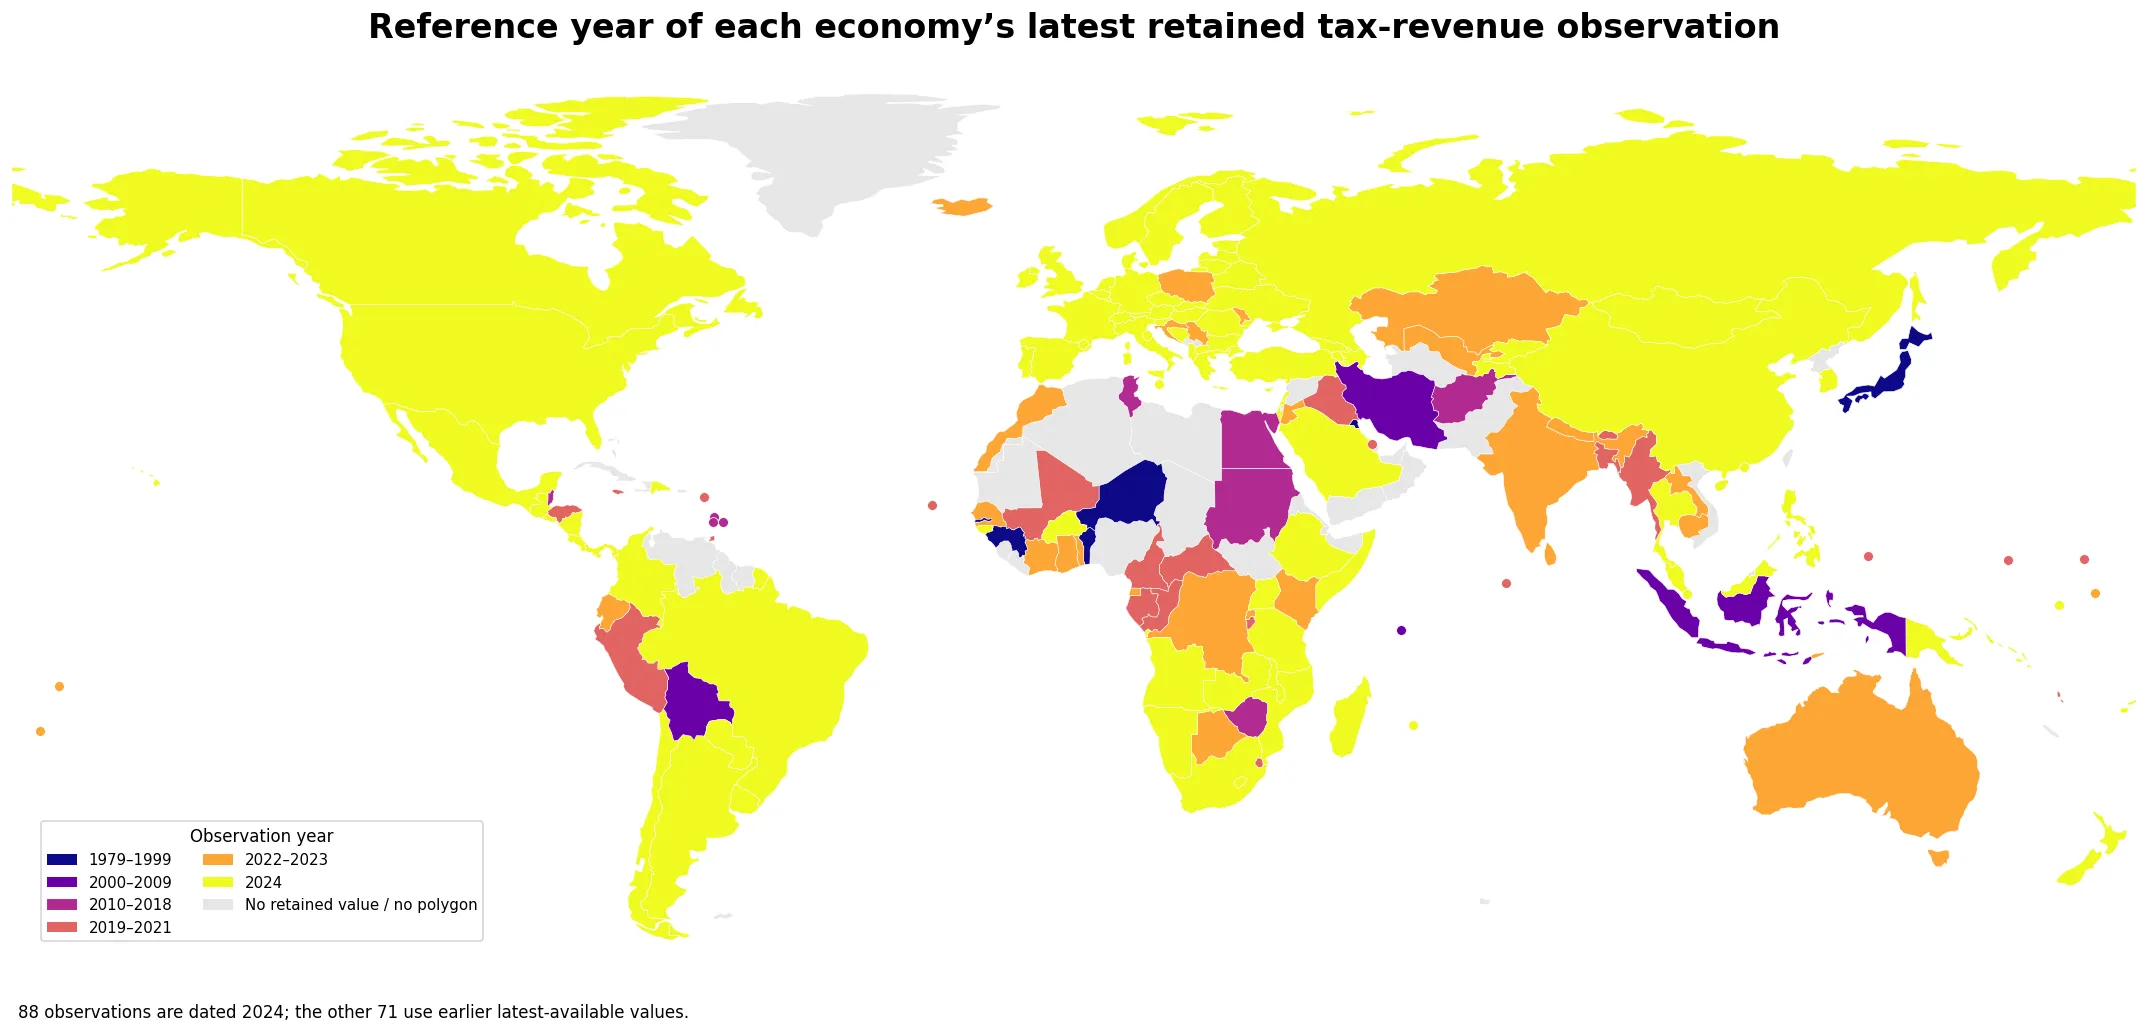
Across all 159 latest observations, the unweighted median is 22.70% and the simple mean is 24.09%. Those are distribution summaries of a mixed-year table, not a 2024 world tax ratio and not a revenue-weighted global aggregate. The year map is therefore as important as the value map whenever a country’s latest observation is used in a comparison.
The synchronized 2024 subset has a median of 25.58%
Limiting the analysis to the 88 observations actually dated 2024 produces an unweighted median of 25.58% and a simple mean of 26.59%. The middle half of the observations lies between 17.72% and 35.08%. The same-year minimum is 2.51% and the maximum is 59.37%. These statistics give every country or economy one observation; they do not weight countries by population, GDP or the amount of government revenue collected.
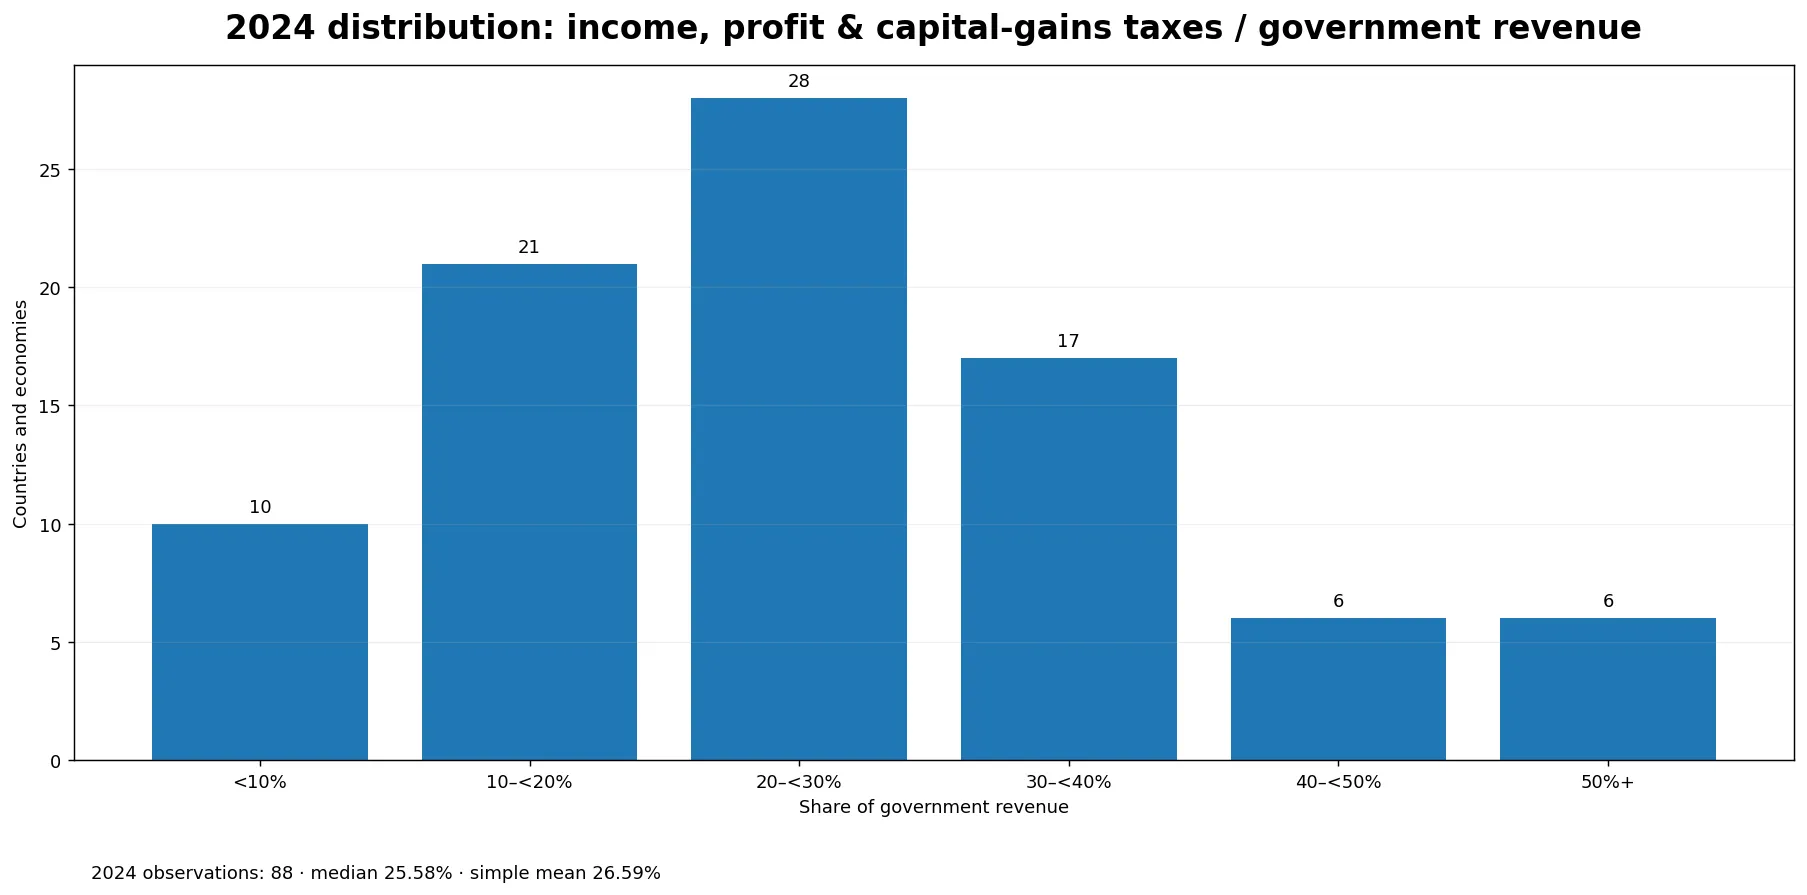
The 2024 distribution contains 10 observations below 10%, 21 from 10% to below 20%, 28 from 20% to below 30%, 17 from 30% to below 40%, 6 from 40% to below 50%, and 6 at 50% or more. The largest band is 20% to below 30%. Only six observations are at least 50%, so the very high values visible on the map form a relatively small upper tail.
Papua New Guinea, New Zealand, the United States and Canada are highest in the 2024 set
Papua New Guinea records 59.37% in 2024, followed by New Zealand at 56.70%, the United States at 56.31%, Canada at 53.91%, Denmark at 51.44% and South Africa at 50.84%. Malaysia is 47.56%, Ireland 45.15%, Malta 41.73% and Nicaragua 41.34%. The list spans several continents, which is an early warning against treating this fiscal structure as a simple high-income/low-income or regional ranking.
| Rank | Country or economy | 2024 share of government revenue |
|---|---|---|
| 1 | Papua New Guinea | 59.37% |
| 2 | New Zealand | 56.70% |
| 3 | United States | 56.31% |
| 4 | Canada | 53.91% |
| 5 | Denmark | 51.44% |
| 6 | South Africa | 50.84% |
| 7 | Malaysia | 47.56% |
| 8 | Ireland | 45.15% |
| 9 | Malta | 41.73% |
| 10 | Nicaragua | 41.34% |
A high value is descriptive rather than evaluative. It says this tax category accounts for a large share of the reported government revenue measure. It does not say whether the tax system is more efficient, more progressive, more competitive or more burdensome. Countries can reach similar percentages through very different mixes of personal income tax, corporate profit taxation, capital-gains taxation and non-tax revenue.
Low 2024 shares are not the same thing as low statutory tax rates
At the low end of the 2024 subset, Saudi Arabia is at 2.51%, Belarus 3.05%, Somalia 3.96%, the Russian Federation 4.62%, Tajikistan 7.74%, Lebanon 7.84%, Macao 8.55%, Nauru 8.74%, Argentina 9.08%, and Bosnia and Herzegovina 9.95%. These values describe a composition ratio. A low number can arise when other taxes, social contributions, resource-related receipts, fees, property income or other revenues occupy a larger share of the denominator.
| Lowest first | Country or economy | 2024 share of government revenue |
|---|---|---|
| 1 | Saudi Arabia | 2.51% |
| 2 | Belarus | 3.05% |
| 3 | Somalia, Fed. Rep. | 3.96% |
| 4 | Russian Federation | 4.62% |
| 5 | Tajikistan | 7.74% |
| 6 | Lebanon | 7.84% |
| 7 | Macao SAR, China | 8.55% |
| 8 | Naoero | 8.74% |
| 9 | Argentina | 9.08% |
| 10 | Bosnia and Herzegovina | 9.95% |
The numerator and denominator should therefore be examined separately before drawing conclusions. A country can collect substantial income or profit taxes in absolute terms and still have a low ratio if other government revenue is even larger. The opposite can also occur: a relatively modest tax amount can make up a large percentage of revenue if other revenue sources are small.
Nearby countries can sit in very different bands
Europe shows wide variation in the same 2024 reference year: Denmark is at 51.44%, the United Kingdom 40.58%, Italy 34.70% and France 29.10%, while Germany is 16.49% and Belarus 3.05%. In North America, the United States and Canada are above 50%, but Costa Rica is 15.31%. In South America, Brazil is 34.18% and Chile 31.79%, compared with Argentina at 9.08%. Fiscal revenue mixes can differ sharply even among neighboring economies.
Using the 2024 observations only, the unweighted continental medians are 33.94% for North America, 28.98% for Africa, 27.76% for Oceania, 21.91% for Asia, 21.90% for Europe and 21.46% for South America. These are descriptive summaries of the countries present in the 88-row subset, not official continent-wide fiscal ratios. Coverage varies from five to 35 observations by continent.
Major economies illustrate why the reference year must travel with the value
Among 2024 observations, the United States is at 56.31%, Canada 53.91%, Mexico 41.32%, Brazil 34.18%, the United Kingdom 40.58%, France 29.10%, Italy 34.70%, Germany 16.49%, China 17.46%, the Russian Federation 4.62% and South Africa 50.84%. Korea, Rep. is 27.55% in the same 2024 set. India’s retained value is 34.83% from 2022, Australia’s is 67.86% from 2022, Indonesia’s is 37.42% from 2009 and Japan’s is 35.02% from 1993, so those four should not be inserted into a strict 2024 ranking.
| Country or economy | Latest reference year | Share of government revenue |
|---|---|---|
| United States | 2024 | 56.31% |
| Canada | 2024 | 53.91% |
| Mexico | 2024 | 41.32% |
| Brazil | 2024 | 34.18% |
| United Kingdom | 2024 | 40.58% |
| France | 2024 | 29.10% |
| Germany | 2024 | 16.49% |
| Italy | 2024 | 34.70% |
| Spain | 2024 | 21.98% |
| Denmark | 2024 | 51.44% |
| Korea, Rep. | 2024 | 27.55% |
| China | 2024 | 17.46% |
| India | 2022 | 34.83% |
| Japan | 1993 | 35.02% |
| Indonesia | 2009 | 37.42% |
| Malaysia | 2024 | 47.56% |
| Singapore | 2024 | 39.00% |
| Saudi Arabia | 2024 | 2.51% |
| Russian Federation | 2024 | 4.62% |
| South Africa | 2024 | 50.84% |
| Australia | 2022 | 67.86% |
| New Zealand | 2024 | 56.70% |
For economies with very old retained values, the table is best treated as a historical data-availability note. A present-day analysis should check whether newer observations have been released through the World Bank indicator page, IMF Government Finance Statistics, or national fiscal publications before using an old latest value to characterize current tax structure.
This ratio cannot grade the quality of a tax system
The indicator answers a narrow accounting question: what fraction of recorded government revenue is represented by taxes on income, profits and capital gains? It does not measure tax fairness, administrative efficiency, economic growth effects, compliance, progressivity or the distribution of the burden between households and companies. It also combines several related tax bases into one category, so two countries with the same percentage can have very different internal tax structures.
A broader fiscal assessment would add tax revenue relative to GDP, social contributions, consumption and property taxes, total government revenue, expenditure, fiscal balance and debt. A burden analysis would need statutory and effective rates, tax bases, deductions, exemptions and income distribution. Used on its own, GC.TAX.YPKG.RV.ZS is best understood as one map of revenue composition rather than a scorecard.
Cross-country comparability also depends on government coverage and reporting practice
World Bank metadata identifies the IMF Government Finance Statistics Yearbook and data files as the underlying source. It also cautions that government-finance coverage is not identical across countries. Many countries consolidate central-government accounts, while others may report budgetary central government only. In federal systems, central-government accounts may provide an incomplete picture of total public finance, and social-security funds or other government units may not always be included in the same way.
The World Bank further notes that government revenue and expense statistics can be incomplete, untimely and not fully comparable even though the IMF uses international Government Finance Statistics standards. These limitations do not make the data useless; they define how it should be used. Large structural differences and broad bands are more defensible than treating a tenth of a percentage point as a precise cross-country ranking.
Source and mapping method
The indicator definition comes from the World Bank World Development Indicators metadata for GC.TAX.YPKG.RV.ZS. The World Bank describes it as taxes on income, profits and capital gains expressed as a percentage of revenue and identifies IMF Government Finance Statistics as the source. Country values can be checked on the World Bank Data indicator page.
All calculations use the 159 validated country and economy rows without replacing missing data with zero. The low-resolution Natural Earth boundary layer directly represents 138 of the statistical rows; 21 small countries and economies without separate polygons at this scale are displayed with representative point markers. The synchronized distribution, rankings and country-band comparisons use only the 88 observations actually dated 2024. Means and medians are simple unweighted country summaries.
Frequently Asked Questions
Is this percentage a personal income-tax rate?
No. It is the share of government revenue represented by recorded taxes on income, profits and capital gains. It is not a statutory personal or corporate tax rate.
Can all 159 observations be ranked as if they were from 2024?
No. Only 88 observations are dated 2024. The other 71 are earlier latest-available values, so the 88-row 2024 subset is the cleaner same-year comparison.
Is percent of revenue the same as percent of total taxes?
No. Government revenue is the denominator here. The World Bank publishes a separate indicator that expresses the same tax category as a share of total taxes.
Does a higher share mean a better tax system?
No. The ratio describes revenue composition. It does not directly measure fairness, efficiency, progressivity, compliance, growth effects or the burden on taxpayers.
Related Articles
- How much of GDP is government final consumption? (2025)
- Government health spending as a share of GDP (2023)
- Domestic government share of current health expenditure by country
Green Map creates custom-edited map images using open geographic data sources such as geoBoundaries, Natural Earth, OpenStreetMap, and government open data.
These maps are edited visual materials, not raw data files, and are provided for education, documents, presentations, and graphic reference.