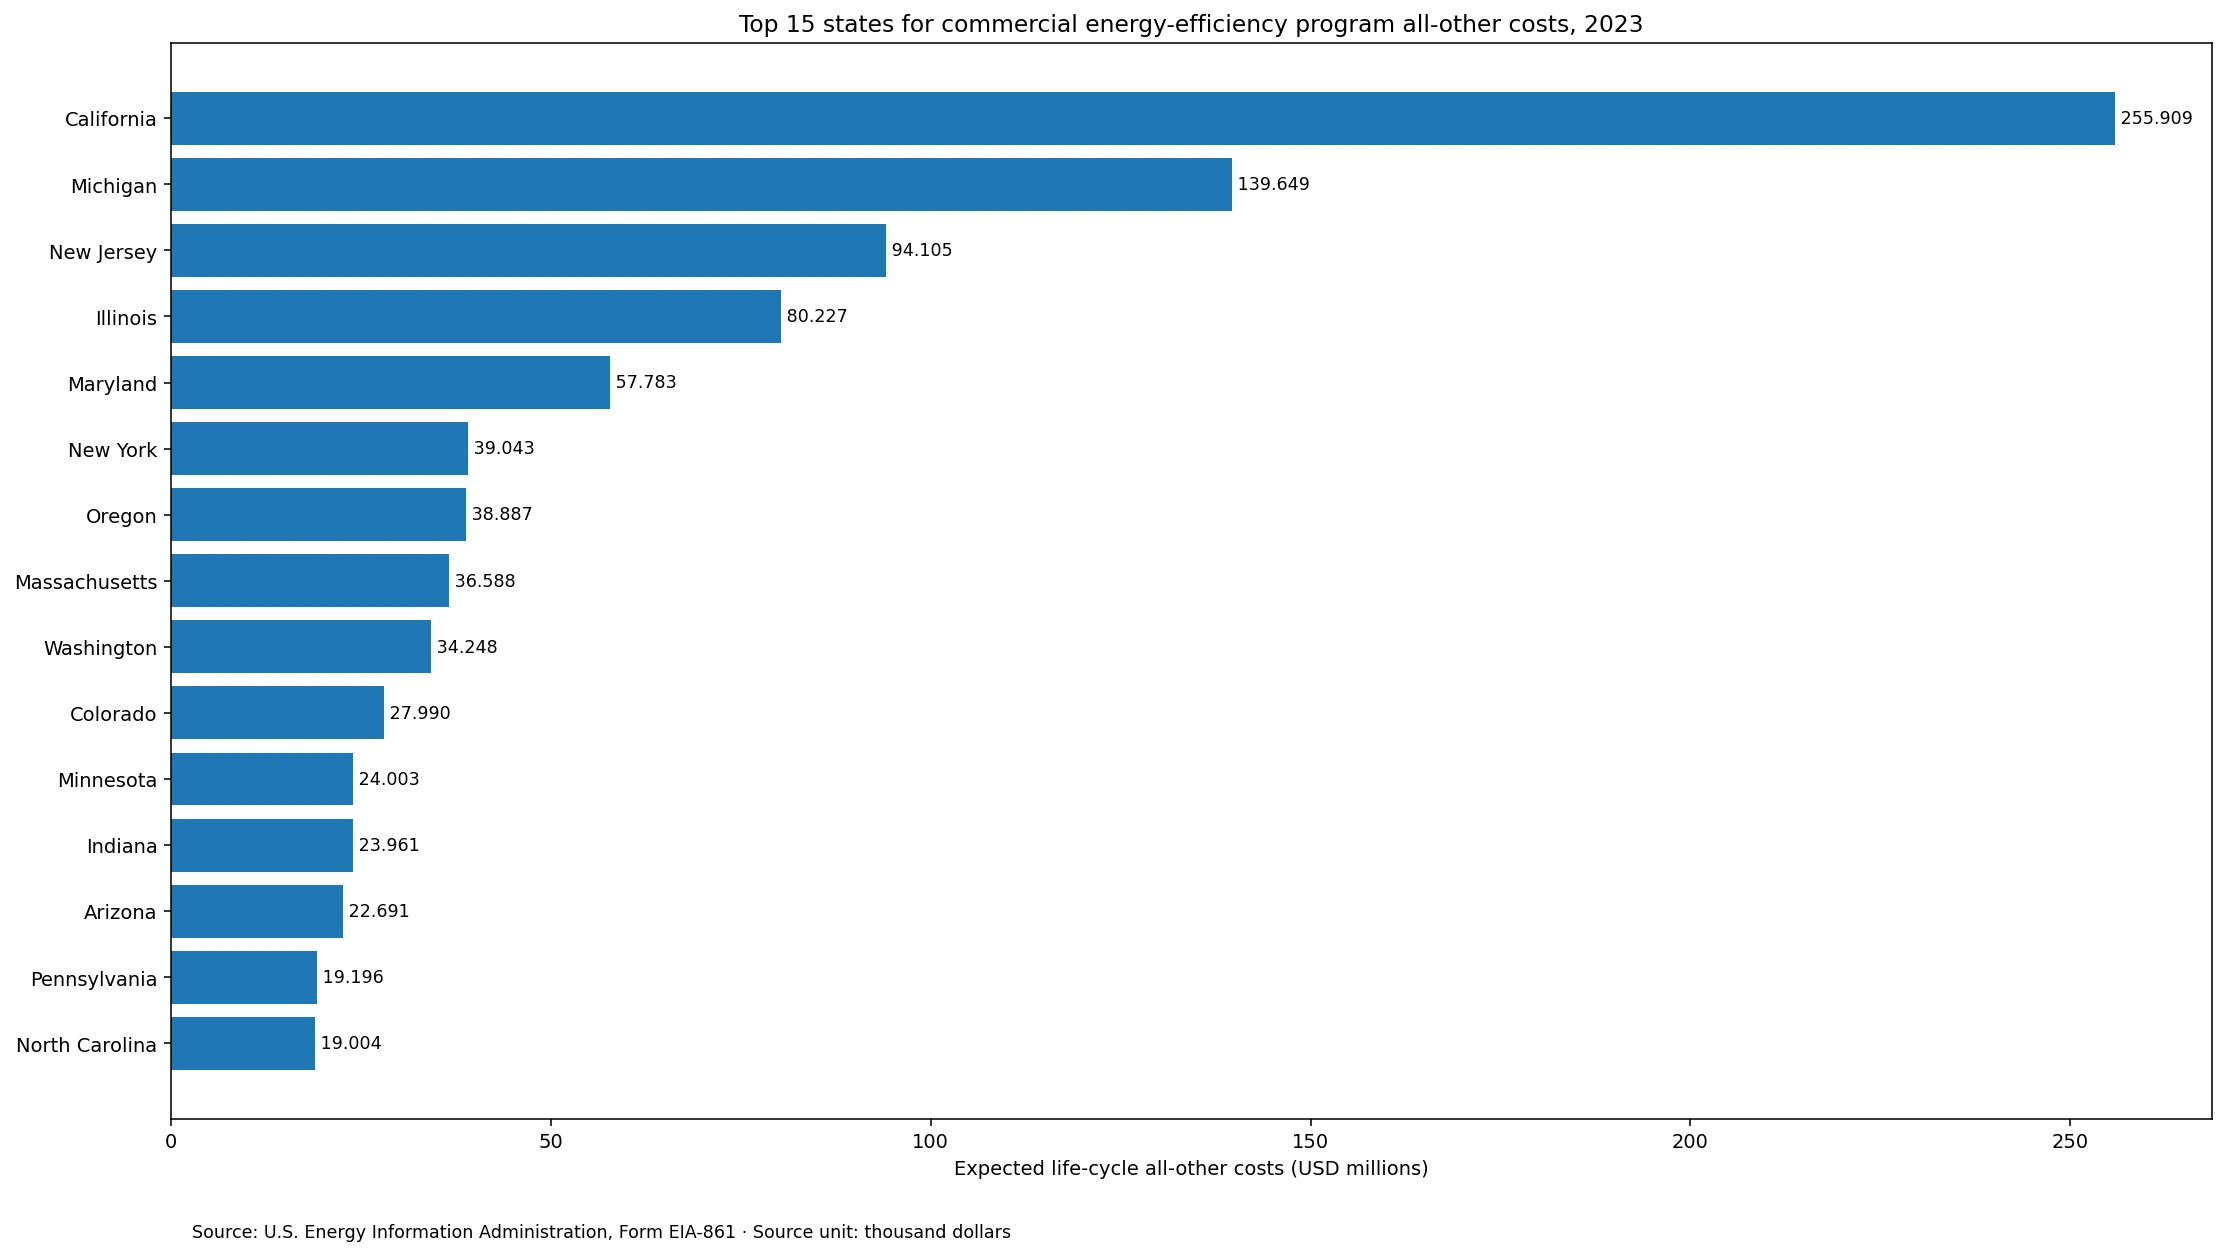
Commercial-sector energy-efficiency program costs outside the customer-incentive category vary sharply across U.S. states in the 2023 EIA data. With the U.S. Energy Information Administration State Electricity Profiles filtered to Commercial + Expected Life Cycle of Programs + All Other Costs, California is highest at $255.909 million. Michigan follows at $139.649 million and New Jersey at $94.105 million. The 50 states and the District of Columbia sum to $1124.053 million.
The field should not be interpreted as electricity bills paid by offices, stores, schools, hospitals, or other commercial customers. In the EIA-861 energy-efficiency framework, customer incentives and all-other costs are reported as separate program-cost categories. This series covers the costs outside the direct customer-incentive category. The time-period facet is Expected Life Cycle of Programs, so it also should not be restated as a simple cash-spending total for calendar year 2023.
Table of Contents
California leads at $255.909 million
California contributes 22.8% of the 51-jurisdiction state sum. Michigan contributes 12.4% and New Jersey 8.4%. The top three together total $489.663 million, or 43.6% of the sum.
Illinois ranks fourth at $80.227 million and Maryland fifth at $57.783 million. The top five account for 55.8% of the state sum, the top ten for 71.6%, and the top fifteen for 81.2%. The distribution is therefore concentrated in a relatively small upper group rather than spread evenly across the 51 jurisdictions.
The $22.040 million mean is well above the $8.775 million median
The arithmetic mean is $22.040 million, while the median is $8.775 million. The mean is about 2.5 times the median because the largest states pull the average upward. The first quartile is $3.267 million and the third quartile is $20.944 million. For this skewed series, the median and concentration shares describe the middle of the distribution more clearly than the mean alone.
| All-other-cost band | Jurisdictions |
|---|---|
| $0 | 3 |
| Over $0 to $0.1 million | 1 |
| Over $0.1 to $0.5 million | 4 |
| Over $0.5 to $1 million | 2 |
| Over $1 to $5 million | 8 |
| Over $5 to $10 million | 11 |
| Over $10 to $20 million | 9 |
| Over $20 to $50 million | 8 |
| Over $50 million | 5 |
Three jurisdictions report exactly $0: Alaska, Kansas, and West Virginia. All 51 rows contain numeric values, so those zeroes are not missing observations. 10 jurisdictions are at or below $1 million, while 22 exceed $10 million and 5 exceed $50 million. A zero in this one commercial-sector cost field should not be expanded into the claim that a state had no energy-efficiency programs or no other EIA efficiency activity.
Complete 2023 ranking for all 51 jurisdictions
The table below sorts the 2023 Commercial + Expected Life Cycle of Programs + All Other Costs observations from highest to lowest. Shares use the internally consistent 51-row sum of $1124.053 million as the denominator. The source unit is thousand dollars; displayed values are converted to USD millions.
| Rank | State or jurisdiction | Expected life-cycle all-other costs (USD millions) | Share of 51-row sum |
|---|---|---|---|
| 1 | California (CA) | 255.909 | 22.8% |
| 2 | Michigan (MI) | 139.649 | 12.4% |
| 3 | New Jersey (NJ) | 94.105 | 8.4% |
| 4 | Illinois (IL) | 80.227 | 7.1% |
| 5 | Maryland (MD) | 57.783 | 5.1% |
| 6 | New York (NY) | 39.043 | 3.5% |
| 7 | Oregon (OR) | 38.887 | 3.5% |
| 8 | Massachusetts (MA) | 36.588 | 3.3% |
| 9 | Washington (WA) | 34.248 | 3.0% |
| 10 | Colorado (CO) | 27.990 | 2.5% |
| 11 | Minnesota (MN) | 24.003 | 2.1% |
| 12 | Indiana (IN) | 23.961 | 2.1% |
| 13 | Arizona (AZ) | 22.691 | 2.0% |
| 14 | Pennsylvania (PA) | 19.196 | 1.7% |
| 15 | North Carolina (NC) | 19.004 | 1.7% |
| 16 | Connecticut (CT) | 15.665 | 1.4% |
| 17 | Virginia (VA) | 15.537 | 1.4% |
| 18 | Utah (UT) | 13.603 | 1.2% |
| 19 | Wisconsin (WI) | 13.307 | 1.2% |
| 20 | Georgia (GA) | 12.893 | 1.1% |
| 21 | Vermont (VT) | 12.206 | 1.1% |
| 22 | Nevada (NV) | 11.667 | 1.0% |
| 23 | South Carolina (SC) | 9.738 | 0.9% |
| 24 | Missouri (MO) | 9.279 | 0.8% |
| 25 | Oklahoma (OK) | 8.915 | 0.8% |
| 26 | New Mexico (NM) | 8.775 | 0.8% |
| 27 | Arkansas (AR) | 8.458 | 0.8% |
| 28 | Louisiana (LA) | 7.907 | 0.7% |
| 29 | Florida (FL) | 7.093 | 0.6% |
| 30 | Texas (TX) | 6.817 | 0.6% |
| 31 | Idaho (ID) | 6.394 | 0.6% |
| 32 | Rhode Island (RI) | 6.306 | 0.6% |
| 33 | Iowa (IA) | 5.257 | 0.5% |
| 34 | Hawaii (HI) | 4.946 | 0.4% |
| 35 | New Hampshire (NH) | 4.348 | 0.4% |
| 36 | District of Columbia (DC) | 3.731 | 0.3% |
| 37 | Montana (MT) | 3.489 | 0.3% |
| 38 | Maine (ME) | 3.379 | 0.3% |
| 39 | Wyoming (WY) | 3.155 | 0.3% |
| 40 | Mississippi (MS) | 3.104 | 0.3% |
| 41 | Tennessee (TN) | 2.354 | 0.2% |
| 42 | Kentucky (KY) | 0.829 | 0.1% |
| 43 | Ohio (OH) | 0.506 | 0.0% |
| 44 | Nebraska (NE) | 0.457 | 0.0% |
| 45 | Alabama (AL) | 0.313 | 0.0% |
| 46 | South Dakota (SD) | 0.181 | 0.0% |
| 47 | Delaware (DE) | 0.142 | 0.0% |
| 48 | North Dakota (ND) | 0.018 | 0.0% |
| 49 | Alaska (AK) | 0.000 | 0.0% |
| 50 | Kansas (KS) | 0.000 | 0.0% |
| 51 | West Virginia (WV) | 0.000 | 0.0% |
The national table and the state sum differ by 15.8%
EIA Electric Power Annual Table 10.2 reports $1335.146 million for 2023 Commercial Life Cycle Costs – All Other Costs. The direct sum of the 50 states and the District of Columbia in the State Electricity Profiles is $1124.053 million. The difference is $211.093 million, or about 15.8% of the national table value. The state sum is about 84.2% of that national figure.
That gap is much larger than a rounding difference, and the supplied state series plus the national table do not establish the reason for it. The analysis therefore does not allocate the difference back to individual states or force the state values to reproduce the national total. All state rankings, averages, medians, and shares in this article use the same 51-row state series; the national table is presented as a separate official reference.
Customer incentives and all-other costs are separate program-cost categories
In the same national EIA table, 2023 commercial life-cycle customer incentives are $2125.178 million, compared with $1335.146 million of all-other costs. The two fields belong to the same broader energy-efficiency reporting framework but describe different cost flows. Customer incentives are tied to value provided directly to participating customers; the all-other-cost field covers program costs outside that category.
A state with high all-other costs therefore cannot automatically be described as having high customer rebates or incentives. The reverse is also true. A broader total-cost analysis could combine the categories when definitions and periods are matched, but the components should remain visible because they answer different questions.
Life-cycle cost is not the same as cash spent only during 2023
Form EIA-861 distinguishes reporting-year measures from expected life-cycle measures. Because this state series uses Expected Life Cycle of Programs, the values should not be presented as a simple accounting total of cash spent in calendar year 2023. Questions about actual one-year spending require the reporting-year cost series or more detailed program financial records.
The same time-boundary issue matters for cost-effectiveness calculations. A dollars-per-MWh metric needs costs and energy savings defined for the same sector, period, and reporting scope. Dividing life-cycle costs by reporting-year savings would mix different time horizons and could produce a misleading ratio.
Absolute cost is not a ranking of program performance
The upper group includes states from several regions: California and Washington in the West; Michigan, Illinois, and Minnesota in the Midwest; and New Jersey, New York, Maryland, and Massachusetts in the East. The pattern shows substantial geographic variation in reported costs, but it does not identify a single cause for that variation.
Absolute program costs can be affected by program scale, the number and size of commercial customers, participation, administrative structures, evaluation and technical-support activities, the expected program life, and the set of reporting entities. A performance comparison would need additional matched variables such as commercial energy savings in MWh, peak-demand savings in MW, customer incentives, customer counts, electricity sales, and participation.
- What the dataset can answer: the absolute size, ranking, distribution, and concentration of 2023 reported expected life-cycle commercial all-other costs by state.
- What it cannot answer alone: cost-effectiveness, cost per commercial customer, cost per MWh saved, actual cash spending during 2023, or policy quality.
- Useful follow-up data: commercial energy savings, peak-demand savings, customer incentives, commercial customer counts, electricity sales, and participant counts.
Source and calculation method
The state observations come from the U.S. Energy Information Administration State Electricity Profiles, Costs and Savings from Energy Efficiency Programs. The selected slice is 2023, Commercial sector, Expected Life Cycle of Programs, All Other Costs, with a source unit of thousand dollars. The national life-cycle cost reference comes from Electric Power Annual Table 10.2.
All 51 state and District codes are unique, every row is dated 2023, and there are no missing numeric observations. There are 3 reported zeroes. The sum ($1124.053 million), mean ($22.040 million), median ($8.775 million), quartiles, rankings, and cumulative shares are calculated directly from those 51 observations. The representative chart displays the top 15 states after converting thousand dollars to USD millions for readability.
Main takeaway
California has the largest 2023 reported expected life-cycle commercial all-other cost at $255.909 million, followed by Michigan at $139.649 million and New Jersey at $94.105 million. The top ten account for 71.6% of the 51-row sum, and the mean is about 2.5 times the median. The most important qualification is that the official national table is materially higher than the sum of this state-profile series, so the two official presentations should not be treated as arithmetically interchangeable.
Frequently Asked Questions
Which state had the largest 2023 commercial energy-efficiency life-cycle all-other costs?
California ranked first at $255.909 million, followed by Michigan at $139.649 million and New Jersey at $94.105 million.
Does All Other Costs mean commercial electricity bills or energy expenditures?
No. It is an EIA-861 energy-efficiency program-cost category reported separately from customer incentives.
Does Expected Life Cycle of Programs mean only cash spent during 2023?
No. The series is tied to expected program life-cycle costs rather than a simple one-year cash-spending total.
Why is the 51-state sum lower than EIA’s national commercial figure?
The state sum is $1124.053 million and the national table reports $1335.146 million, a difference of about 15.8%. The supplied state series does not establish the cause, so the two values are presented separately.
Related Maps
Green Map creates custom-edited map images using open geographic data sources such as geoBoundaries, Natural Earth, OpenStreetMap, and government open data.
These maps are edited visual materials, not raw data files, and are provided for education, documents, presentations, and graphic reference.