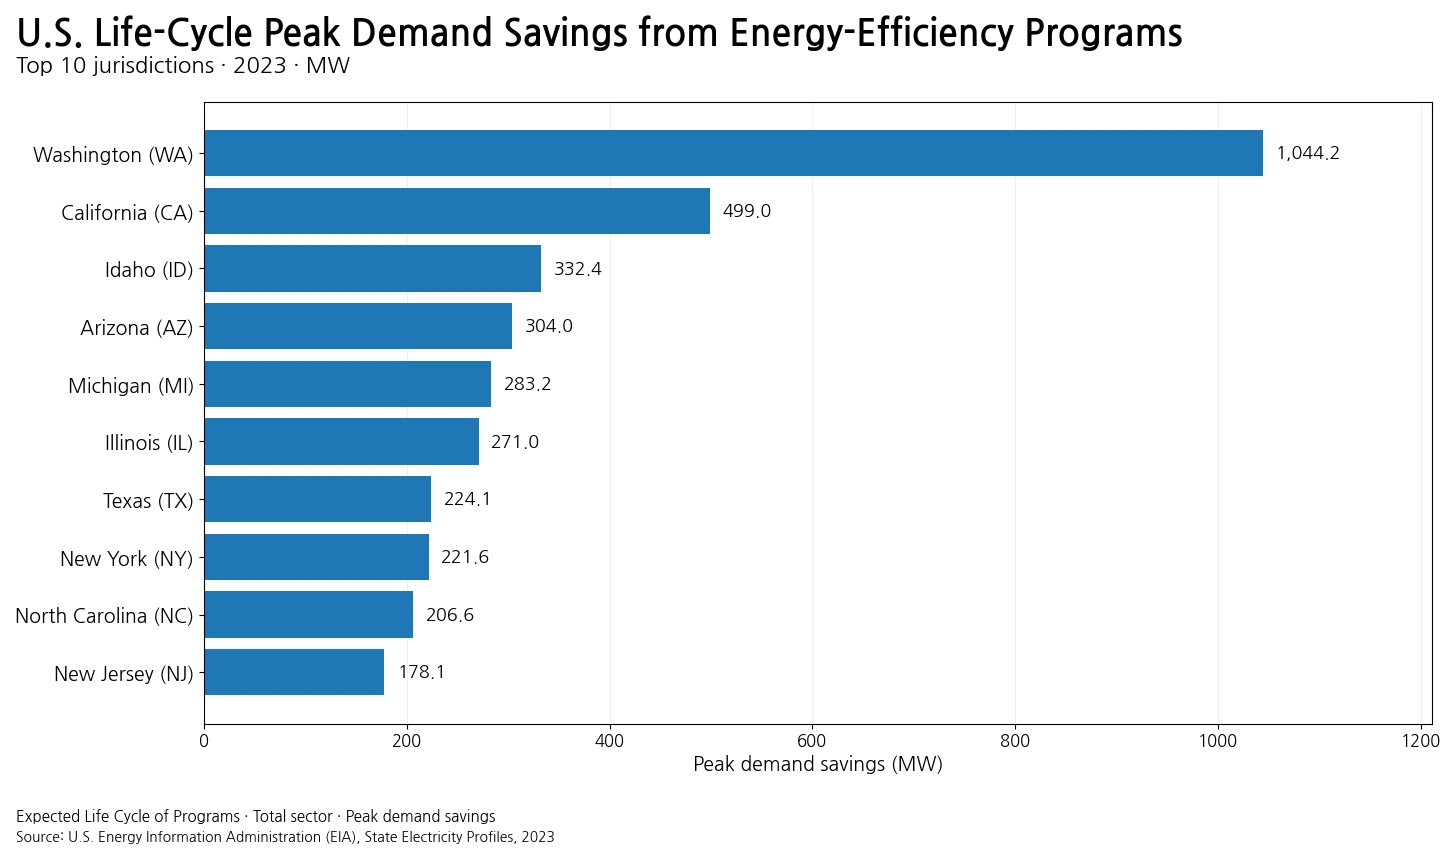
State-level energy-efficiency data for 2023 show a highly uneven distribution of life-cycle peak demand savings. In the U.S. Energy Information Administration (EIA) State Electricity Profiles, Washington reports 1,044.2 MW for the combination Total sector + Expected Life Cycle of Programs + peak demand savings. California is second at 499.0 MW, followed by Idaho at 332.4 MW, Arizona at 304.0 MW, and Michigan at 283.2 MW. Adding the 50 states and the District of Columbia gives 5,654.7 MW across 51 reported observations.
This measure is not annual electricity consumption saved in megawatthours. EIA-861 energy-efficiency reporting separates energy savings from peak demand savings, and this slice uses the expected life cycle of programs. Peak demand savings are reported in megawatts because they describe the reduction in maximum power demand associated with the programs, not the cumulative amount of energy saved over a year. A large value therefore means a large reported life-cycle peak-demand saving in this specific EIA framework; it does not by itself show lower electricity prices, better overall grid efficiency, or higher cost-effectiveness.
Table of Contents
What the metric measures
EIA collects energy-efficiency savings and costs through Form EIA-861 and publishes both reporting-year and life-cycle measures. Energy savings and peak demand savings answer different questions. Energy savings are measured in MWh and reflect an amount of electricity, while peak demand savings are measured in MW and relate to the maximum rate of electricity demand that programs can reduce. A program can have substantial annual energy savings without producing the same relative effect at system peak, and a program designed around peak periods can have a notable MW effect even if its annual MWh savings tell a different story.
The state dataset used here fixes the sector facet at Total. It therefore combines the customer sectors included by EIA rather than identifying which sector or individual program produced each state total. The state ranking cannot establish that one technology, utility, policy, or customer class caused Washington or any other state to rank where it does. The defensible comparison is narrower: 51 jurisdictions reported values under the same 2023 state-profile series, unit, sector aggregation, and life-cycle time-period definition.
Washington stands far above the rest at 1,044.2 MW
Washington is the clearest outlier in the state distribution. Its 1,044.2 MW equals about 18.5% of the sum of the 51 observations and is roughly 2.1 times California’s 499.0 MW. Washington alone also exceeds California and Idaho combined, which total 831.4 MW. After Idaho and Arizona, Michigan records 283.2 MW and Illinois 271.0 MW, forming the next tier below the four largest observations.
The concentration is visible in cumulative shares. The top five jurisdictions sum to 2,462.8 MW, or about 43.6% of the 51-jurisdiction total. The top ten reach 3,564.2 MW, or 63.0%, and the top fifteen reach 4,361.4 MW, or 77.1%. The top ten represent only 19.6% of the jurisdictions but account for nearly two-thirds of the reported MW in this slice.
The 55.6 MW median is far below the 110.9 MW mean
The simple mean across all 51 observations is 110.9 MW, while the median is 55.6 MW. Virginia, at 55.6 MW, sits at the median position. The mean being almost twice the median is another sign that a relatively small number of large values pull the average upward. Describing the typical state only with an average of about 111 MW would therefore overstate where the middle of the distribution actually lies.
| Value band | Number of jurisdictions |
|---|---|
| 0 MW | 1 |
| >0–10 MW | 8 |
| >10–50 MW | 16 |
| >50–100 MW | 8 |
| >100–200 MW | 9 |
| >200–300 MW | 5 |
| >300–500 MW | 3 |
| >500 MW | 1 |
Only Alaska is reported at exactly 0.0 MW. Eight additional jurisdictions are above zero but no higher than 10 MW, and 16 fall above 10 through 50 MW. Eighteen jurisdictions exceed 100 MW. Only Washington, California, Idaho, and Arizona exceed 300 MW, and Washington is the sole observation above 500 MW. The data therefore span from zero to more than one gigawatt of reported life-cycle peak demand savings.
Full 2023 ranking of all 51 jurisdictions
The table below sorts the 2023 values from highest to lowest. Each share uses the 5,654.7 MW sum of the same 51 state and District of Columbia observations as the denominator. No national total row, different year, population weight, or imputed value is mixed into the ranking.
| Rank | State or jurisdiction | Life-cycle peak demand savings (MW) | Share of 51-jurisdiction sum |
|---|---|---|---|
| 1 | Washington (WA) | 1,044.2 | 18.5% |
| 2 | California (CA) | 499.0 | 8.8% |
| 3 | Idaho (ID) | 332.4 | 5.9% |
| 4 | Arizona (AZ) | 304.0 | 5.4% |
| 5 | Michigan (MI) | 283.2 | 5.0% |
| 6 | Illinois (IL) | 271.0 | 4.8% |
| 7 | Texas (TX) | 224.1 | 4.0% |
| 8 | New York (NY) | 221.6 | 3.9% |
| 9 | North Carolina (NC) | 206.6 | 3.7% |
| 10 | New Jersey (NJ) | 178.1 | 3.1% |
| 11 | Pennsylvania (PA) | 177.3 | 3.1% |
| 12 | Maryland (MD) | 161.9 | 2.9% |
| 13 | Minnesota (MN) | 161.1 | 2.8% |
| 14 | Florida (FL) | 152.1 | 2.7% |
| 15 | Colorado (CO) | 144.8 | 2.6% |
| 16 | Georgia (GA) | 113.3 | 2.0% |
| 17 | Indiana (IN) | 109.7 | 1.9% |
| 18 | Oklahoma (OK) | 100.1 | 1.8% |
| 19 | Oregon (OR) | 93.7 | 1.7% |
| 20 | Massachusetts (MA) | 80.7 | 1.4% |
| 21 | Wisconsin (WI) | 80.0 | 1.4% |
| 22 | Nevada (NV) | 77.5 | 1.4% |
| 23 | Arkansas (AR) | 70.9 | 1.3% |
| 24 | South Carolina (SC) | 63.6 | 1.1% |
| 25 | Missouri (MO) | 62.0 | 1.1% |
| 26 | Virginia (VA) | 55.6 | 1.0% |
| 27 | Utah (UT) | 48.6 | 0.9% |
| 28 | Connecticut (CT) | 47.6 | 0.8% |
| 29 | Louisiana (LA) | 35.4 | 0.6% |
| 30 | Iowa (IA) | 35.2 | 0.6% |
| 31 | New Mexico (NM) | 30.6 | 0.5% |
| 32 | Mississippi (MS) | 20.6 | 0.4% |
| 33 | District of Columbia (DC) | 19.4 | 0.3% |
| 34 | Rhode Island (RI) | 16.1 | 0.3% |
| 35 | Alabama (AL) | 15.6 | 0.3% |
| 36 | Kentucky (KY) | 15.3 | 0.3% |
| 37 | Delaware (DE) | 13.1 | 0.2% |
| 38 | New Hampshire (NH) | 13.0 | 0.2% |
| 39 | Hawaii (HI) | 11.2 | 0.2% |
| 40 | Maine (ME) | 10.8 | 0.2% |
| 41 | Tennessee (TN) | 10.7 | 0.2% |
| 42 | Vermont (VT) | 10.4 | 0.2% |
| 43 | Nebraska (NE) | 10.0 | 0.2% |
| 44 | Ohio (OH) | 6.7 | 0.1% |
| 45 | Wyoming (WY) | 6.5 | 0.1% |
| 46 | South Dakota (SD) | 5.9 | 0.1% |
| 47 | Montana (MT) | 1.1 | 0.0% |
| 48 | West Virginia (WV) | 1.1 | 0.0% |
| 49 | North Dakota (ND) | 0.9 | 0.0% |
| 50 | Kansas (KS) | 0.4 | 0.0% |
| 51 | Alaska (AK) | 0.0 | 0.0% |
How to interpret zero and very small values
Alaska’s 0.0 MW is a numeric observation in this dataset, not a missing row. It should not be expanded into the claim that Alaska had no energy-efficiency activity. The series is defined by a specific combination of year, Total sector, Expected Life Cycle of Programs, and peak demand savings. Other EIA measures cover energy savings, reporting-year values, costs, and demand response. Likewise, Kansas at 0.4 MW, North Dakota at 0.9 MW, and Montana and West Virginia at 1.1 MW remain small positive observations rather than being rounded into the zero group.
A low absolute MW value is also not the same as poor program performance. The dataset does not provide a denominator such as statewide peak load, electricity sales, number of participating customers, program spending, or population. Fifty megawatts could represent a very different relative effect in a small system than in a large one. Cost-effectiveness or savings as a share of peak load would require additional, consistently matched data.
Western states dominate the very top, but the pattern is not confined to one region
The four largest observations—Washington, California, Idaho, and Arizona—are all in the West, making the upper tail visibly western. The next group broadens geographically: Michigan and Illinois are followed by Texas, New York, North Carolina, and New Jersey in the top ten. The distribution is therefore better described as a strong western upper tier combined with sizable observations in several other parts of the country, rather than a single continuous regional cluster.
The state pattern alone does not identify why those differences exist. Peak-load scale, utility program design, customer mix, reporting coverage, expected program duration, spending, climate, and other factors could matter, but none of those explanatory variables are contained in this single series. Testing causes would require joining the values to additional EIA or program-level data rather than inferring them from the ranking.
The state sum closely matches EIA’s national life-cycle total
EIA’s Electric Power Annual Table 10.2 reports 5,655 MW of total U.S. life-cycle peak demand savings for energy-efficiency programs in 2023. The sum of the 51 state and District of Columbia observations used here is 5,654.7 MW, only 0.3 MW lower. The state API values are displayed to one decimal place while the national table is shown in whole MW, so this article consistently uses the 5,654.7 MW state sum for rankings and shares rather than forcing the two presentations to be identical.
The same national table provides useful sector context: commercial programs account for 3,214 MW, residential for 2,069 MW, industrial for 372 MW, and transportation for 0 MW in the 2023 life-cycle peak-demand category. That corresponds to about 56.8% commercial, 36.6% residential, and 6.6% industrial at the national level. Those national percentages should not be assigned to each state, because the state series analyzed here is the Total-sector aggregate and individual state sector mixes can differ.
What this dataset can and cannot answer
- It can answer: which jurisdictions reported the largest 2023 life-cycle peak demand savings under this EIA definition, and how concentrated the state distribution is.
- It cannot answer by itself: which state has the best energy-efficiency policy, the best cost-effectiveness, the largest percentage reduction in peak load, or the biggest customer bill savings.
- Useful next data: statewide peak demand, program costs, energy savings in MWh, customer participation, sector detail, and a consistent multi-year series.
The distinction between scale and efficiency is central. This ranking compares absolute MW. Large systems or large program portfolios can produce large absolute savings without necessarily having the highest savings per dollar, per customer, or as a percentage of peak load. Conversely, a smaller absolute value may represent a meaningful relative reduction in a smaller electricity system. The data are strongest when used for the question they directly measure: where the reported life-cycle peak-demand savings are largest in absolute terms.
Source and calculation method
The state observations come from the U.S. Energy Information Administration State Electricity Profiles, Costs and Savings from Energy Efficiency Programs. The extract is annual 2023 data, sector Total, time period Expected Life Cycle of Programs, and the peak-demand-savings field, reported in megawatts. The file contains one numeric observation for each of the 50 states and the District of Columbia.
The sum, mean, median, ranking, value-band counts, and cumulative shares are calculated directly from those 51 observations. No missing value is converted to zero, no neighboring year is substituted, and no population or electricity-sales weighting is applied. National sector context is taken from EIA’s Electric Power Annual Table 10.2, Energy Efficiency – Life Cycle, while the broader survey scope is documented on the Form EIA-861 detailed data page.
Main takeaway
Washington reported the largest 2023 life-cycle peak demand savings at 1,044.2 MW, followed by California at 499.0 MW, Idaho at 332.4 MW, and Arizona at 304.0 MW. Washington alone represented about 18.5% of the 51-jurisdiction sum, while the top ten accounted for about 63.0%. At the same time, the median was only 55.6 MW compared with a mean of 110.9 MW, showing how strongly the upper tail shapes the national state-level distribution.
The ranking is best read as a comparison of absolute program-related peak-demand savings under one EIA definition and year. It is not a scorecard of state policy quality or program efficiency. With that boundary kept clear, the dataset provides a useful baseline for identifying where life-cycle peak-demand savings were reported at the largest scale and where deeper analysis with costs, peak load, or sector data would be most informative.
Frequently Asked Questions
Which state had the largest 2023 life-cycle peak demand savings?
Washington ranked first at 1,044.2 MW, followed by California at 499.0 MW, Idaho at 332.4 MW, and Arizona at 304.0 MW.
Are life-cycle peak demand savings the same as annual energy savings?
No. Peak demand savings measure reductions in maximum power demand in MW, while annual energy savings are a separate measure reported in MWh.
Does Washington’s high value mean it had the best energy-efficiency policy?
Not from this dataset alone. The ranking compares absolute MW and does not include program cost, statewide peak load, customer participation, or other denominators needed for an efficiency assessment.
Does Alaska’s 0 MW mean data are missing?
No. Alaska has a reported numeric value of 0.0 MW in this specific series. It does not imply that every other energy-efficiency or demand-side program measure is zero.
Related Articles
- Which States Reported the Highest Industrial Energy-Efficiency Program Other Costs? (2023)
- Where Is U.S. Industrial and Commercial Electricity Generation Concentrated? (2024)
- Which U.S. States Used the Most Fuel for Useful Thermal Output? (2025)
Green Map creates custom-edited map images using open geographic data sources such as geoBoundaries, Natural Earth, OpenStreetMap, and government open data.
These maps are edited visual materials, not raw data files, and are provided for education, documents, presentations, and graphic reference.