The 2025 state-level EIA series shows a sharply concentrated pattern in fuel consumed for useful thermal output by the electric utility sector. Alabama is the largest observation at 14.504 million MMBtu, followed by North Dakota at 10.180, Wisconsin at 9.412, and New York at 9.354. Together, those four jurisdictions account for about 54.3% of the sum of all 51 state and District of Columbia observations in this slice.
The scope is narrower than a general measure of state energy use. The series covers electric utilities, combines all fuels, and records fuel consumed for the production of useful thermal output. EIA defines useful thermal output in the context of combined heat and power (CHP) as thermal energy made available for processes, heating, cooling, or other end uses rather than electric generation. A high value therefore does not mean that a state has the highest overall energy consumption or the most efficient power system.
Of the 51 observations, 22 are greater than zero and 29 are reported as exactly zero. The zeroes are retained as reported values; they are not treated as missing observations and are not replaced with values from another year. All rankings and shares below use the same 2025 annual slice and the unit reported by EIA, million MMBtu.
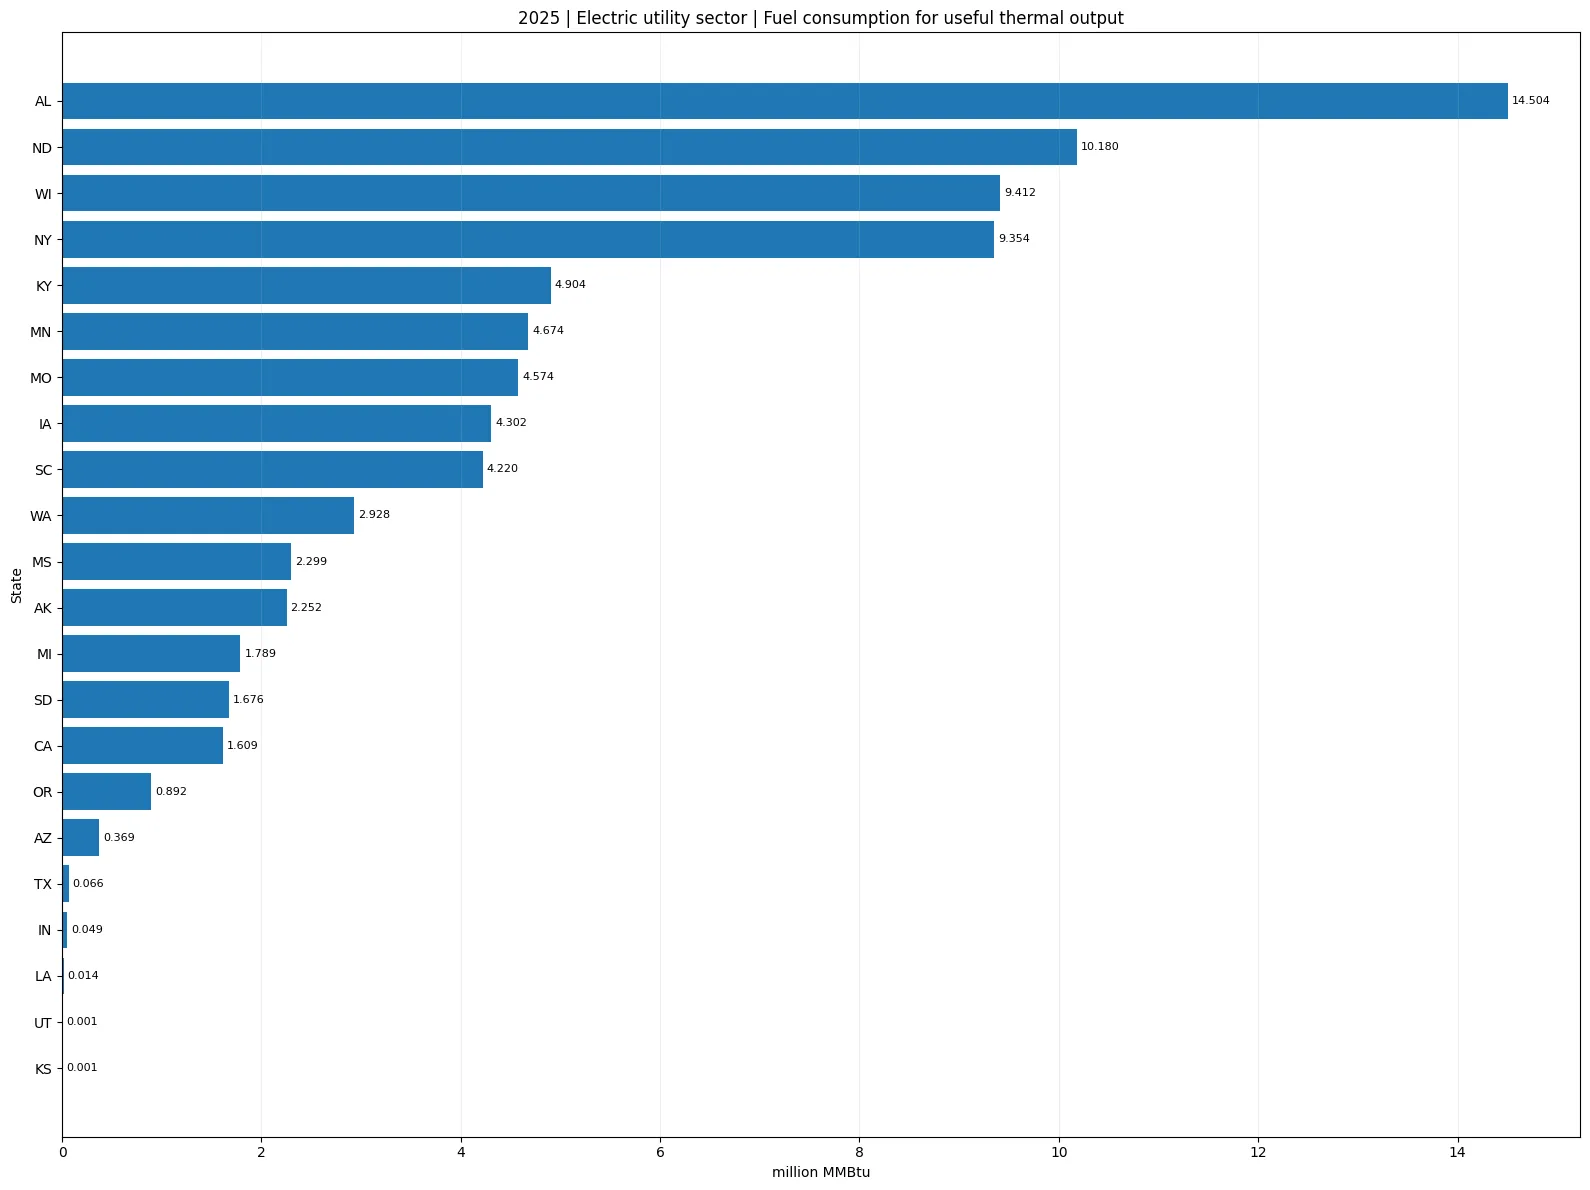
Table of Contents
What this EIA series actually measures
The field used here is consumption-uto-btu. It is a fuel-consumption measure tied specifically to the production of useful thermal output. That distinction matters: fuel energy put into a CHP process is not the same quantity as the useful heat ultimately delivered. The series should therefore be described as fuel consumed for useful thermal output, not simply as “heat output by state.”
The sector filter is Electric Utility. EIA defines an electric utility as a public or private entity associated with distribution facilities that delivers electricity primarily for public use. Independent power producers can fall outside this sector. As a result, this dataset is not a census of every CHP facility or every source of useful thermal output operating within a state.
The fuel facet is ALL, so the values combine fuel categories rather than ranking one fuel such as natural gas, coal, or petroleum. The mix behind each state total is not included in this one series. A fuel-specific explanation would require additional EIA series using the same year and sector but separate fuel facets.
The 2025 distribution is dominated by a small group of states
Adding the 51 observations yields 80.069 million MMBtu. This is a direct sum of the state and District of Columbia records used on this page, not a separately retrieved national-total row. The simple mean across all 51 observations is 1.570 million MMBtu, while the median is zero because more than half of the jurisdictions report zero in this particular series.
Among the 22 jurisdictions with positive values, the mean is 3.639 and the median is 2.275 million MMBtu. The lower median reflects the pull of a few large observations on the mean. Concentration is even clearer in the cumulative shares: the top four account for 54.3% of the 51-observation sum, and the top ten account for 86.2%.
Those shares describe concentration within this exact metric, not the concentration of all U.S. energy use. State population, electricity sales, generation, CHP capacity, industrial activity, thermal demand, ownership structure, and plant operations are not denominators in this table. The dataset identifies where the reported fuel consumption is large; it does not, by itself, explain why.
Ranking the 22 states with positive reported values
| Rank | State | 2025 value (million MMBtu) | Share of 51-observation sum |
|---|---|---|---|
| 1 | Alabama (AL) | 14.504 | 18.1% |
| 2 | North Dakota (ND) | 10.180 | 12.7% |
| 3 | Wisconsin (WI) | 9.412 | 11.8% |
| 4 | New York (NY) | 9.354 | 11.7% |
| 5 | Kentucky (KY) | 4.904 | 6.1% |
| 6 | Minnesota (MN) | 4.674 | 5.8% |
| 7 | Missouri (MO) | 4.574 | 5.7% |
| 8 | Iowa (IA) | 4.302 | 5.4% |
| 9 | South Carolina (SC) | 4.220 | 5.3% |
| 10 | Washington (WA) | 2.928 | 3.7% |
| 11 | Mississippi (MS) | 2.299 | 2.9% |
| 12 | Alaska (AK) | 2.252 | 2.8% |
| 13 | Michigan (MI) | 1.789 | 2.2% |
| 14 | South Dakota (SD) | 1.676 | 2.1% |
| 15 | California (CA) | 1.609 | 2.0% |
| 16 | Oregon (OR) | 0.892 | 1.1% |
| 17 | Arizona (AZ) | 0.369 | 0.5% |
| 18 | Texas (TX) | 0.066 | 0.1% |
| 19 | Indiana (IN) | 0.049 | 0.1% |
| 20 | Louisiana (LA) | 0.014 | 0.0% |
| 21 | Utah (UT) | 0.001 | 0.0% |
| 22 | Kansas (KS) | 0.001 | 0.0% |
Alabama stands apart at the top, representing about 18.1% of the summed observations. North Dakota contributes 12.7%, Wisconsin 11.8%, and New York 11.7%. Kentucky, Minnesota, Missouri, Iowa, and South Carolina form the next tier, each between roughly 4.2 and 4.9 million MMBtu.
Below that group, Washington reports 2.928 million MMBtu, Mississippi 2.299, Alaska 2.252, Michigan 1.789, South Dakota 1.676, and California 1.609. Oregon and Arizona are below 1 million MMBtu. Texas, Indiana, Louisiana, Utah, and Kansas remain positive but are very close to zero relative to the leading states. Keeping those small positives distinct from reported zeroes preserves an important difference in the source data.
How to read the 29 zero observations
The jurisdictions reported as exactly zero are Arkansas, Colorado, Connecticut, District of Columbia, Delaware, Florida, Georgia, Hawaii, Idaho, Illinois, Massachusetts, Maryland, Maine, Montana, North Carolina, Nebraska, New Hampshire, New Jersey, New Mexico, Nevada, Ohio, Oklahoma, Pennsylvania, Rhode Island, Tennessee, Virginia, Vermont, West Virginia, Wyoming. These are numeric zero observations within the same 2025 dataset, not missing rows. They remain zero in the distribution statistics and are not imputed from neighboring states or earlier years.
A reported zero in this series should not be expanded into a claim that a state has no CHP, no useful thermal output, or no thermal-energy activity. The metric is restricted to fuel consumed for useful thermal output in the electric utility sector. CHP owned by industrial or commercial establishments, activity classified under another EIA sector, or independent power producers may not be represented by this exact slice.
This distinction also matters for visualization. Missing values should normally be shown as “no data,” while reported zeroes are valid numeric observations. The bar chart on this page displays only positive values so that very small positives remain visible; the zero group is documented separately rather than being silently merged with missing data.
More than half of the total sits in the top four states
Alabama, North Dakota, Wisconsin, and New York sum to 43.450 million MMBtu, or 54.3% of the 51-observation total. Adding Kentucky brings the top-five share to about 60.4%, and the top ten reach 86.2%. The series is therefore highly concentrated rather than evenly distributed among states.
The concentration should not be interpreted as an intensity ranking. A state can have a large absolute value because of the amount, size, or operating pattern of facilities that fall into this reporting category. Without a denominator such as generation, CHP capacity, population, gross state product, or useful heat delivered, the table cannot answer which state uses the most fuel per unit of activity.
The fact that both a large economy such as New York and a much smaller state such as North Dakota appear near the top is a useful warning against explaining the ranking with population alone. It suggests that the relevant facility and operating structure matters, but determining the drivers would require additional plant-level or state-level variables. This article does not infer those causes from a single series.
The geography is not a simple regional gradient
The leading values are spread across several parts of the country: Alabama and Kentucky in the South, North Dakota and several Midwestern states, New York in the Northeast, and Washington in the West. The positive observations do not form one continuous high-value belt. That makes a simple east-versus-west or north-versus-south explanation unreliable.
State totals can also hide local concentration. One large CHP facility or a small group of facilities can have an outsized effect on a state value, while the rest of the state may have little activity in this particular category. The dataset contains state totals, not the locations, capacities, fuel types, or ownership details of individual facilities.
A stronger geographic analysis would join the 2025 series with CHP capacity or generation and then examine fuel-specific components. That would allow questions about whether a high state total reflects more capacity, different fuels, heavier utilization, or another factor. Those questions are valid next steps, but they are not answered by the current single-metric slice.
What this metric should not be confused with
Fuel consumed for useful thermal output is not total state energy consumption, electricity generation, residential heating use, or all fuel consumed by the electric power sector. It is also not a direct efficiency percentage and not a measure of carbon emissions. Broad searches for “state energy consumption” can therefore lead to very different EIA series with different denominators and sectors.
An efficiency comparison would require both useful thermal output and the relevant fuel input, with careful treatment of CHP because electricity and heat are produced together. An emissions comparison would require fuel-specific quantities and appropriate emissions factors. Neither calculation can be made responsibly from the all-fuels consumption series alone.
For planning or policy research, the value of this dataset is as a screening tool. It identifies states with large reported values, distinguishes positive values from zeroes, and quantifies how concentrated the distribution is. A second stage can then add plant, fuel, generation, capacity, or economic data to test possible explanations instead of guessing from the ranking.
Source and calculation method
The underlying observations come from the U.S. Energy Information Administration API v2 electric-power-operational-data route, filtered to annual frequency, 2025, consumption-uto-btu, fuel type ALL, and sector Electric Utility. The 51 records cover the 50 states and the District of Columbia. The source unit, million MMBtu, is preserved without conversion.
The meaning of useful thermal output is based on the EIA glossary definition of Useful thermal output, while the sector scope follows the EIA definition of Electric utility. EIA describes useful thermal output as thermal energy from CHP made available for non-electric processes and applications. That definition is why this page keeps fuel consumed for useful thermal output separate from ordinary electricity generation or broad state energy consumption.
The ranking is a descending sort of the 2025 state observations. The sum of 80.069 million MMBtu, the 22 positive and 29 zero counts, and the top-four and top-ten shares are calculated directly from those values. No missing-value filling, cross-year substitution, population weighting, or modeled estimation is used. Additional official electricity tables and series are available through EIA Electricity Data.
The main takeaway
For 2025, this narrow electric-utility CHP fuel-consumption series is concentrated in a small number of states. Alabama is the largest observation, with North Dakota, Wisconsin, and New York close behind as a group, while 29 jurisdictions report zero. The distribution is useful precisely because it is specific; it should not be stretched into a ranking of overall state energy use or CHP performance.
The safest way to use the results is to keep three boundaries in view: reported zero is not missing data, absolute state totals are not intensity measures, and one sector does not represent every CHP owner or facility in a state. With those limits explicit, the dataset provides a clear baseline for deciding where a deeper plant-, fuel-, or capacity-level analysis would be most informative.
Frequently Asked Questions
What does EIA mean by useful thermal output?
It is thermal energy from a combined heat and power system that is made available for industrial or commercial processes, heating, cooling, or other end uses rather than electric generation. This article compares fuel consumed to produce that useful thermal output.
Why do 29 jurisdictions report zero in 2025?
The series is limited to a specific EIA electric-utility category. A zero is a reported value in this series, not proof that a state has no CHP or thermal-energy activity. Facilities in other sectors or ownership categories can fall outside this slice.
Which state has the highest 2025 value?
Alabama is highest at 14.504 million MMBtu, followed by North Dakota at 10.180, Wisconsin at 9.412, and New York at 9.354 million MMBtu.
Can this ranking be used as an energy-efficiency or total-energy-use ranking?
No. It is an absolute fuel-consumption measure for useful thermal output in the electric utility sector. Efficiency, total state energy use, generation, and emissions require additional denominators or separate metrics.
Related Articles
U.S. County Employment Growth Map: 2025 QCEW Annual Average Change
U.S. County Wage Level Map – 2025 BLS QCEW Average Weekly Wages
U.S. County Poverty Rate Map | 2024 ACS
Green Map creates custom-edited map images using open geographic data sources such as geoBoundaries, Natural Earth, OpenStreetMap, and government open data.
These maps are edited visual materials, not raw data files, and are provided for education, documents, presentations, and graphic reference.