Gender parity in outbound student mobility to Latin America and the Caribbean was uncommon in the 2023 UNESCO Institute for Statistics dataset. Among 112 countries with reported values, only 4 fell within the 0.97–1.03 range that UNESCO commonly uses as an approximate parity band. 71 countries were below 0.97 and 37 were above 1.03. The measure is an adjusted gender parity index (GPIA), not a count of female and male students.
A value of 1 means that the female and male values of the underlying outbound mobility ratio are equal. Values below 1 indicate a lower female value, while values above 1 indicate a higher female value. Because the index is adjusted to make disparities symmetric around 1, a value such as 1.5 must not be read as a simple 50% increase. The main purpose of the scale is to compare the direction and size of the gender gap consistently.
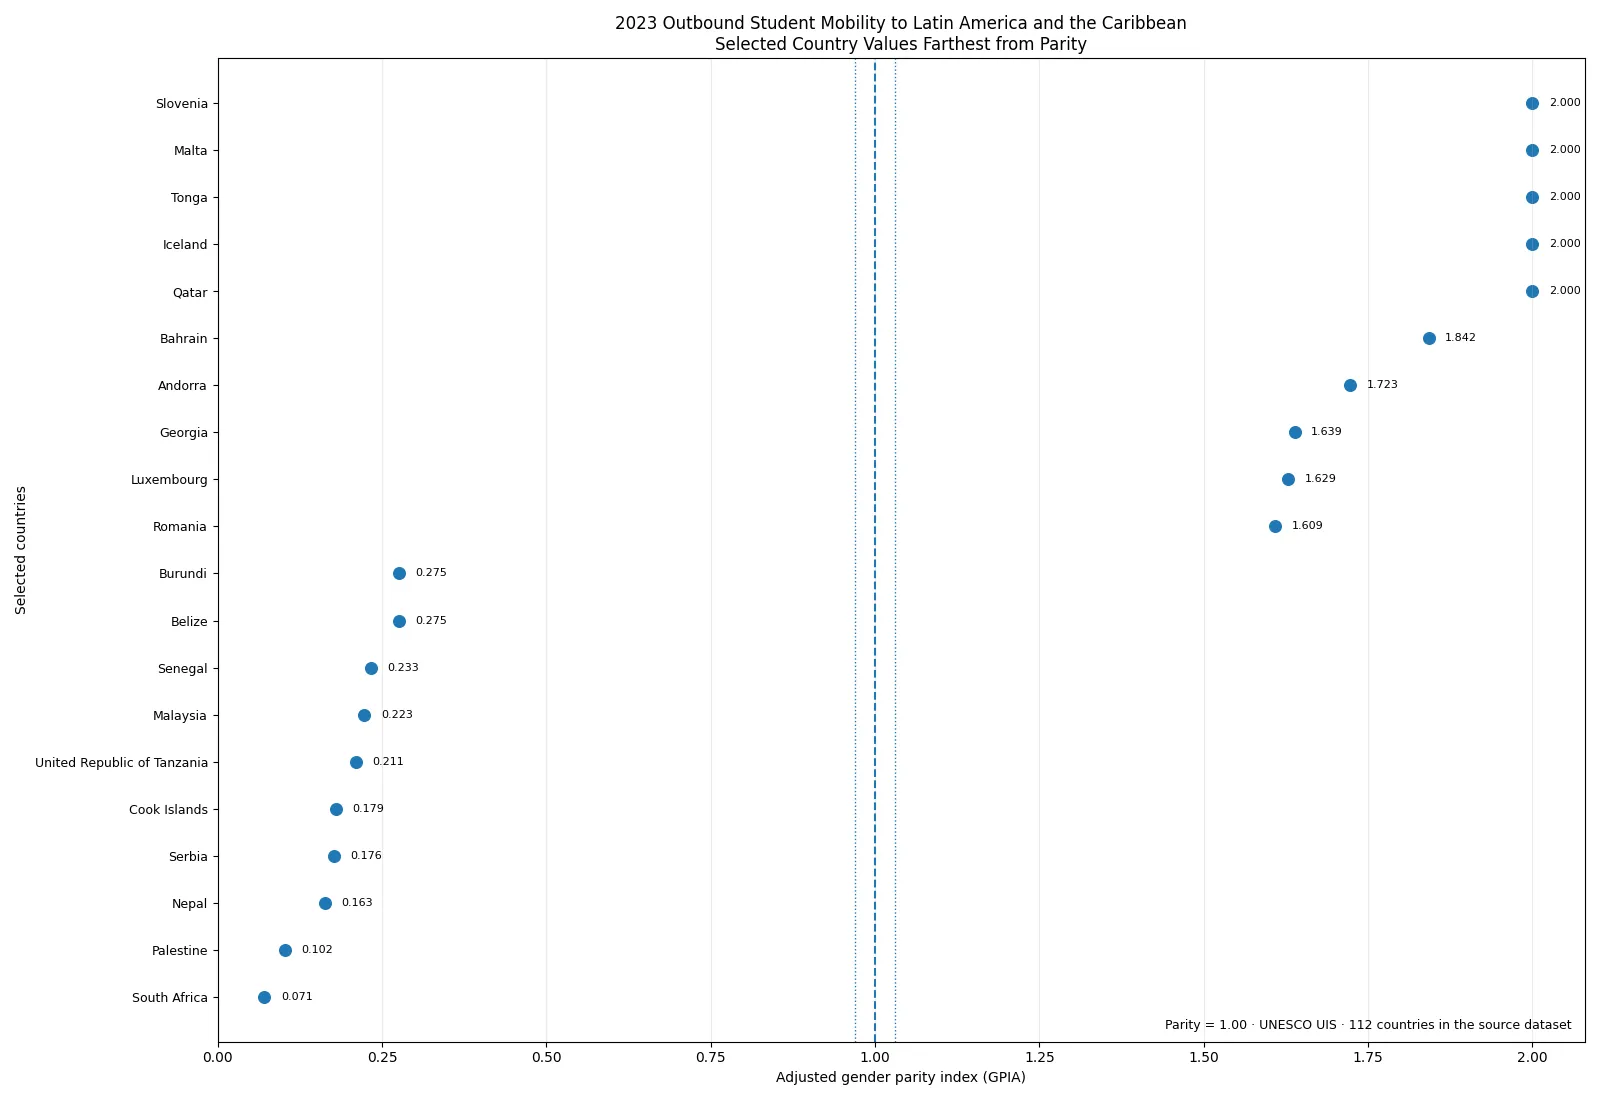
Table of Contents
What the indicator measures
UNESCO UIS defines the outbound mobility ratio as the number of students from a country studying abroad expressed as a percentage of total tertiary enrolment in that country. The measure can be disaggregated by sex and by destination region. The indicator used here narrows the destination to Latin America and the Caribbean and then compares the female and male outbound mobility ratios through GPIA.
The adjusted gender parity index is designed around a parity point of 1. When the female indicator value is less than or equal to the male value, the female-to-male ratio is used directly. When the female value is larger, the scale is transformed by using the inverse ratio and subtracting it from 2. This produces a bounded 0-to-2 scale that is symmetric around 1, making equal-sized gaps in opposite directions directly comparable.
UNESCO UIS explains the adjusted parity method in its parity-index metadata and commonly treats values from 0.97 to 1.03 as indicating approximate parity. In the 2023 data used here, Algeria is 0.99897, Finland 1.01671, Spain 1.01853, and Bosnia and Herzegovina 0.97509. Those are the only four values inside that band.
Only four of 112 countries fall inside the parity band
The unweighted mean of the 112 reported country values is 0.886, while the median is 0.826. The first quartile is 0.517 and the third quartile is 1.173. These are descriptive summaries of the available country observations, not a population-weighted global index. Each country counts once regardless of population or tertiary enrolment, and countries without a reported value are not represented.
Using the 0.97–1.03 band, 71 countries sit below approximate parity, 4 are inside the band, and 37 are above it. Using 1.00 as the exact dividing line, 73 values are below 1 and 39 are above 1. The distribution therefore extends in both directions, but more of the reported country observations lie on the below-1 side.
| Country closest to parity | 2023 GPIA |
|---|---|
| Algeria | 0.99897 |
| Finland | 1.01671 |
| Spain | 1.01853 |
| Bosnia and Herzegovina | 0.97509 |
The lowest values indicate much lower female mobility ratios
For adjusted parity values below 1, no upper-side transformation is applied, so the number is the female-to-male ratio of the underlying indicator. South Africa has the lowest reported value at 0.07092, meaning the female outbound mobility ratio to this destination region is about 7.1% of the male value. Palestine is 0.10240, Nepal 0.16291, Serbia 0.17650, and the Cook Islands 0.17949. Tanzania, Malaysia, and Senegal are also well below 0.25.
That does not mean women from those countries are necessarily less internationally mobile overall. The destination scope matters: the indicator is specifically about mobility to Latin America and the Caribbean. Patterns for North America, Europe, Asia and the Pacific, or other destination groups may be different. It also does not provide the underlying student counts in the parity value itself.
| Lowest country values | 2023 GPIA |
|---|---|
| South Africa | 0.07092 |
| Palestine | 0.10240 |
| Nepal | 0.16291 |
| Serbia | 0.17650 |
| Cook Islands | 0.17949 |
| United Republic of Tanzania | 0.21060 |
| Malaysia | 0.22312 |
| Senegal | 0.23282 |
| Belize | 0.27528 |
| Burundi | 0.27545 |
The upper end of the index needs special interpretation
Iceland, Malta, Qatar, Slovenia, and Tonga all have a reported GPIA of 2.00000. On the adjusted scale, 2 is the upper bound, so it should not be interpreted as ‘twice as high.’ It marks the extreme upper end of the symmetric parity scale. Bahrain follows at 1.84220, Andorra at 1.72274, Georgia at 1.63855, Luxembourg at 1.62867, and Romania at 1.60867.
The transformation above 1 is what makes the scale symmetric. For example, an adjusted value of 1.5 corresponds to an unadjusted female-to-male ratio of 2, not 1.5. That puts 1.5 the same distance from parity as 0.5, allowing a large female-higher gap and a large male-higher gap to be compared on the same scale.
| Highest country values | 2023 GPIA |
|---|---|
| Qatar | 2.00000 |
| Slovenia | 2.00000 |
| Malta | 2.00000 |
| Tonga | 2.00000 |
| Iceland | 2.00000 |
| Bahrain | 1.84220 |
| Andorra | 1.72274 |
| Georgia | 1.63855 |
| Luxembourg | 1.62867 |
| Romania | 1.60867 |
Why this is not a ranking of student numbers
Outbound mobility is a ratio relative to tertiary enrolment in the country of origin. It is therefore different from simply counting how many students study abroad. A populous country can send many more students abroad in absolute terms and still have a lower mobility ratio than a much smaller country. GPIA adds another layer: it summarizes the relationship between the female and male mobility ratios rather than the overall level of outbound mobility.
The destination restriction is equally important. A country with a GPIA close to 1 has similar female and male mobility ratios to Latin America and the Caribbean, but that does not prove gender parity across all international study destinations. Nor does a value far from 1 identify the reason for the difference. Language, scholarships, institutional partnerships, distance, migration networks, fields of study, and visa conditions would require separate evidence.
What the country distribution shows
The median country value is 0.826, so half of the available observations are below that level and half are above it. Because the median itself is below the parity point of 1, the center of the observed country distribution is on the lower side. However, the presence of several values near 2 and several near 0 means that a single average hides substantial dispersion.
Algeria is closest to exact parity, only 0.00103 away from 1. Finland, Spain, and Bosnia and Herzegovina also fall inside the approximate parity band. At the extremes, South Africa and Palestine are close to the lower end of the scale, while five countries reach the upper limit of 2. These values make the cross-country comparison most informative when direction and distance from 1 are considered together.
Limits to keep in mind
- This is a 2023 cross-section. It does not show whether gender gaps improved or worsened over time.
- The dataset contains 112 countries. Missing countries should not be treated as zero or assumed to follow the same distribution.
- GPIA is not a student count. It compares female and male outbound mobility ratios on a symmetric scale.
- The destination is Latin America and the Caribbean. Other destination regions are outside this indicator.
- Extreme parity values can reflect very small underlying rates. The female and male source rates and counts are useful context when available.
- The index does not identify causes. A gap cannot be attributed to policy, income, distance, language, or student preference from this indicator alone.
Source and calculation
The country values come from the UNESCO Institute for Statistics MOR.5T8.40520.GPIA indicator for 2023. The source contains 112 national observations. The published GPIA values were used directly without changing the country-level values.
The analysis calculates distance from the parity point, counts inside and outside the 0.97–1.03 parity band, the unweighted mean and median, and selected high and low country values. The interpretation of values above 1 follows the UIS adjusted-parity method, so the upper-end values are not treated as simple multiples.
Key takeaways
Only 4 of 112 reported countries fall within the 0.97–1.03 approximate parity range for the 2023 outbound mobility ratio to Latin America and the Caribbean. 71 are below the range and 37 are above it. Algeria is closest to 1 at 0.99897, while South Africa has the lowest value at 0.07092. Iceland, Malta, Qatar, Slovenia, and Tonga reach the adjusted index ceiling of 2.0.
The most useful way to read the indicator is as a symmetric comparison of female and male mobility ratios for one destination region. It is not a measure of total international student numbers, not a global gender-parity score for all study abroad, and not evidence of why a gap exists. Its value is in showing which countries are near parity and which are far from it in either direction.
Frequently Asked Questions
What does a GPIA of 1 mean?
It means the female and male values of the underlying outbound mobility ratio are equal. UIS commonly uses 0.97–1.03 as an approximate parity band.
Does a GPIA of 1.5 mean the female rate is 50% higher?
No. Values above 1 use the adjusted symmetric formula. A GPIA of 1.5 corresponds to an unadjusted female-to-male ratio of 2.
Does this indicator cover all international study destinations?
No. It specifically compares outbound mobility ratios for study destinations in Latin America and the Caribbean.
Related Maps
Green Map creates custom-edited map images using open geographic data sources such as geoBoundaries, Natural Earth, OpenStreetMap, and government open data.
These maps are edited visual materials, not raw data files, and are provided for education, documents, presentations, and graphic reference.