UNESCO Institute for Statistics (UIS) data for 2022 show a wide spread in gender parity for lower-secondary-or-higher educational attainment among urban adults age 25 and older. Of the 84 country and area observations available for the same year, 41 fall inside the commonly used adjusted gender parity index (GPIA) band of 0.97–1.03. Another 40 are below 0.97, while only 3 exceed 1.03. The median is 0.973, barely inside the parity band, but the unweighted mean is lower at 0.918 because several very low observations pull the average downward.
The number is not an attainment percentage. GPIA compares the female value of the underlying attainment rate with the male value and expresses their relative balance around 1. For a favorable outcome such as completing at least lower secondary education, a value below 1 means the female attainment rate is lower than the male rate; a value above 1 means the female rate is higher. A value near 1 means the two rates are similar. Reading 0.50 as ‘50% of urban adults completed lower secondary education’ would therefore confuse an index with the underlying percentage.
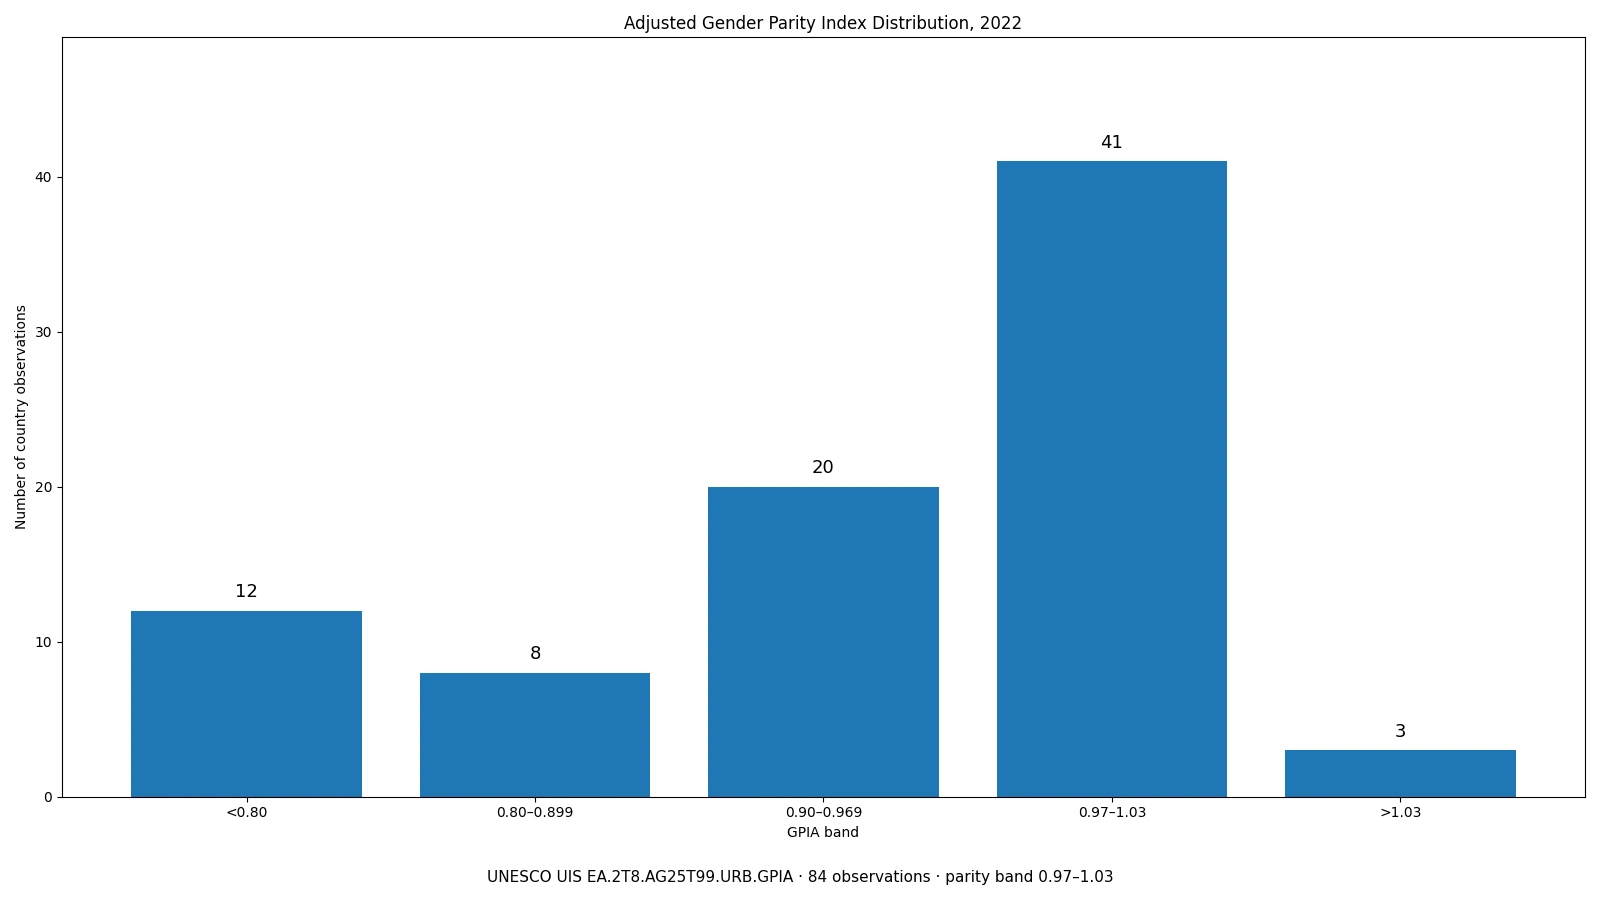
Table of Contents
GPIA measures relative gender balance, not the level of attainment
The underlying education measure is the share of adults age 25 and older who have completed at least a specified level of education. In this case the threshold is completed lower secondary education or higher, the population is restricted to urban residents, and the published series is the adjusted gender parity index rather than the female, male, or total attainment percentage itself. The official indicator code is EA.2T8.AG25T99.URB.GPIA.
A standard gender parity index starts from the female indicator value divided by the male value. Equality gives a ratio of 1. The ordinary ratio is not symmetric around 1, however: if the female value is half the male value the ratio is 0.5, while reversing the two values produces 2.0. UIS uses an adjusted form so disparities on the female-higher side are represented more symmetrically with disparities on the male-higher side. The adjusted index is centered on 1 and bounded between 0 and 2.
UIS commonly interprets 0.97–1.03 as a practical parity interval. That band is useful because tiny differences around 1 should not automatically be treated as substantively different situations. A value of 0.969 and one of 0.971 sit on opposite sides of the conventional cutoff, but they are numerically almost identical. Larger distances from 1 are more informative than fine ranking near the threshold, especially when the data come from censuses or sample surveys with different national reporting systems.
Nearly half of the 84 observations are inside the parity band
Among the 84 available 2022 observations, 41, or 48.8%, fall between 0.97 and 1.03. Forty observations, 47.6%, are below 0.97, and three, 3.6%, are above 1.03. The distribution outside the parity band is therefore highly asymmetric: most non-parity observations lie on the side where the female attainment rate is relatively lower.
Breaking the lower side into additional bands makes the spread easier to see. Twelve observations are below 0.80, eight are between 0.80 and 0.899, and twenty are between 0.90 and 0.969. In other words, exactly half of the 40 observations below the parity band are under 0.90. These are counts of reporting countries and areas, not population-weighted shares, so they should not be rephrased as a percentage of the world’s adults or women.
The median of 0.973 is only slightly above the 0.97 lower boundary, whereas the unweighted mean is 0.918. That gap between mean and median is a sign of a long lower tail. A few observations far below 1 have a large effect on the average. For this reason, the median, parity-band counts, and the most distant observations together describe the dataset better than the mean alone.
The lowest observations are far from the parity point
Afghanistan has the lowest value in the 2022 set at 0.394. It is followed by Togo at 0.436, Benin at 0.453, Ethiopia at 0.589, and Guinea-Bissau at 0.624. Because the underlying outcome is attainment, values this far below 1 indicate a much lower female attainment rate relative to the male rate among the specified urban adult population. They do not mean that only 39.4%, 43.6%, or 45.3% of adults completed lower secondary education.
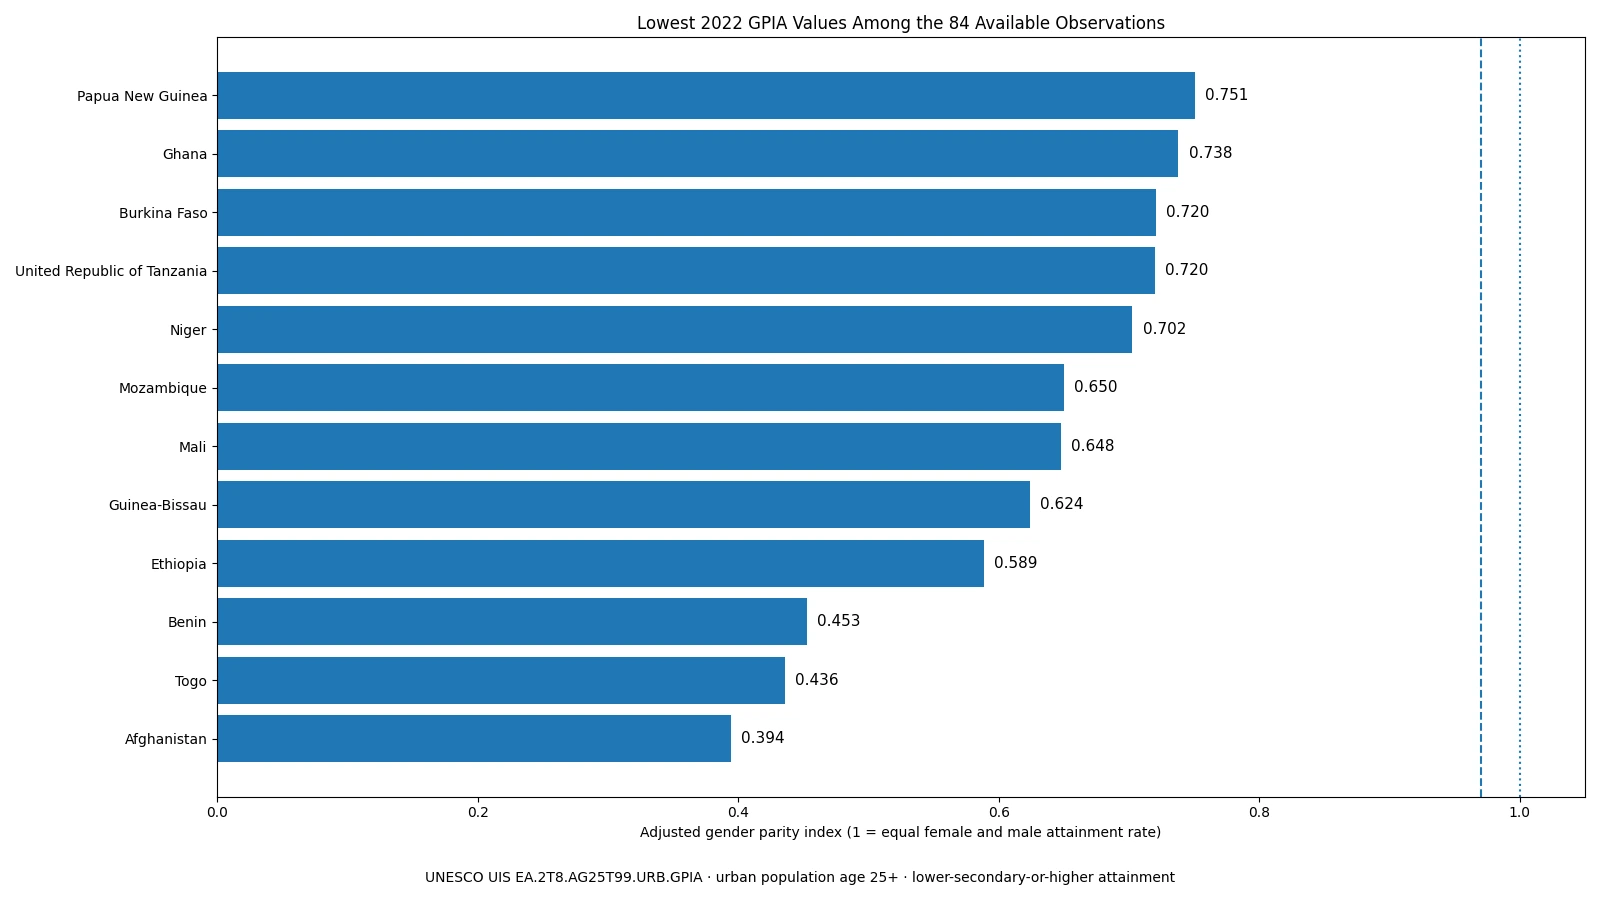
| Country or area | 2022 GPIA |
|---|---|
| Afghanistan | 0.394 |
| Togo | 0.436 |
| Benin | 0.453 |
| Ethiopia | 0.589 |
| Guinea-Bissau | 0.624 |
| Mali | 0.648 |
| Mozambique | 0.650 |
| Niger | 0.702 |
| United Republic of Tanzania | 0.720 |
| Burkina Faso | 0.720 |
| Ghana | 0.738 |
| Papua New Guinea | 0.751 |
Many of the lowest observations are from African countries, but the index alone cannot identify the cause of those gaps. Adult educational attainment is a stock measure accumulated across generations. It can reflect historical access to schooling, but explaining a particular national value would require evidence on cohorts, education policy, household conditions, conflict exposure, migration, and many other factors. The dataset establishes the size and direction of the relative gender gap; it does not supply a causal explanation.
The age threshold also matters. ‘Age 25 and older’ combines people in their late twenties with much older cohorts. If access to secondary education for girls improved sharply during the past decade, that progress may be much clearer among younger adults than in the whole 25-plus population. Conversely, a single recent policy change cannot be assumed to have produced a large difference in an indicator that summarizes the accumulated schooling of several generations.
Only three observations are above 1.03
Suriname has the highest GPIA in the set at 1.093, followed by Uruguay at 1.049 and Palestine at 1.044. These are the only three observations above the upper edge of the usual parity band. Several other countries are slightly above 1 but remain within 0.97–1.03, including the Philippines at 1.024, Costa Rica at 1.023, Jamaica at 1.019, the Dominican Republic at 1.016, and Brazil at 1.014.
A value above 1 should not be treated as a higher education-performance score. It indicates that the female value of the underlying attainment indicator is higher relative to the male value. The adjusted formula also means that values above 1 should not be read as a simple percentage difference. Suriname’s 1.093, for example, is useful for identifying direction and distance from parity, but the female and male attainment percentages themselves are needed to state their absolute gap.
A few familiar values help place the scale in context
Many observations inside the parity band are extremely close to 1. Czechia is 1.000, Uzbekistan 1.000, Georgia 0.999, Armenia 0.999, Australia 0.998, and the United States 1.003. France is 0.972 and Brazil 1.014, so both are also inside the 0.97–1.03 interval. India, at 0.817, is much farther below the lower boundary.
| Country or area | 2022 GPIA | Reading |
|---|---|---|
| United States | 1.003 | Inside parity band |
| Australia | 0.998 | Inside parity band |
| France | 0.972 | Inside parity band |
| Brazil | 1.014 | Inside parity band |
| Republic of Korea | 0.918 | Below 0.97 |
| India | 0.817 | Below 0.97 |
The Republic of Korea records 0.918 in this dataset, below both the median and the 0.97 lower boundary. That shows a lower female attainment rate relative to the male rate for lower-secondary-or-higher attainment among urban adults age 25 and older. It does not say that the country’s overall attainment level is low. The parity question and the absolute attainment question need separate indicators.
Parity can coexist with either high or low attainment
A GPIA close to 1 tells us that the female and male attainment rates are similar. It does not reveal whether both rates are 95%, 70%, or 40%. Two countries can each have a GPIA of 1.000 while having very different absolute attainment levels. One could have near-universal lower-secondary-or-higher attainment among both women and men, while the other could have similarly low attainment for both groups.
The reverse is also important. A country outside the parity band can still have high attainment for both sexes if one rate is modestly higher than the other. That is why GPIA should be paired, when possible, with the female attainment rate, male attainment rate, and total attainment rate. Gender balance answers one question; the level of educational attainment answers another.
This distinction also prevents misleading rankings. A value of 1.01 is not inherently ‘better’ than 0.99. Both are close to parity and differ mainly in direction. For this dataset the most useful comparisons are whether an observation lies within the parity band, how far it sits from 1, and whether the lower tail contains unusually large disparities. Treating every hundredth of a point as a league-table difference would add precision the indicator was not designed to provide.
The urban filter means this is not a national all-population measure
The word ‘urban’ in the series is a real population restriction, not descriptive decoration. Education access, age structure, migration, labor markets, and the composition of households can differ between urban and rural areas. The gender gap among urban adults may therefore differ from the gap for the national population as a whole. A statement about an entire country would ideally be checked against the corresponding all-location series rather than inferred from the urban series alone.
The urban version is still useful for a narrower question: whether long-run gender differences in attainment remain visible within places where schools, universities, and employment opportunities are often more concentrated. But even there, GPIA cannot explain why a gap exists. Explaining a national observation would require additional evidence on education access, cohort histories, costs, migration, social norms, and policy changes. The index is diagnostic, not causal.
The 84 observations do not represent every country in the world
The comparison uses 84 non-missing country and area observations for the same year, 2022. Countries without a reported value are not coded as zero. Missing data and a genuine GPIA of zero would mean very different things, so treating absence as a numeric value would badly distort the distribution. The result that 41 observations are in the parity band therefore applies to this 84-observation set, not to every country globally.
Cross-country attainment comparisons also require care because national qualifications and education systems do not map perfectly onto one another. UIS uses the International Standard Classification of Education (ISCED) to improve comparability, but countries can still differ in how qualifications are classified and how educational attainment is collected. The underlying data may come from population censuses, household surveys, or labor-force surveys.
Disaggregation can introduce additional uncertainty. This series combines an age threshold, urban residence, educational attainment level, and sex comparison. In sample surveys, smaller subgroups can have wider sampling uncertainty than broad national totals. That is another reason not to overinterpret very small numerical differences around 0.97 or 1.03.
Data source and calculation
The country values come from UNESCO Institute for Statistics indicator EA.2T8.AG25T99.URB.GPIA for 2022. It is the adjusted gender parity index for the attainment rate of completed lower secondary education or higher among the urban population age 25 and older. The analysis uses 84 non-missing observations. The mean, median, band counts, and rankings shown above were calculated directly from those values.
UIS defines educational attainment for adults age 25 and older as the highest level of education attained or completed and cautions that qualifications do not always map perfectly across countries. Its parity-index methodology explains that 1 represents parity and that the adjusted form is designed to make disparities more symmetric around 1. The correct unit for this series is therefore a dimensionless index, not percent.
The central finding is not simply that the median sits close to 1. The 2022 observations split almost evenly between the parity band and values below it: 41 are within 0.97–1.03 and 40 are below 0.97, while only three are above 1.03. At the same time, several exceptionally low values create a long lower tail and pull the average down to 0.918. Reading the parity-band counts together with the lowest observations gives a much clearer picture than any single summary statistic.
Frequently Asked Questions
Does a GPIA of 1 mean the attainment rate is 100%?
No. A GPIA of 1 means the female and male values of the underlying attainment indicator are equal. The actual percentages for women and men must be checked separately.
Why is 0.97–1.03 used as the gender-parity band?
UNESCO UIS commonly uses 0.97–1.03 as a practical parity interval so very small differences around 1 are not overinterpreted. Larger distances from 1 indicate larger relative disparities.
What does a GPIA below 1 mean for this indicator?
Because higher attainment is a favorable outcome, a value below 1 means the female attainment rate is lower relative to the male rate. The index itself is not an attainment percentage.
Should countries with missing data be treated as zero?
No. Missing observations are not zero. This comparison uses only the 84 country and area observations with a 2022 value and leaves other countries as no data.
Related Articles
- Gender Parity in Primary-or-Higher Attainment by Country, 2023
- Gender Parity in At-Least-Some-Primary Attainment, 2023
- Bachelor’s Attainment Gender Gap, 2023
Green Map creates custom-edited map images using open geographic data sources such as geoBoundaries, Natural Earth, OpenStreetMap, and government open data.
These maps are edited visual materials, not raw data files, and are provided for education, documents, presentations, and graphic reference.