Gender gaps in educational attainment among rural adults were far from uniform in 2021. UNESCO Institute for Statistics (UIS) indicator EA.5T8.AG25T99.RUR.GPIA compares women and men in the share of rural adults age 25 and older who completed short-cycle tertiary education or a higher level. The values are an adjusted gender parity index (GPIA), not percentages. Across the 70 countries and areas with 2021 observations, the unweighted median is 1.144 and the mean is 1.036.
GPIA is centered on 1. For a positive attainment indicator such as this one, a value below 1 indicates that the female attainment rate is lower than the male rate, while a value above 1 indicates that the female rate is higher. Only 4 of the 70 observations fall within the 0.97–1.03 practical parity band commonly used by UNESCO and UIS. 24 observations are below 0.97 and 42 are above 1.03, so the dataset contains substantial disparities in both directions.
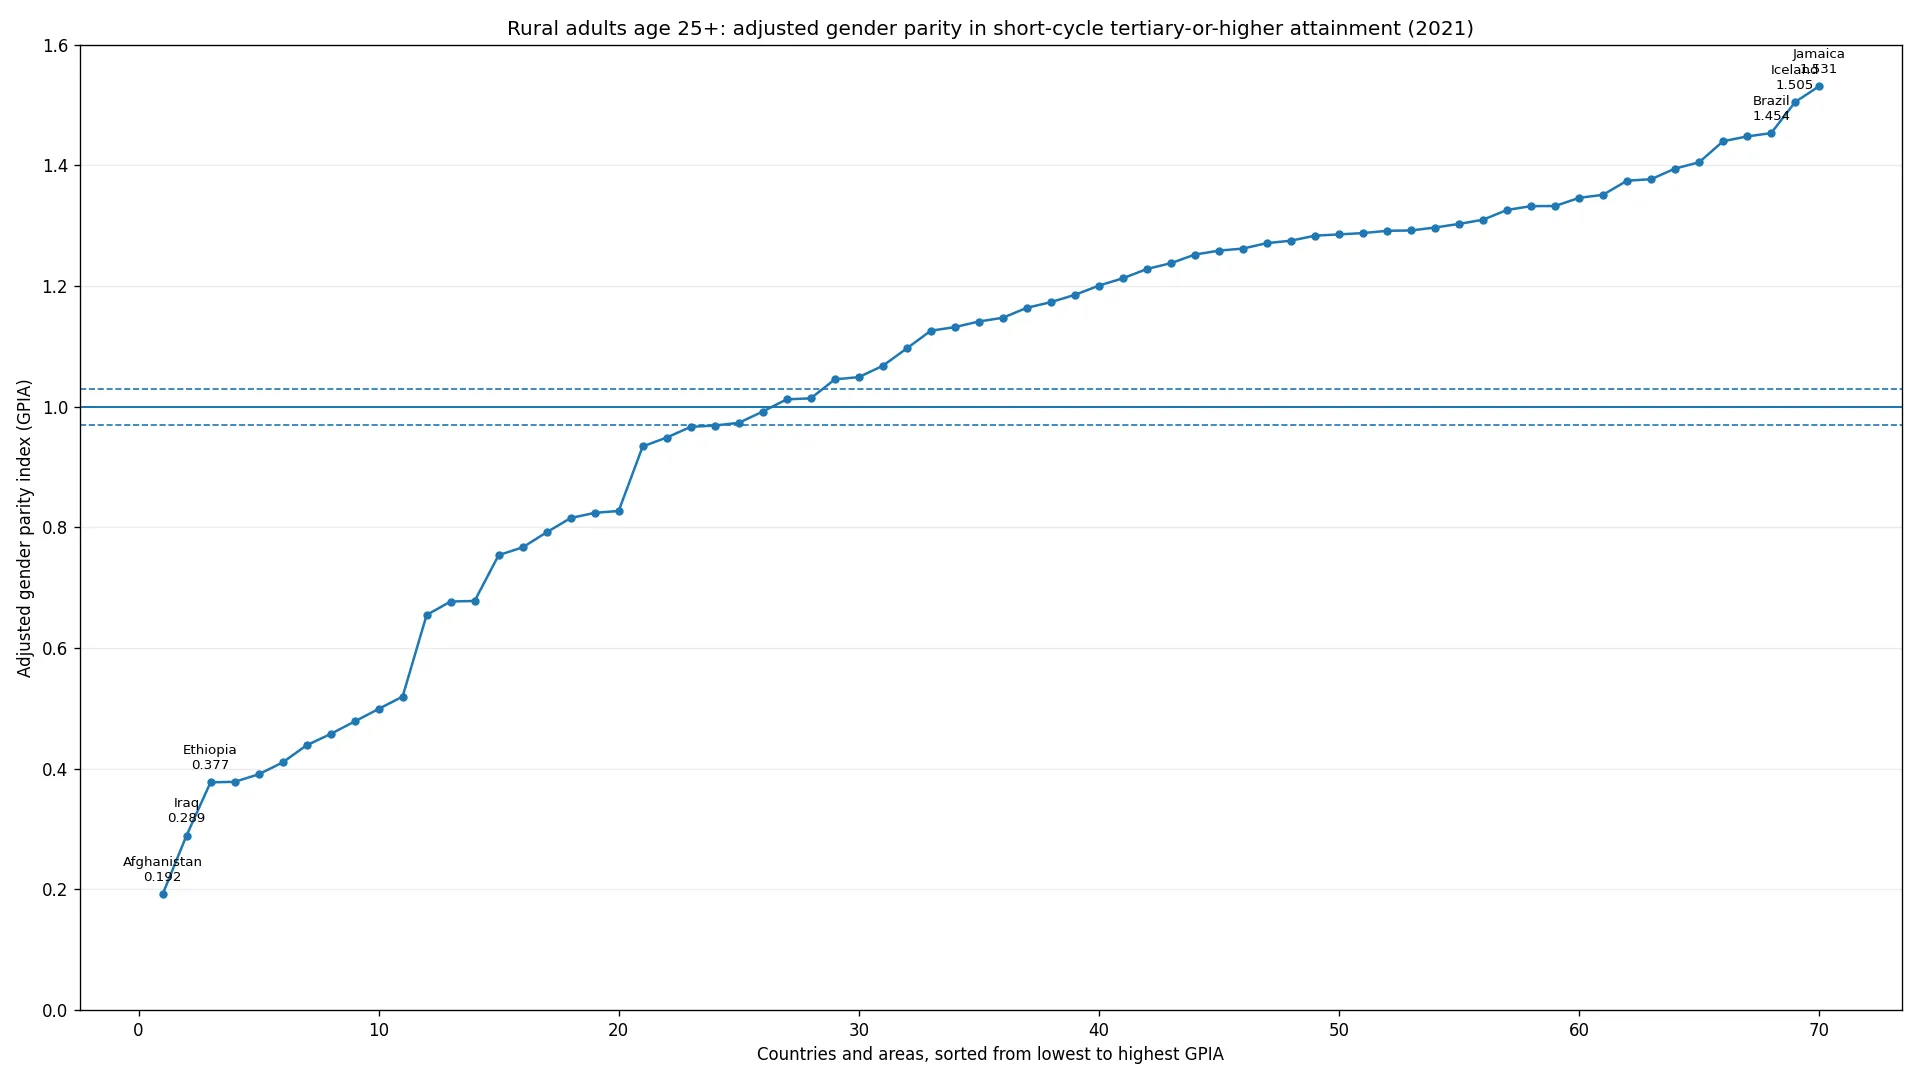
Table of Contents
This is a gender-parity index, not the rural tertiary attainment percentage
The indicator combines several conditions that are easy to lose when the title is shortened. The population is age 25 and older, residence is rural, and the attainment threshold is completion of short-cycle tertiary education or any higher level. Short-cycle tertiary is an internationally harmonized education category below the bachelor’s level, although national qualifications do not map to one identical degree name in every country. Adults who completed bachelor’s, master’s or doctoral education also satisfy the “or higher” threshold.
The published value in this dataset does not tell us what percentage of rural adults crossed that threshold. Instead, it compares the female attainment rate with the male attainment rate. A GPIA of 1.30 therefore does not mean that 130% of rural adults completed tertiary education, and a value of 0.50 does not mean the attainment rate is 50%. Separate female and male attainment percentages are required to calculate the absolute percentage-point gap.
The median is 1.144, but only four observations are inside the parity band
The first quartile of the 70 observations is 0.818, the median is 1.144, and the third quartile is 1.292. A median above 1 means that more than half of the reporting countries and areas lie on the female-higher side of the index. This does not mean that a majority of the world’s rural population has higher female attainment, because the calculation is not population weighted and the dataset does not include every country. Each reported country or area contributes one observation.
Romania at 0.973, Chile at 0.992, Viet Nam at 1.012 and Georgia at 1.014 are the four observations inside the 0.97–1.03 range. They represent only about 5.7% of the 70-country set. Another 24 observations (34.3%) are below 0.97 and 42 (60.0%) are above 1.03. The distribution is therefore not a narrow cluster around parity; many countries sit well to one side or the other.
| GPIA range | Countries/areas | Share of 70 | Direction for this attainment indicator |
|---|---|---|---|
| Below 0.97 | 24 | 34.3% | Female attainment rate lower than male rate |
| 0.97–1.03 | 4 | 5.7% | Near the practical parity range |
| Above 1.03 | 42 | 60.0% | Female attainment rate higher than male rate |
Afghanistan and Iraq are the lowest observations
Afghanistan has the lowest 2021 value at 0.192. Iraq follows at 0.289, Ethiopia at 0.377, Kenya at 0.378, Côte d’Ivoire at 0.391 and Bangladesh at 0.410. Cambodia, Rwanda, Ghana, Uganda and India are also below 0.52. For this favorable attainment measure, values this far below 1 indicate that the female attainment rate is substantially lower than the male attainment rate.
The index alone cannot tell us the absolute female and male percentages or the size of the gap in percentage points. It also cannot identify causes. Rural access to higher education, household resources, transport, labor-market opportunities, migration, social expectations, safety and earlier schooling can all matter in real life, but none of those explanatory variables is included in this cross-sectional GPIA dataset. Country-specific causal claims would require additional evidence.
| Low-value rank | Country/area | 2021 GPIA |
|---|---|---|
| 1 | Afghanistan | 0.192 |
| 2 | Iraq | 0.289 |
| 3 | Ethiopia | 0.377 |
| 4 | Kenya | 0.378 |
| 5 | Côte d’Ivoire | 0.391 |
| 6 | Bangladesh | 0.410 |
| 7 | Cambodia | 0.439 |
| 8 | Rwanda | 0.458 |
| 9 | Ghana | 0.478 |
| 10 | Uganda | 0.499 |
| 11 | India | 0.520 |
| 12 | Peru | 0.655 |
Jamaica and Iceland are above 1.5
At the other end, Jamaica records 1.531 and Iceland 1.505. Brazil is at 1.454, Latvia 1.448, Mongolia 1.440 and Panama 1.405. Estonia, Australia, Sweden and Poland are also well above 1.3. These values indicate a higher female attainment rate than male attainment rate for the underlying rural short-cycle-tertiary-or-higher measure.
Values above 1 need special care because GPIA is adjusted rather than a simple female-to-male ratio. UIS developed the adjusted index so that disparities on opposite sides of 1 are represented more symmetrically and the scale is bounded between 0 and 2. A GPIA of 1.50 should therefore not be translated into a statement that the female rate is exactly 50% higher. The index gives the direction and comparable magnitude of disparity; the original sex-disaggregated rates are needed for a direct ratio.
| High-value rank | Country/area | 2021 GPIA |
|---|---|---|
| 1 | Jamaica | 1.531 |
| 2 | Iceland | 1.505 |
| 3 | Brazil | 1.454 |
| 4 | Latvia | 1.448 |
| 5 | Mongolia | 1.440 |
| 6 | Panama | 1.405 |
| 7 | Estonia | 1.395 |
| 8 | Australia | 1.377 |
| 9 | Sweden | 1.375 |
| 10 | Poland | 1.351 |
| 11 | Hungary | 1.346 |
| 12 | Thailand | 1.333 |
The mean of 1.036 hides a strongly asymmetric distribution
The simple mean, 1.036, looks close to parity. The median, however, is 1.144. That gap between mean and median is a warning against describing the dataset with one average. Very low values such as 0.192 and 0.289 pull the mean downward, while many observations are concentrated between about 1.2 and 1.4. The mean is therefore not the value around which most countries cluster.
A more useful summary combines the parity-band count with the tails. Only four observations are near the practical parity range. Twenty-four are below 0.97 and forty-two are above 1.03. The dataset is simultaneously characterized by a majority on the female-higher side and by a smaller set of extremely low values on the female-lower side. This is why the sorted distribution is more informative than an average alone.
Parity and attainment level answer different questions
A country can have a GPIA close to 1 even when both female and male rural attainment rates are low. It can also have high attainment rates for both sexes but a GPIA farther from 1 if one group has a noticeably higher rate. Gender parity describes relative equality between the two indicators; it does not by itself describe the overall level of education in the population.
The age-25-plus denominator also matters. This is an accumulated adult-attainment measure, not the current university entry rate, annual graduation rate or enrollment rate. Adults from many birth cohorts are combined in one observation. Recent improvements in access for younger women or men can take years to change the overall adult stock, especially where older cohorts experienced very different educational opportunities.
Source and interpretation limits
Country values come from the official UNESCO UIS API for indicator EA.5T8.AG25T99.RUR.GPIA, using the 2021 observations in the dataset. UIS documentation on the adjusted gender parity index explains that GPIA is centered on 1, bounded from 0 to 2 and designed to represent disparities more symmetrically than the unadjusted ratio. Values between 0.97 and 1.03 are commonly interpreted as parity.
All means, medians, quartiles, band counts and rankings here use the 70 reported 2021 country and area observations and give each observation equal weight. Missing countries are not treated as zero. The index does not measure learning quality, earnings, employment outcomes, field of study or the causes of a gender gap. It also does not replace the original female and male attainment percentages when the research question is about absolute attainment levels.
Frequently Asked Questions
Does a GPIA of 1 mean the rural tertiary attainment rate is 100%?
No. A GPIA of 1 means the female and male indicator values are equal. The actual attainment percentages require the sex-disaggregated attainment series.
What does a GPIA above 1 mean for this indicator?
Because educational attainment is a positive indicator, a value above 1 means the female attainment rate is higher than the male rate. The adjusted index should not be read as a simple female-to-male ratio when it is above 1.
What is the 0.97–1.03 range?
It is the practical range commonly used by UNESCO UIS to interpret gender parity. Values near that interval indicate relatively small differences between female and male indicator values.
Is this a current college enrollment or graduation measure?
No. It is based on accumulated educational attainment among rural adults age 25 and older, so it differs from current enrollment, entry and annual graduation rates.
Related Articles
- Where Is Bachelor’s-or-Higher Attainment Most Common Among Rural Adults? (2022)
- Short-Cycle Tertiary Attainment – Latest Values for Adults 25+
- Rural Adult Lower-Secondary-or-Higher Attainment in 2022
Green Map creates custom-edited map images using open geographic data sources such as geoBoundaries, Natural Earth, OpenStreetMap, and government open data.
These maps are edited visual materials, not raw data files, and are provided for education, documents, presentations, and graphic reference.