How similar are girls’ and boys’ outcomes when lower-secondary completion is combined with minimum reading proficiency? UNESCO Institute for Statistics (UIS) adjusted gender parity data for 2022 show that all 70 available country and territory observations are above 1.03. The lowest is Guatemala at 1.050, while Palestine is highest at 1.628. None of the observations falls inside the commonly used 0.97–1.03 parity band.
The underlying concept is UIS SDG indicator 4.1.0, ‘prepared for the future’. It combines completion of an education level with achievement of minimum proficiency in the relevant subject. For lower-secondary reading, the measure reflects the share of the relevant cohort that completes the level and reaches minimum reading proficiency. The dataset used here is the adjusted gender parity index for that favorable outcome.
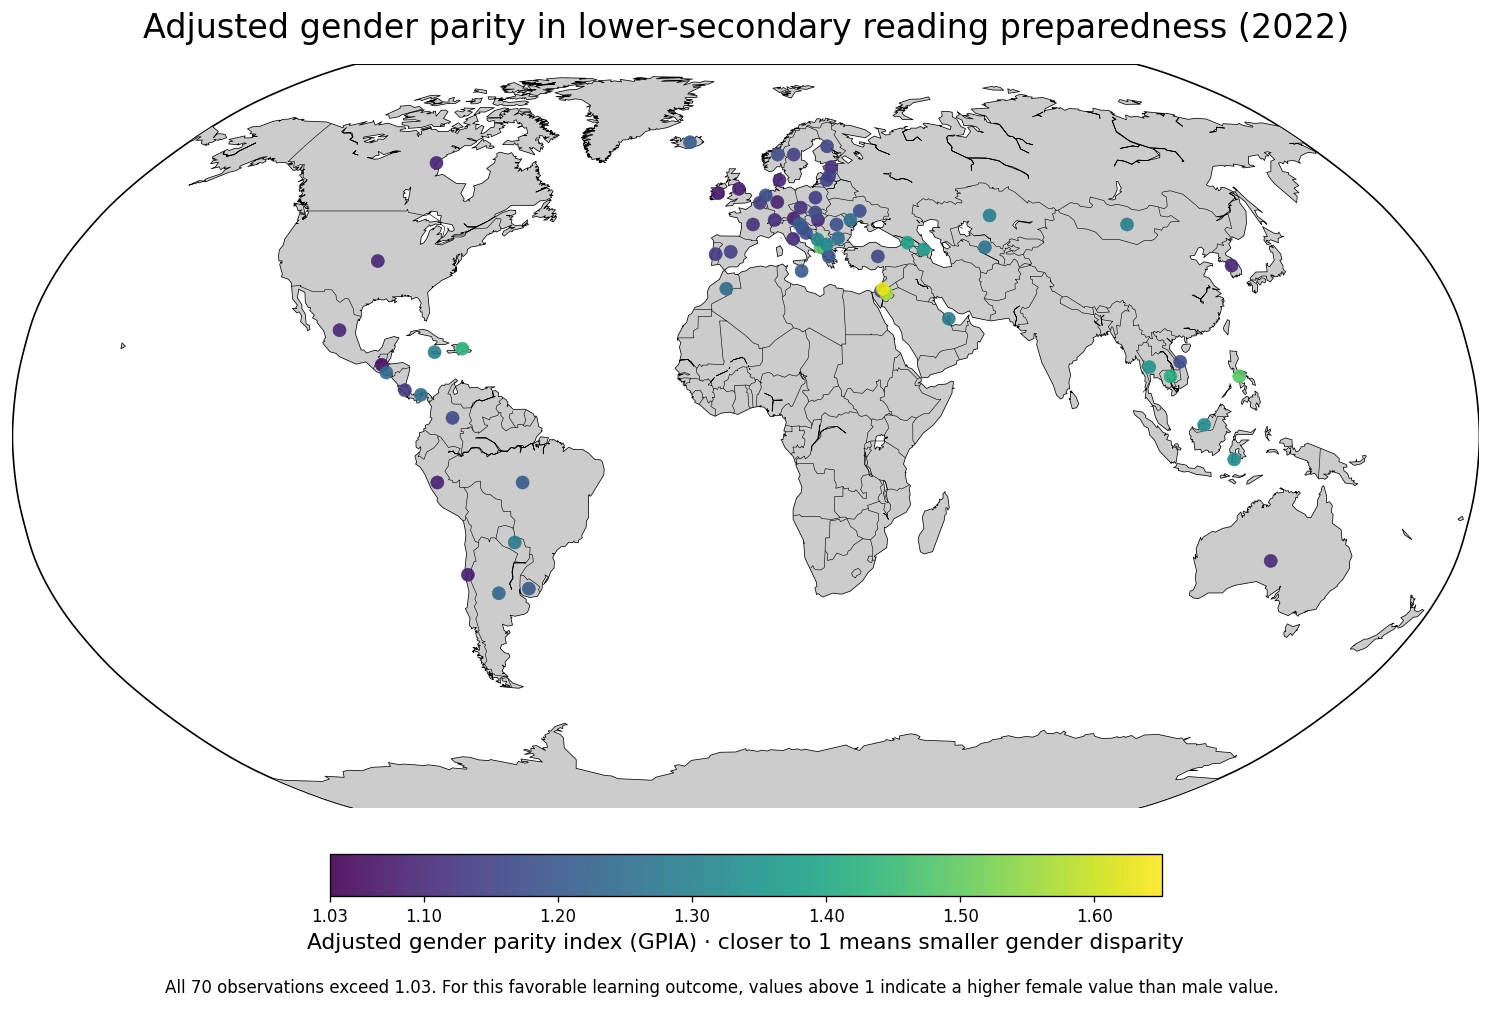
Table of Contents
All 70 observations are above the usual parity band
UIS commonly interprets 0.97–1.03 as gender parity. In this dataset, 0 observations are in that band, 0 are below 0.97, and 70 are above 1.03. Because the underlying reading-preparedness outcome is favorable when higher, an adjusted parity value above 1 indicates that the female value is higher than the male value.
The median GPIA is 1.175 and the mean is 1.210. The middle half of the observations runs from 1.117 to 1.276. Most values are between 1.1 and 1.3, while a small upper tail extends beyond 1.4 and 1.5. The most distinctive feature is not the average, however; it is the fact that every available observation lies on the same side of the parity band.
Palestine and Jordan have the largest adjusted gender disparities
Palestine is highest at 1.628 and Jordan follows at 1.568. The Philippines is at 1.489, Albania at 1.479, the Dominican Republic at 1.431, and Cambodia at 1.416. Georgia, Azerbaijan, Thailand, and Malaysia also appear among the larger values.
| High-end order | Country or territory | 2022 GPIA |
|---|---|---|
| 1 | Palestine | 1.628 |
| 2 | Jordan | 1.568 |
| 3 | Philippines | 1.489 |
| 4 | Albania | 1.479 |
| 5 | Dominican Republic | 1.431 |
| 6 | Cambodia | 1.416 |
| 7 | Georgia | 1.378 |
| 8 | Azerbaijan | 1.368 |
| 9 | Thailand | 1.349 |
| 10 | Malaysia | 1.333 |
| 11 | North Macedonia | 1.322 |
| 12 | Indonesia | 1.321 |
| 13 | Montenegro | 1.314 |
| 14 | Mongolia | 1.296 |
| 15 | Kazakhstan | 1.296 |
A larger value means a larger disparity in the direction of a higher female value for the underlying prepared-for-the-future reading indicator. Because GPIA is adjusted to be symmetric around 1, a value such as 1.628 should not be translated into a statement that the female rate is exactly 62.8% higher. The index is best read by direction and distance from parity.
Even the lowest observations remain above 1.03
Guatemala is the lowest observation at 1.050, yet it still sits above the upper boundary of the usual parity band. Ireland is at 1.071, Chile 1.079, the United Kingdom 1.079, Peru 1.083, Denmark 1.086, Austria 1.087, Germany 1.090, Canada 1.091, and the United States 1.094.
| Low-end order | Country or territory | 2022 GPIA |
|---|---|---|
| 1 | Guatemala | 1.050 |
| 2 | Ireland | 1.071 |
| 3 | Chile | 1.079 |
| 4 | United Kingdom of Great Britain and Northern Ireland | 1.079 |
| 5 | Peru | 1.083 |
| 6 | Denmark | 1.086 |
| 7 | Austria | 1.087 |
| 8 | Germany | 1.090 |
| 9 | Canada | 1.091 |
| 10 | United States of America | 1.094 |
| 11 | Mexico | 1.096 |
| 12 | Republic of Korea | 1.099 |
| 13 | Australia | 1.100 |
| 14 | Italy | 1.108 |
| 15 | Hungary | 1.109 |
The phrase ‘low end’ is therefore relative only to this dataset. These countries are not classified as being inside the parity band under the 0.97–1.03 convention. Even the smallest available value remains on the side where the female underlying indicator is higher.
The 1.10–1.20 band contains the largest group
13 observations are above 1.03 but below 1.10, 27 are from 1.10 to 1.199, and 17 are from 1.20 to 1.299. Another 7 are between 1.30 and 1.399, 4 between 1.40 and 1.499, and 2 are at or above 1.50.
| GPIA band | Countries or territories | Share of observations |
|---|---|---|
| Above 1.03–1.099 | 13 | 18.6% |
| 1.10–1.199 | 27 | 38.6% |
| 1.20–1.299 | 17 | 24.3% |
| 1.30–1.399 | 7 | 10.0% |
| 1.40–1.499 | 4 | 5.7% |
| 1.50 or higher | 2 | 2.9% |
This concentration means the map is not a simple split between parity and non-parity; every point is outside the usual band in the same direction. The meaningful visual comparison is how far each observation lies above 1 rather than whether it crosses the parity threshold.
GPIA is not the female or male reading-preparedness rate itself
The UIS adjusted gender parity methodology starts with a female-to-male ratio and then adjusts values above 1 so that disparities are symmetric around the parity point. The resulting index runs from 0 to 2, with 1 representing equality between female and male values and 0.97–1.03 commonly treated as parity.
A GPIA of 1.2 does not by itself reveal the female percentage or the male percentage. It also does not mean the female percentage is simply 20% higher, because the adjustment changes the scale above 1. To know the absolute learning outcome for each sex, the female and male component indicators are required.
‘Prepared for the future’ combines completion and learning
The UIS concept is broader than a reading test score. It combines the probability of reaching or completing the education level with the probability of achieving minimum proficiency in reading at that level. For lower secondary, the indicator therefore focuses on the share of the relevant cohort that both completes the level and achieves the minimum reading standard.
This matters because assessment results alone can overlook young people who never reach the assessment point. The prepared-for-the-future measure is designed to bring completion and learning together. The GPIA used here then asks whether that combined outcome is similar for girls and boys.
Gender parity and overall learning level are separate questions
A country can have a GPIA close to 1 even if the underlying outcome is low for both sexes, and it can have a high overall outcome while still showing a gender gap. The parity index isolates relative gender difference; it does not rank overall education quality or reading proficiency.
A fuller interpretation would therefore compare the total prepared-for-the-future rate, the female and male component values, completion rates, and minimum reading proficiency. This article stays within what the supplied GPIA can establish: the direction and relative magnitude of the gender gap.
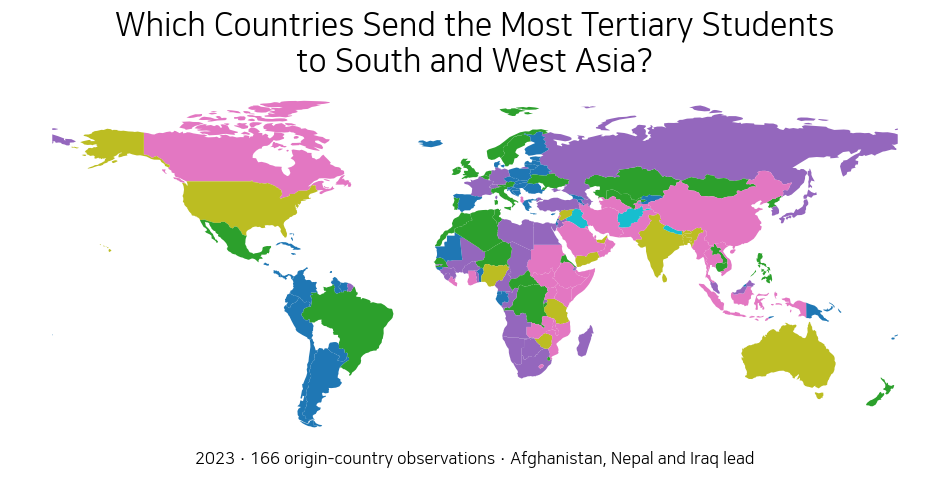
Higher values cluster in parts of Western Asia, Southeast Asia, and the Balkans
The highest values include Palestine and Jordan in Western Asia. The Philippines, Cambodia, Thailand, Malaysia, and Indonesia are relatively high in Southeast Asia, while Albania, Georgia, Azerbaijan, Montenegro, and North Macedonia appear toward the upper end around the Balkans and Caucasus.
Those geographic clusters do not identify causes. Completion, learning conditions, participation, and other gender-related education factors may all matter, but this GPIA dataset contains no causal variables. The map is a useful starting point for locating larger disparities, while causal analysis requires additional country-level evidence.
The comparison covers 70 countries and territories in the same reference year
All 70 observations in the supplied dataset are dated 2022, which avoids mixing recent and older country values. Coverage is still incomplete: this is not every country in the world. The mean and median are therefore unweighted summaries of the available observations, not global population-weighted estimates.
Countries without a 2022 observation are not assigned zero or parity. They are simply left unplotted. Availability of learning-assessment and completion data can differ across countries, which is an important limitation when interpreting the geographic pattern.
Data scope and source
The analysis uses 70 national-level 2022 observations from the UNESCO Institute for Statistics official API indicator PREPFUTURE.2.READ.GPIA. The indicator is the adjusted gender parity index for the proportion of lower-secondary-age children and young people prepared for the future in reading. The mean of 1.210, median of 1.175, bands, and rankings are calculated directly from those observations.
The parity reference point is 1, with 0.97–1.03 commonly used by UIS as the practical parity band. The observed range is 1.050–1.628, so every supplied value is above the upper boundary. Missing countries are not zero-filled, and all 70 statistical rows were matched to representative country locations for the map.
The main takeaway
All 70 available 2022 observations for lower-secondary reading preparedness GPIA are above 1.03. The median is 1.175, with Palestine at 1.628, Jordan at 1.568, and the Philippines at 1.489 among the highest values. For this favorable combined completion-and-reading outcome, the pattern means the female value is higher than the male value in every observed country or territory. GPIA should still be read as a relative gender-parity index, not as the overall level of reading proficiency or as a direct percentage gap.
Frequently Asked Questions
What does a GPIA above 1 mean here?
For this favorable education outcome, it means the female underlying value is higher than the male value. UIS commonly treats 0.97–1.03 as the parity band.
Does a GPIA of 1.5 mean the female rate is 50% higher?
No. Values above 1 are transformed by the adjusted parity formula, so the index should be read by direction and distance from 1 rather than as a simple percentage difference.
Is ‘prepared for the future in reading’ just a reading test score?
No. UIS SDG indicator 4.1.0 combines completion of the education level with achievement of minimum reading proficiency.
Related Articles
Green Map creates custom-edited map images using open geographic data sources such as geoBoundaries, Natural Earth, OpenStreetMap, and government open data.
These maps are edited visual materials, not raw data files, and are provided for education, documents, presentations, and graphic reference.