A 2020 UNESCO Institute for Statistics cross-section shows a highly uneven geography for internationally mobile tertiary students whose country of origin is Japan. Among the 70 destination countries and areas in the extract, the United States has by far the largest reported value at about 14,166 students. The United Kingdom follows at 2,822, Australia at 2,742, Germany at 2,282, and Canada at 1,845. The scale difference between the first and second destinations is more informative than the rank labels alone: the U.S. value is roughly five times the U.K. value.
Adding the 70 observations gives about 32,354 students. This is a sum of the destinations present in the dataset, not a complete count of every Japanese-origin student studying abroad. Within this observed set, the United States accounts for 43.8%, the top three destinations account for 61.0%, and the top ten account for 90.8%. Any destination absent from the extract must be treated as missing from this comparison rather than automatically assigned a value of zero.
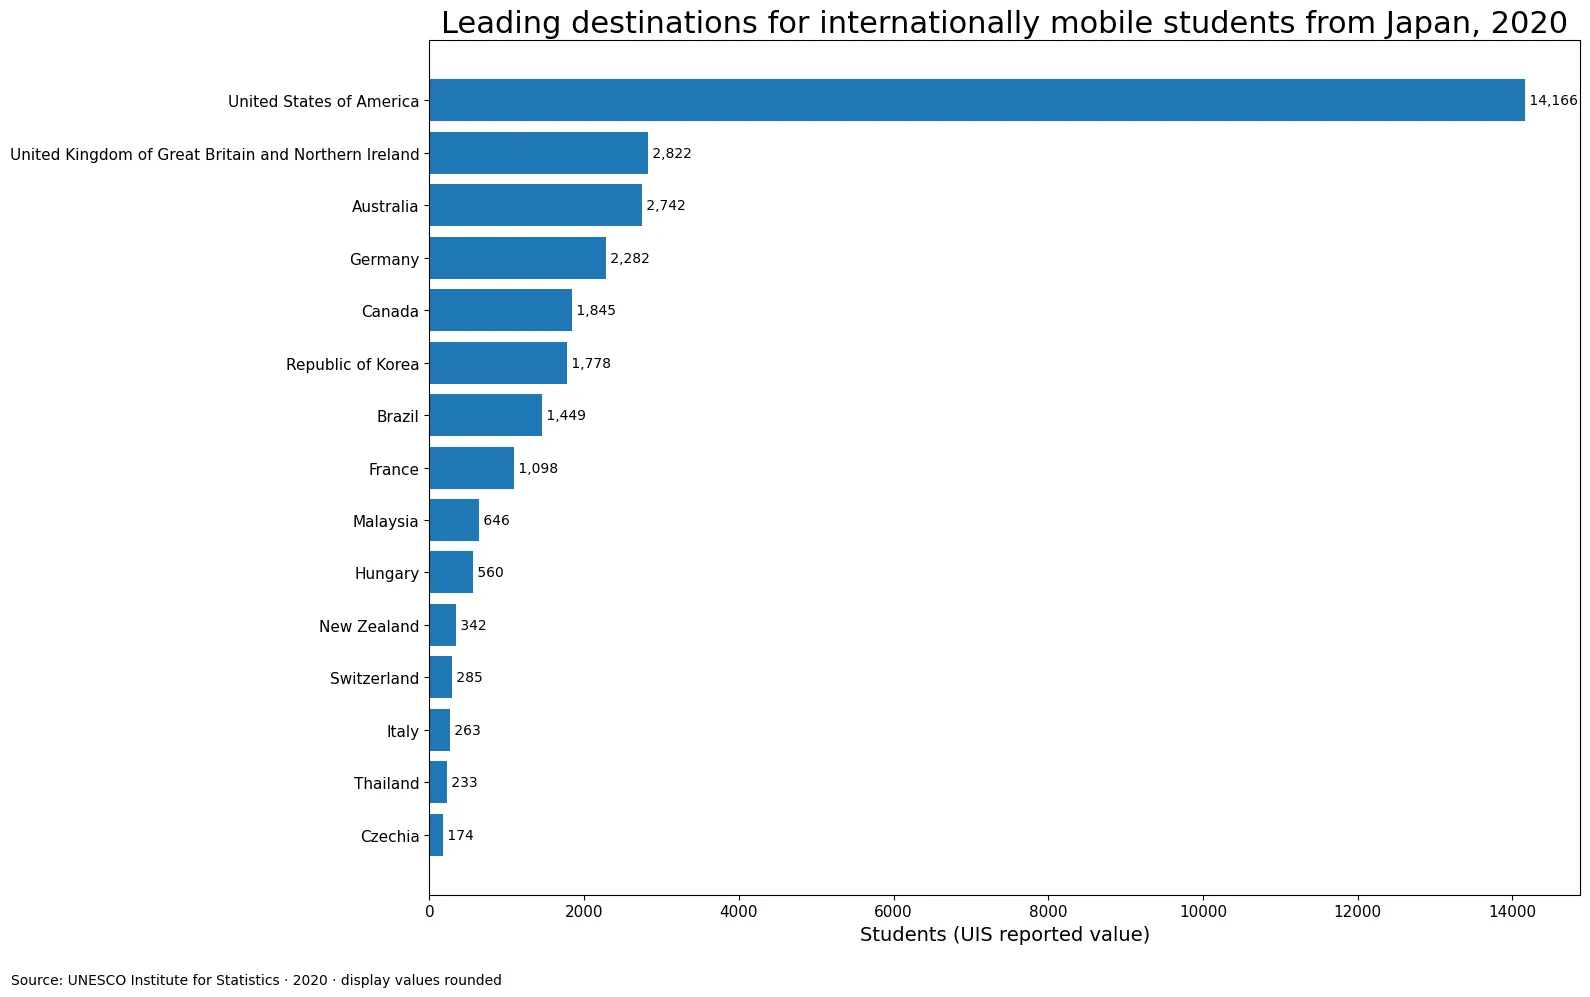
Table of Contents
The rows are destinations, while Japan is the country of origin
The indicator name is “Inbound internationally mobile students from Asia: Students from Japan, both sexes (number).” “Inbound” is written from the perspective of each destination education system. A row for the United States therefore means students from Japan who were counted as internationally mobile students in U.S. tertiary education, not U.S. students studying in Japan. Both sexes are combined, so this series is not designed to measure a gender gap.
UIS defines internationally mobile students as students who physically cross an international border for education and study in a destination country different from their country of origin. For tertiary statistics, the preferred origin concept is the country where the student obtained the upper-secondary qualification. If that cannot be implemented, usual or permanent residence may be used, and citizenship is a last-resort proxy. “Students from Japan” should therefore not be casually rewritten as an exact citizenship count.
The physical-mobility requirement also excludes arrangements that do not involve crossing a border. A student remaining in Japan while taking a distance-learning program from an overseas institution is not international student mobility under this definition. The same distinction matters for branch campuses or foreign programs delivered without the student moving to another country.
One destination dominates the observed distribution
The United States stands apart from the rest of the 2020 destination set. Its reported value of roughly 14,166 is 43.8% of the 70-row sum. The gap to the United Kingdom is more than 11,000 students, while the U.K. and Australia differ by only 80. Germany and Canada form the next tier, followed by another Asian destination at 1,778, Brazil at 1,449, and France at 1,098.
This steep first-place gap means that small differences among second-tier destinations should not be presented with the same emphasis as the U.S. lead. A ranking can make 2nd and 3rd look meaningfully different even when the counts are close, while hiding that 1st is several multiples larger. Reading both the rank and the absolute count avoids that distortion.
| Rank | Destination | Students in 2020 |
|---|---|---|
| 1 | United States of America | 14,166 |
| 2 | United Kingdom of Great Britain and Northern Ireland | 2,822 |
| 3 | Australia | 2,742 |
| 4 | Germany | 2,282 |
| 5 | Canada | 1,845 |
| 6 | Republic of Korea | 1,778 |
| 7 | Brazil | 1,449 |
| 8 | France | 1,098 |
| 9 | Malaysia | 646 |
| 10 | Hungary | 560 |
| 11 | New Zealand | 342 |
| 12 | Switzerland | 285 |
| 13 | Italy | 263 |
| 14 | Thailand | 233 |
| 15 | Czechia | 174 |
The top ten destinations contain 90.8% of the observed total
The concentration extends beyond the first position. The five largest destinations contain 73.7% of the 70-row sum, and the top ten reach 90.8%. Only eight destinations have reported values of at least 1,000. At the other end, 50 of the 70 destinations are below 100 and 28 are below 10. The distribution is therefore not remotely uniform across destinations.
The unweighted median destination has only 23.5 students, while the arithmetic mean is 462.2. The mean is almost 19.7 times the median because the United States and a small number of other large destinations pull it upward. For a skewed count distribution like this, the median describes a typical row better than the mean, while concentration shares describe how much of the observed total sits in the largest destinations.
Asian destinations are visible, but the data do not explain why students choose them
The destination list is geographically diverse. One East Asian destination reports 1,778 students and ranks sixth, Malaysia reports 646 and ranks ninth, and Thailand reports 233 and ranks fourteenth. These observations show that the mobility pattern is not confined to North America, Europe, or Oceania. They do not, however, identify the mechanism behind each flow.
Tuition, language, immigration rules, scholarships, university partnerships, program availability, distance, family ties, and post-study employment pathways could all matter in real student decisions. None of those variables is included in this single indicator. The count can reveal where students were recorded, but it cannot isolate why one destination attracted more students than another or attribute the difference to a specific policy.
A common reference year improves comparability
All 70 observations use 2020, which removes one frequent problem in international country comparisons: mixed reference years. Many “latest available” datasets compare one country’s 2018 observation with another country’s 2023 observation. That is not happening inside this cross-section, so destination counts can be compared without a hidden year mismatch.
A same-year cross-section still cannot establish a trend. The year 2020 was unusual for international education and cross-border mobility, but this file does not provide the preceding or following years for the same indicator. It would be methodologically unsafe to claim that a particular destination rose or fell because of the pandemic, border restrictions, or another policy unless a matched time series supports that conclusion.
Missing destinations should never be converted to zero
The 70-row sum is a useful denominator for describing the concentration of this specific extract, but it is not a global total. International education statistics depend on destination systems reporting enrollment by student origin and on those records being mapped to a common definition. A country that is absent from this extract may have no value available here; absence does not prove that no Japanese-origin students studied there.
This distinction also affects maps and rankings. Filling every unreported country with zero would make missing coverage look like an observed absence of students and would artificially increase the apparent concentration of the destinations that do report. The safer approach is to keep missing observations separate from reported low values.
Some source values are fractional even though the indicator is a count
A few 2020 observations in the extract contain decimals, including the United States, New Zealand, Austria, and Sweden. The statistical calculations in this article retain those reported values. The chart and table round them to the nearest whole student for readability, so adding the displayed integers can differ slightly from calculations made on the source numbers.
The presence of fractional values is a reason to preserve the official series rather than silently forcing every value to an integer before analysis. For most readers, the large-scale pattern is unchanged by rounding: the United States remains dominant, the next several destinations form a much smaller second tier, and most reporting destinations contain comparatively few students.
What this indicator can and cannot answer
- It can compare the reported 2020 destination counts for the 70 countries and areas present in the UIS extract.
- It can show concentration, including the unusually large U.S. share and the steep drop after the leading destinations.
- It cannot explain individual destination choices or estimate causal effects of tuition, visas, scholarships, language, or labor-market policy.
- It cannot be used as a complete global total of Japanese-origin students abroad when destinations outside the 70 reported rows are not represented.
Source, definition, and comparison limits
The statistical source is UNESCO Institute for Statistics indicator 26538. This comparison uses the 2020 national-level observations supplied for the indicator. UIS maintains internationally comparable tertiary mobility statistics using official education reporting systems and the UNESCO-OECD-Eurostat data collection framework.
Comparability is improved by common definitions, but national systems do not always hold identical information for determining a student’s country of origin. UIS therefore specifies a preferred hierarchy of origin concepts. Large differences in destination counts are informative, while very small rank differences deserve more caution. The indicator also measures student mobility, not university quality, affordability, visa openness, or graduate outcomes.
Frequently Asked Questions
Are the countries in this dataset origins or destinations?
They are destinations. Japan is the fixed country of origin, and each row reports the number of internationally mobile students from Japan recorded in that destination in 2020.
Is the sum of the 70 rows the total number of Japanese students studying abroad worldwide?
No. It is only the sum of the destinations included in this extract. Countries without an observation here cannot be assumed to have zero students.
Why do some student-count values contain decimals?
A few UIS observations in this extract are non-integer values. Calculations retain the reported numbers, while chart and table labels are rounded to whole students for readability.
Can the 2020 cross-section show whether a destination was gaining or losing students?
No. Trend claims require comparable observations across multiple years. A single 2020 cross-section can compare destinations at that time but cannot establish increases, declines, or causal effects.
Related Maps
Green Map creates custom-edited map images using open geographic data sources such as geoBoundaries, Natural Earth, OpenStreetMap, and government open data.
These maps are edited visual materials, not raw data files, and are provided for education, documents, presentations, and graphic reference.