How large is student mobility from each origin country to the destination region that UNESCO UIS labels Central and Eastern Europe? Indicator MOR.5T8.40530 reports the number of internationally mobile tertiary students from an origin country who study in Central and Eastern Europe as a percentage of total tertiary enrolment in that origin country. The series combines both sexes and is reported as a percentage.
Across the 113 country and area observations dated 2023, the median is 0.324% while the simple unweighted mean is 2.13%. The mean is much higher because a small number of observations are extremely large: Turkmenistan is 58.95%, Montenegro 20.99%, and the Republic of Moldova 20.29%. 32 observations are at least 1%, 10 are at least 5%, and only 3 reach 20% or more.
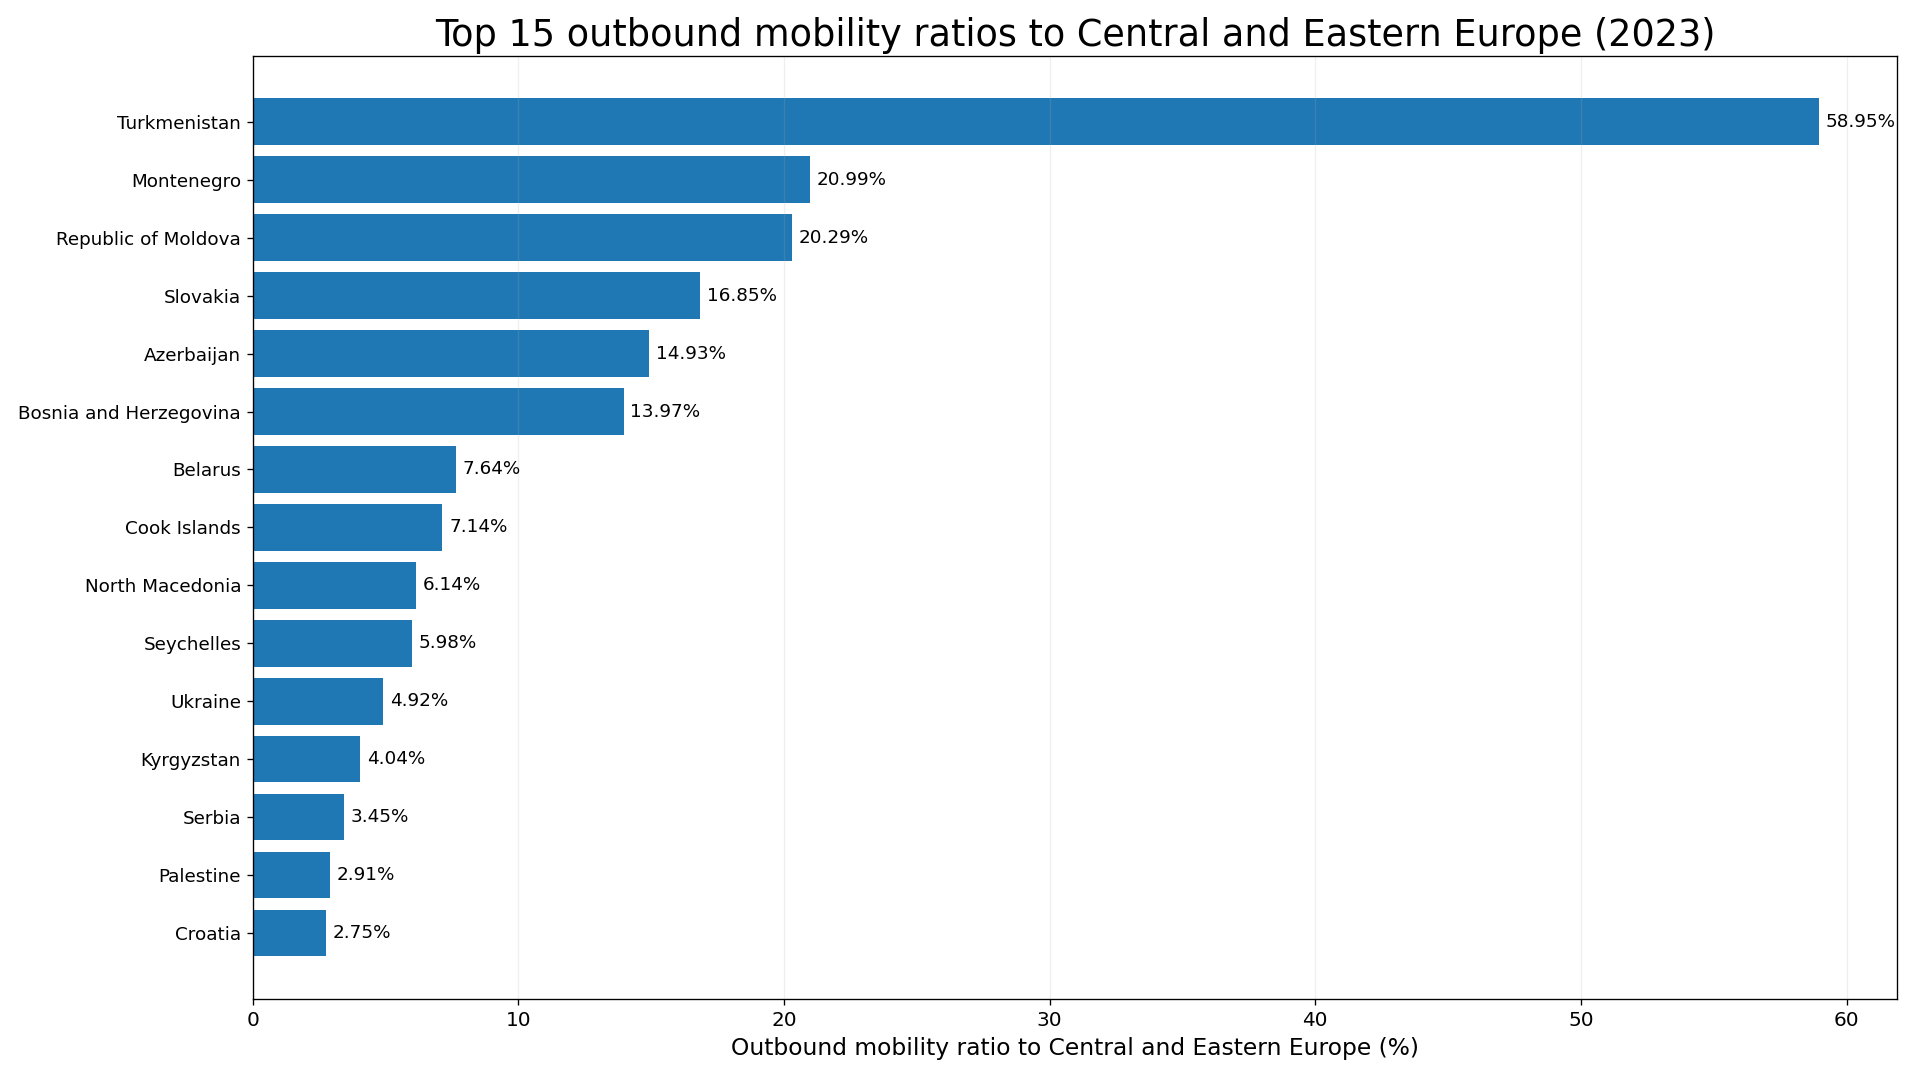
Table of Contents
The denominator is domestic tertiary enrolment, not all outbound students
The most important interpretation point is the denominator. A value of 10% does not mean that 10% of a country’s students abroad chose Central and Eastern Europe. UIS defines the outbound mobility ratio using total tertiary enrolment in the origin country as the denominator. For this destination-specific series, a 10% value means that the number of internationally mobile tertiary students from the origin country studying in Central and Eastern Europe is equivalent to about 10% of the origin country’s total tertiary enrolment.
A different calculation would be needed to answer the question, “What share of all outbound students from this country study in Central and Eastern Europe?” That destination-share measure would use all outbound internationally mobile students as the denominator. MOR.5T8.40530 instead measures the scale of the flow to one destination region relative to the size of the home tertiary system. Confusing those two denominators can produce a completely different interpretation.
The 2023 distribution is highly skewed
The first quartile is 0.106%, the median 0.324%, and the third quartile 1.222%. In other words, the middle half of the reported observations lies roughly between 0.106% and 1.222%. The simple mean of 2.13% sits far above the median because the upper tail is unusually long.
There are 18 observations below 0.05%, whereas 32 are at or above 1%. This combination shows why the mean alone is not a good description of a typical country row. Most reported countries are clustered at relatively low percentages, while a small group reaches several percentage points or double digits. Reading the median, quartiles and upper outliers together gives a clearer picture of the dataset.
Turkmenistan is a very large outlier at 58.95%
Turkmenistan has the highest observation at 58.95%. It is followed by Montenegro at 20.99%, the Republic of Moldova at 20.29%, Slovakia at 16.85%, Azerbaijan at 14.93%, and Bosnia and Herzegovina at 13.97%. The gap between the highest and second-highest observations is roughly 38 percentage points.
The ratio itself does not explain why the value is high. The numerator is the number of mobile tertiary students studying in one destination region, and the denominator is total tertiary enrolment in the origin country. The size of the domestic tertiary system, the scale of outbound mobility, destination preferences, and statistical coverage can all affect the ratio. A high value therefore describes relative scale; it is not by itself evidence about education quality or the success of a particular policy.
Only three observations reach 20% or more
Turkmenistan, Montenegro and the Republic of Moldova are the only observations at or above 20%. Expanding the threshold to 10% adds Slovakia, Azerbaijan, and Bosnia and Herzegovina, bringing the count to 6. 10 observations are at least 5%. The group is small relative to the full 113-row dataset, but its large values strongly influence the mean.
These percentages should not be relabeled as a ranking of the absolute number of students sent abroad. A large tertiary system and a small tertiary system can have the same ratio while sending very different numbers of students. Absolute student counts require the corresponding UIS indicator for outbound internationally mobile tertiary students by host region rather than a ratio with domestic enrolment as the denominator.
| Country or area | ISO3 | Outbound mobility ratio |
|---|---|---|
| Turkmenistan | TKM | 58.95% |
| Montenegro | MNE | 20.99% |
| Republic of Moldova | MDA | 20.29% |
| Slovakia | SVK | 16.85% |
| Azerbaijan | AZE | 14.93% |
| Bosnia and Herzegovina | BIH | 13.97% |
| Belarus | BLR | 7.64% |
| Cook Islands | COK | 7.14% |
| North Macedonia | MKD | 6.14% |
| Seychelles | SYC | 5.98% |
| Ukraine | UKR | 4.92% |
| Kyrgyzstan | KGZ | 4.04% |
| Serbia | SRB | 3.45% |
| Palestine | PSE | 2.91% |
| Croatia | HRV | 2.75% |
Selected large countries are mostly well below 1%
Among selected comparison cases, Germany is 0.397%, France 0.228%, the United Kingdom 0.165%, China 0.110%, and India 0.120%. The United States is 0.020%, Japan 0.036%, Canada 0.072%, and Australia 0.014%. These values all use the same denominator: total tertiary enrolment in the origin economy.
The Republic of Korea records 0.066% in 2023. That low destination-specific ratio should not be read as a low overall level of international student mobility. Students studying in North America and Western Europe, East Asia and the Pacific, or other UIS destination regions are outside the numerator of this particular series. The indicator answers a narrowly defined geographic question about one host region.
| Country | 2023 ratio |
|---|---|
| Germany | 0.397% |
| France | 0.228% |
| United Kingdom of Great Britain and Northern Ireland | 0.165% |
| China | 0.110% |
| India | 0.120% |
| Republic of Korea | 0.066% |
| Canada | 0.072% |
| Japan | 0.036% |
| United States of America | 0.020% |
| Australia | 0.014% |
Central and Eastern Europe is a UIS destination-region category
The destination label Central and Eastern Europe comes from the UIS indicator taxonomy. It should not automatically be treated as identical to current European Union membership, a contemporary political bloc, or any informal everyday definition of eastern Europe. Statistical regional groupings can be maintained for comparability even when other organizations use different geographic classifications.
The direction also matters. A high value for Slovakia, for example, does not mean Slovakia receives a large number of international students from the region. The row is organized by student origin. It measures students originating from Slovakia who are studying in the destination region defined by UIS, relative to Slovakia’s total tertiary enrolment. Reversing origin and destination would answer a different question.
Internationally mobile students are not simply every student with foreign citizenship
UIS international student mobility statistics are built around the idea of crossing an international border for the purpose of study. That concept can differ from datasets that classify students only by citizenship. A student with foreign citizenship who has long resided in the host country may be treated differently from a student who moved across a border specifically for education, depending on the statistical system and available origin information.
This indicator belongs to tertiary education and covers the UIS tertiary levels rather than a single degree type. It should not be described as a bachelor-only measure, a graduate-school-only measure, or a statistic for secondary-school exchange students. Keeping the education level, mobility definition, origin country and destination region aligned is essential for valid comparisons.
A high ratio is not a quality ranking or proof of brain drain
A high outbound mobility ratio can indicate a large student outflow relative to the size of the domestic tertiary system, but it cannot identify the cause. Scholarship programmes, language networks, admission rules, cost, recognition of qualifications, historical ties, distance, migration networks, and many other factors could matter. Those explanations require separate evidence and cannot be inferred from this percentage alone.
Student mobility also does not automatically equal permanent brain drain. The indicator does not report whether students return after graduation, move to another country, remain in the host region, or enter the labour market abroad. It is best used as a descriptive measure of the relative scale of student movement to this destination region, not as a direct measure of long-term skilled migration.
A single 2023 cross-section cannot show a trend
All observations used here are dated 2023, which makes the cross-country comparison internally consistent in reference year. It does not tell us whether a country’s ratio increased or decreased from earlier years. Trend claims would require a time series of MOR.5T8.40530 observations constructed with consistent country and indicator definitions.
International student mobility can respond to visa policy, exchange rates, conflict, scholarships, university capacity, and temporary travel restrictions. A high value in one year may therefore be persistent or temporary. The 2023 cross-section is useful for describing where countries sit in the same reference year, while causal explanations and changes over time should be tested with additional data.
The 113 observations are not a complete list of every country
The 2023 dataset used here contains 113 reported countries and areas. It does not contain a value for every country in the world. A missing row is therefore not treated as 0%. Missing statistical coverage and a measured zero are different states, and replacing missing values with zero would create observations that UIS did not report.
The tables and chart use only the actual non-missing rows. Separately reported areas may appear alongside sovereign states because the statistical database preserves its reporting units. No additional country values were inferred, interpolated, or filled from other sources. This keeps the comparison tied to the official observations supplied for the indicator.
Why the median is more informative than the mean here
The mean of 2.13% is strongly affected by the 58.95% Turkmenistan observation and several other double-digit values. The median of 0.324% is much less sensitive to those extremes and better represents the center of the ordered country rows. The third quartile is only 1.222%, meaning three quarters of the observations are at or below roughly 1.22%.
Saying only that the average is around 2.13% would therefore make the typical reported country seem more mobile toward this destination region than the distribution actually suggests. For a strongly skewed international dataset, the median, quartiles, threshold counts, and outliers should be read together rather than relying on a single summary statistic.
Data source and calculation notes
Country and area values come from the UNESCO Institute for Statistics API, indicator MOR.5T8.40530. The UIS Data Browser Glossary defines the outbound mobility ratio as students from a given country studying abroad expressed as a percentage of total tertiary enrolment in that country. MOR.5T8.40530 applies that ratio to the host-region category Central and Eastern Europe.
All summary statistics, thresholds and country comparisons are calculated from the 113 non-missing 2023 observations. Percentages are not population-weighted or enrolment-weighted across countries; the mean is a simple average of country/area rows. Missing values are not converted to zero, and no unreported values are estimated.
Frequently Asked Questions
Does a 10% ratio mean 10% of outbound students chose Central and Eastern Europe?
No. The denominator is total tertiary enrolment in the origin country, not all outbound students. A 10% value means the number studying in this destination region is equivalent to about 10% of domestic tertiary enrolment.
Which country has the highest 2023 value?
Turkmenistan is highest at 58.95%, followed by Montenegro at 20.99% and the Republic of Moldova at 20.29%.
Does a high ratio mean the domestic tertiary system has low quality?
Not necessarily. The indicator measures the relative scale of student mobility to one destination region. It does not measure teaching quality or identify the causes of mobility.
Are countries without a 2023 value treated as zero?
No. Missing observations are left missing. A lack of reported data is not the same as a measured value of zero.
Related Articles
- Private Tertiary Enrolment Share by Country
- Engineering, Manufacturing & Construction Share of Tertiary Graduates
- Bachelor’s-or-Higher Educational Attainment by Country
Green Map creates custom-edited map images using open geographic data sources such as geoBoundaries, Natural Earth, OpenStreetMap, and government open data.
These maps are edited visual materials, not raw data files, and are provided for education, documents, presentations, and graphic reference.