How much of annual spending in public universities and other tertiary institutions goes to buildings, major renovations, heavy equipment and other long-lived assets? UNESCO Institute for Statistics indicator XSPENDP.5T8.FDPUB.FNCAP measures capital expenditure as a percentage of total educational expenditure in public tertiary institutions.
Among the 77 country and area observations dated 2021, the median capital share is 8.3% and the mean is 12.4%. 31 observations are at or above 10%, 9 are at or above 20%, and 5 are at or above 30%. At the other end, 19 observations are below 5%.
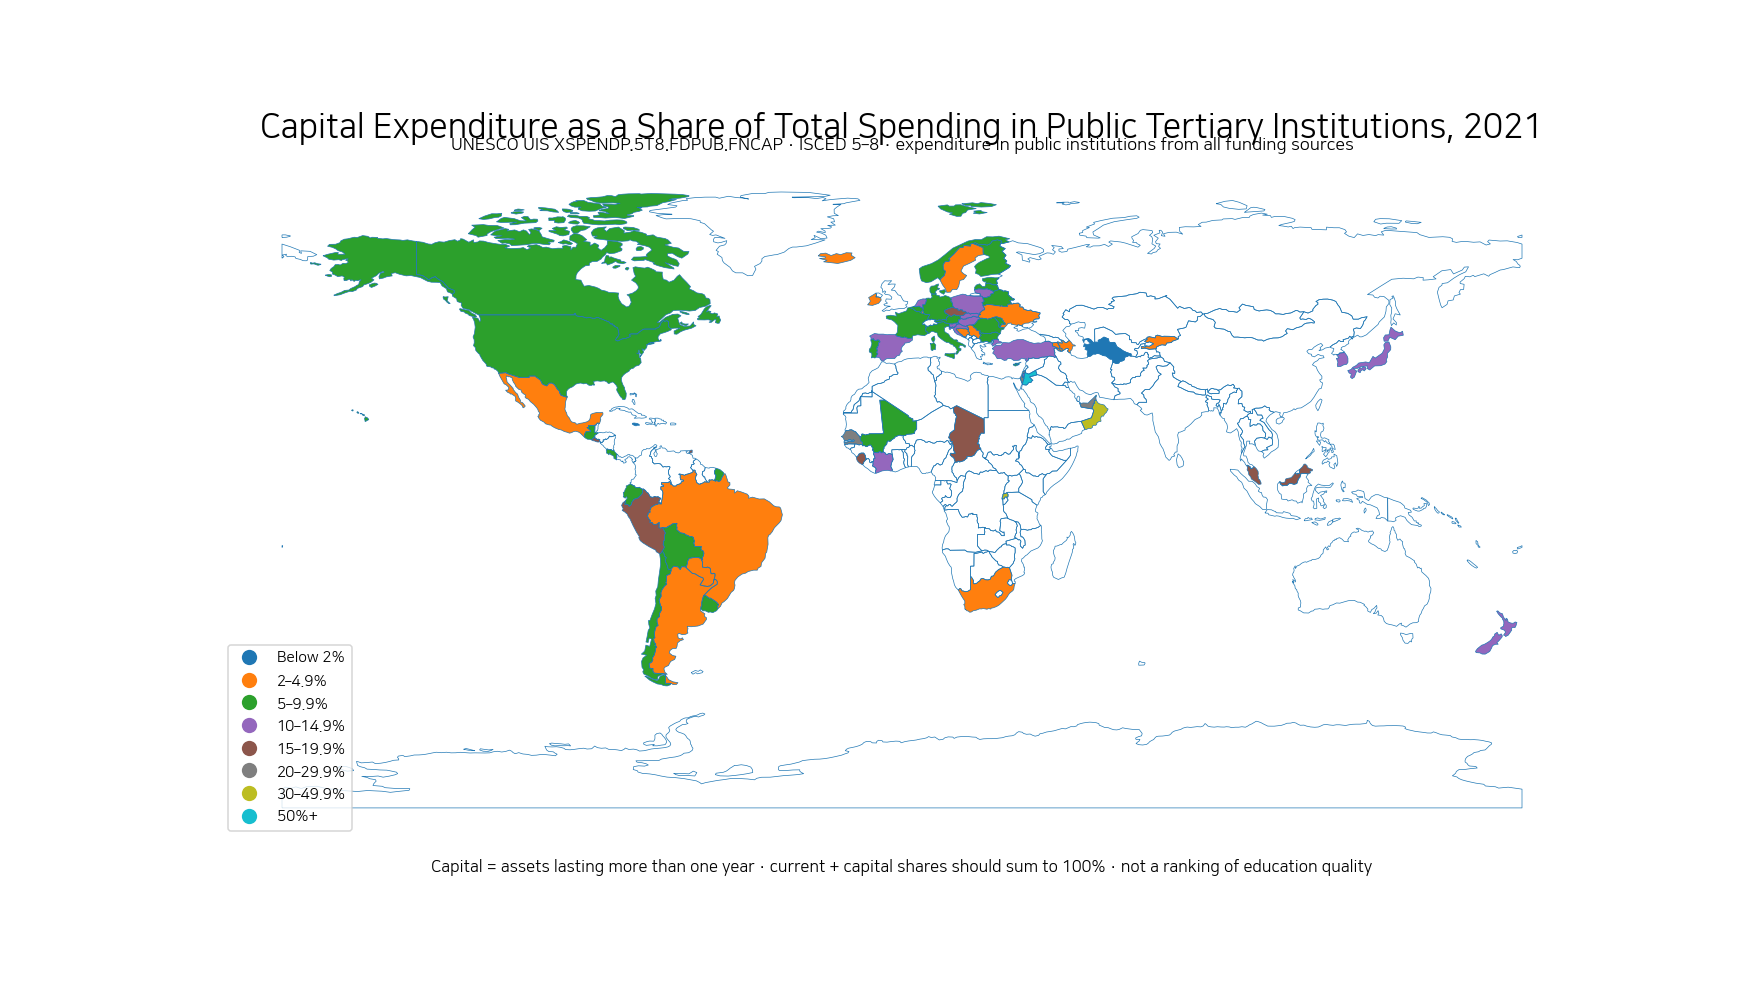
Table of Contents
Capital expenditure covers long-lived educational assets
UIS defines capital expenditure on education as spending on goods or assets that yield benefits for more than one year. It includes construction, renovation and major repairs of buildings, along with heavy equipment and vehicles.
Not every durable item is treated as capital expenditure. The UIS formal-education survey manual instructs countries to report smaller equipment such as computers, desks and chairs, as well as schoolbooks and teaching materials, under current expenditure even when some items may last for more than one year. Depreciation is also excluded from capital expenditure.
The denominator is total educational expenditure in public tertiary institutions
This indicator divides spending in public tertiary institutions by type—current and capital—and expresses the capital component as a percentage of total educational expenditure.
It is not the share of the national budget devoted to tertiary education, and it is not tertiary spending as a percentage of GDP. It describes the composition of spending inside public tertiary institutions.
Current and capital shares should sum to 100%
UIS metadata for educational expenditure by nature of spending state that the percentage shares of current and capital expenditure should add to 100% of total educational expenditure in public institutions.
A capital share of 13.6%, for example, therefore corresponds conceptually to about 86.4% current expenditure in the same classification. A higher capital share means a larger part of that year’s spending was directed toward long-lived assets, not necessarily that current spending fell in absolute currency terms.
The median across the 77 observations is 8.3%
The first quartile is 5.0%, the median 8.3% and the third quartile 13.3%. 31 observations are at least 10%, 17 at least 15%, and 9 at least 20%.
19 observations are below 5% and 3 are below 2%. The wide range partly reflects where countries happened to be in their construction and investment cycles during 2021.
Nine countries and areas are at or above 20%
The 20%+ group includes the Cayman Islands at 100.0%, Saint Kitts and Nevis 72.7%, Jordan 63.5%, Oman 33.2%, Rwanda 33.2%, Senegal 27.0%, Malta 26.1%, the United Arab Emirates 23.3% and Israel 22.4%.
These values indicate a relatively large share of public-tertiary expenditure going to long-lived assets during the reporting year. They do not reveal the total amount of money spent. A 30% share in a small system can represent far less money than a 10% share in a very large system.
| Country or area | ISO3 | Capital share | Implied current share |
|---|---|---|---|
| Cayman Islands | CYM | 100.0% | 0.0% |
| Saint Kitts and Nevis | KNA | 72.7% | 27.3% |
| Jordan | JOR | 63.5% | 36.5% |
| Oman | OMN | 33.2% | 66.8% |
| Rwanda | RWA | 33.2% | 66.8% |
| Senegal | SEN | 27.0% | 73.0% |
| Malta | MLT | 26.1% | 73.9% |
| United Arab Emirates | ARE | 23.3% | 76.7% |
| Israel | ISR | 22.4% | 77.6% |
| Trinidad and Tobago | TTO | 19.1% | 80.9% |
| Sierra Leone | SLE | 19.0% | 81.0% |
| Chad | TCD | 18.9% | 81.1% |
| El Salvador | SLV | 18.2% | 81.8% |
| Malaysia | MYS | 17.8% | 82.2% |
| Peru | PER | 16.1% | 83.9% |
A 100% value should not be treated as a permanent normal level
The Cayman Islands report 100%, the maximum in the dataset. UIS instructs countries to report capital expenditure in the year payment for the asset occurs, even when the asset will be used for many years.
A major building or infrastructure payment can therefore push the annual capital share unusually high. The values for Saint Kitts and Nevis at 72.7% and Jordan at 63.5% are also better interpreted alongside a multi-year time series rather than as permanent structural ratios.
Two observations are below 1%
Jamaica records 0.07% and Turkmenistan 0.13%. Barbados is 1.7%, while Kyrgyzstan and Iceland are about 2.0%.
Low annual capital shares do not automatically imply underinvestment in facilities. A system may have completed major projects in earlier years or may simply have had a year dominated by salaries, services and operation of existing infrastructure.
| Low capital-share country or area | ISO3 | Capital share |
|---|---|---|
| Jamaica | JAM | 0.1% |
| Turkmenistan | TKM | 0.1% |
| Barbados | BRB | 1.7% |
| Kyrgyzstan | KGZ | 2.0% |
| Iceland | ISL | 2.0% |
| Azerbaijan | AZE | 2.5% |
| Ireland | IRL | 2.6% |
| Mexico | MEX | 2.6% |
| Brazil | BRA | 2.6% |
| Argentina | ARG | 2.7% |
| Luxembourg | LUX | 2.7% |
| Armenia | ARM | 2.9% |
| Serbia | SRB | 3.2% |
| Bosnia and Herzegovina | BIH | 3.6% |
| Sweden | SWE | 3.7% |
Major comparison cases range from roughly 2% to 14%
The United States is 8.3%, Japan 12.7%, Germany 8.9%, France 9.0%, Canada 7.7%, Italy 9.4%, Norway 7.9%, Sweden 3.7% and Finland 5.1%.
The Republic of Korea is included as one comparison row only. Under the V9 country-focus contract it is not materially notable, so it is not used in the title, metadata or section headings.
| Country | Capital share | Implied current share |
|---|---|---|
| United States | 8.3% | 91.7% |
| Japan | 12.7% | 87.3% |
| Germany | 8.9% | 91.1% |
| France | 9.0% | 91.0% |
| Canada | 7.7% | 92.3% |
| Italy | 9.4% | 90.6% |
| Norway | 7.9% | 92.1% |
| Sweden | 3.7% | 96.3% |
| Finland | 5.1% | 94.9% |
| New Zealand | 12.2% | 87.8% |
| Singapore | 5.0% | 95.0% |
| Spain | 13.3% | 86.7% |
| Republic of Korea | 13.6% | 86.4% |
| Brazil | 2.6% | 97.4% |
| Mexico | 2.6% | 97.4% |
| South Africa | 4.0% | 96.0% |
| United Arab Emirates | 23.3% | 76.7% |
| Israel | 22.4% | 77.6% |
| Malaysia | 17.8% | 82.2% |
A higher capital share does not mean a higher total level of tertiary investment
This is a spending-composition indicator. A system with a 20% capital share does not necessarily spend more on tertiary education than a system with a 10% share.
Comparing the absolute scale of investment requires total expenditure amounts, enrolment, spending per student, purchasing power and other financial indicators. This measure is closer to ‘what was spending used for?’ than ‘how much was spent?’.
The indicator is not a ranking of education quality
Construction and major equipment can improve teaching and research environments, but the capital share alone cannot measure teaching quality, research output, completion, employment outcomes or student experience.
A mature tertiary system with adequate facilities may reasonably devote a larger share of annual expenditure to staff and operation. A rapidly expanding system may temporarily need a much larger capital share. Appropriate spending composition depends on context.
The scope is public tertiary institutions
The indicator covers public tertiary institutions. In systems with a large private higher-education sector, the figure should not automatically be generalized to the spending structure of all tertiary institutions.
UIS metadata describe educational expenditure in public institutions from all funding sources, classified by current and capital spending. Reporting coverage and national accounting structures can still differ, which is another reason to avoid overly precise rankings.
Payment timing can create sharp year-to-year changes
UIS instructs countries to report capital spending in the year payment is made on an asset, even when the asset is financed over time or used for many years.
This makes annual capital shares naturally volatile. A three- to five-year series is usually more informative for identifying sustained investment strategy than a single year viewed in isolation.
Small equipment can remain current expenditure
Everyday language may treat computers, desks or teaching materials as assets, but UIS education-finance rules classify minor equipment, schoolbooks and teaching materials as current expenditure rather than capital expenditure.
The ‘capital’ category is therefore a specific accounting concept focused on major long-lived assets, not a catch-all category for every item that lasts longer than one academic year.
The 2021 extract contains 77 countries and areas
This is not a complete list of every country. The finding that nine observations are at or above 20% applies to the 77 country and area observations in this same-year extract.
A missing country does not mean zero capital expenditure. It means no 2021 value is present in the current dataset, so missing observations remain unclassified on the map.
Blank map areas do not mean zero
Of the 77 source observations, 70 match separate polygons in the low-resolution world boundary layer used here. Small islands and territories can have valid statistics without a visible polygon.
The map uses distribution-aware bands below 2%, 2–4.9%, 5–9.9%, 10–14.9%, 15–19.9%, 20–29.9%, 30–49.9% and 50%+. Missing values are never filled with zero.
Data source and interpretation
Country values come from the UNESCO UIS Data Browser for XSPENDP.5T8.FDPUB.FNCAP, using the 2021 observations. The capital-expenditure definition follows the UIS Glossary.
UIS defines educational expenditure by nature of spending in public institutions as expenditure from all funding sources classified into current and capital components, whose percentage shares should add to total educational expenditure. The source package already identifies UNESCO UIS correctly as the provider, so no provider correction is required.
Frequently Asked Questions
What counts as capital expenditure on education?
It includes long-lived assets such as construction, major renovation and repairs, heavy equipment and vehicles.
Does a higher capital share mean a country spends more on tertiary education?
No. It shows the composition of total spending, not the absolute amount of spending or spending per student.
Do current and capital expenditure shares add to 100%?
Under the UIS classification of expenditure by type in public institutions, current and capital shares should add to 100% of total educational expenditure.
Are computers and desks always capital expenditure?
No. UIS survey guidance treats smaller equipment such as computers, desks and chairs, along with schoolbooks and teaching materials, as current expenditure.
Related Articles
- Government Education Spending as a Share of GDP
- Post-Secondary Attainment for Adults 25+
- Bachelor’s-or-Higher Educational Attainment by Country
Green Map creates custom-edited map images using open geographic data sources such as geoBoundaries, Natural Earth, OpenStreetMap, and government open data.
These maps are edited visual materials, not raw data files, and are provided for education, documents, presentations, and graphic reference.