The gender composition of internationally mobile tertiary students from Asia differs substantially across destination countries. UNESCO Institute for Statistics indicator E.5T8.FOREIGN.ORG21000930.GPIA reports the adjusted gender parity index (GPIA) for inbound mobile tertiary students whose origin region is Asia.
Among the 84 destination observations dated 2023, 8 fall within the 0.97–1.03 parity band. 20 have more women than men according to the parity direction, while 56 have more men than women. The Republic of Korea records 1.249, indicating more women than men among the observed Asia-origin mobile tertiary students.
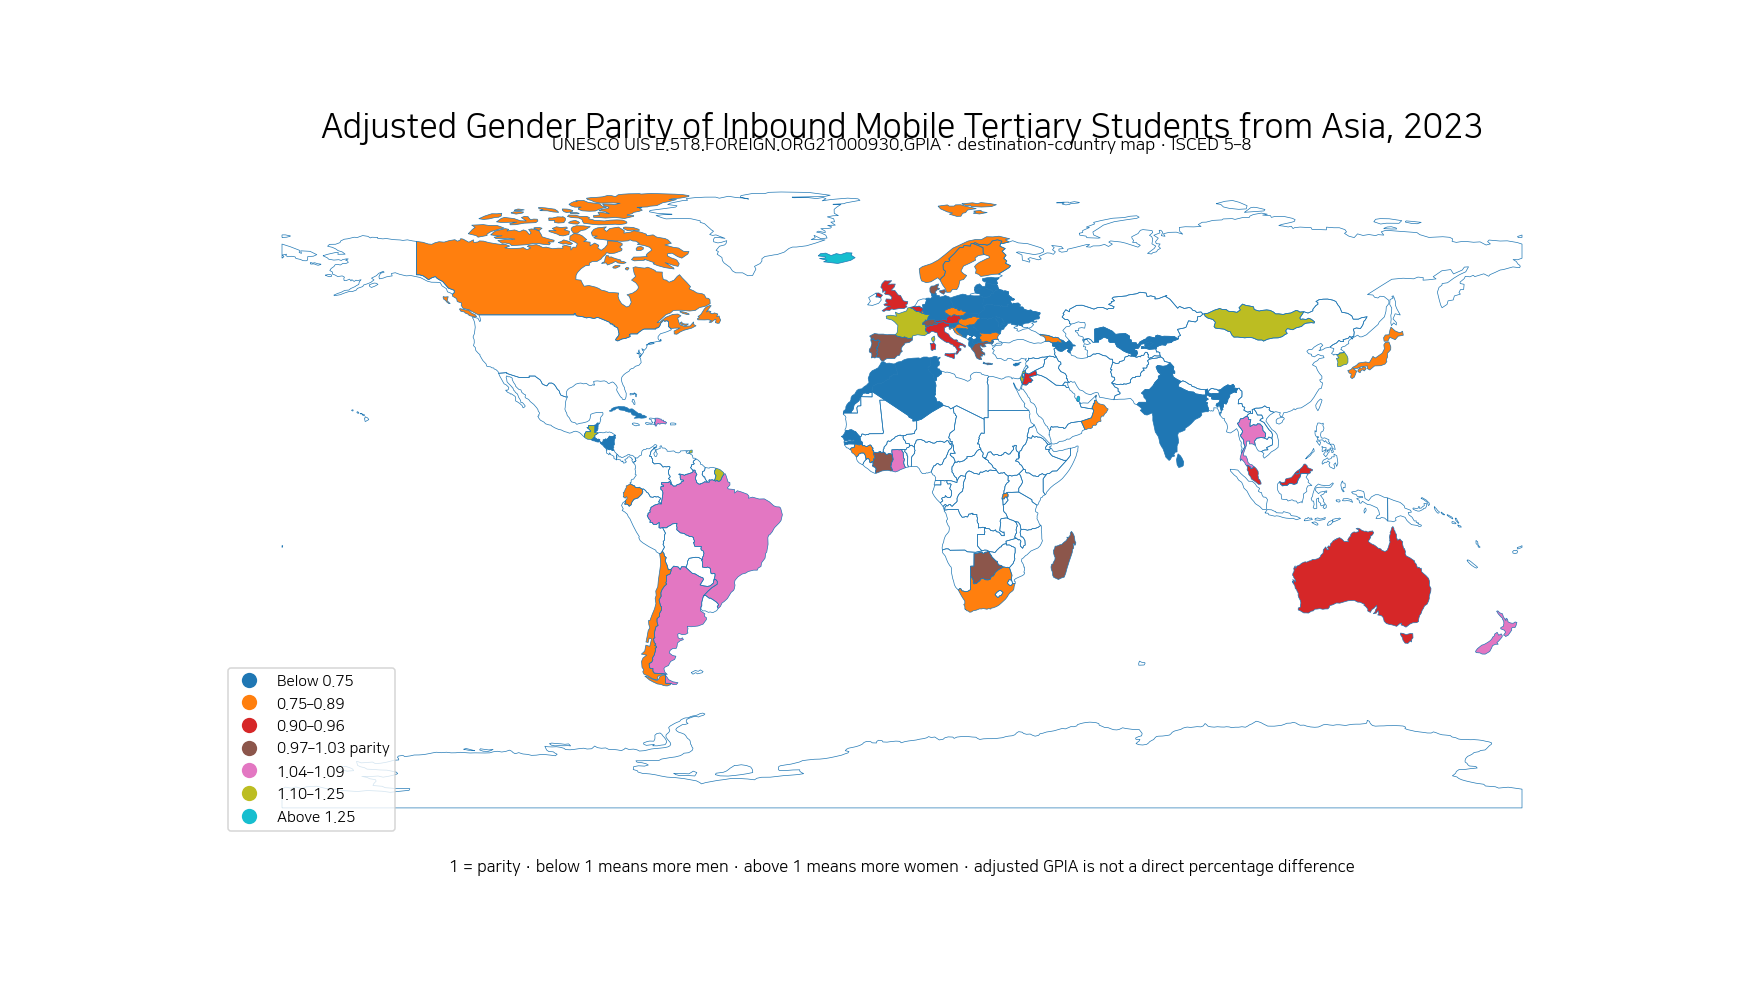
Table of Contents
The mapped countries are destinations, not student origins
Asia is fixed as the origin region. Each row and map polygon is a destination country or area where Asia-origin internationally mobile students are enrolled in tertiary education.
Korea’s value therefore describes the gender composition of Asia-origin mobile tertiary students studying in Korea. It does not describe Korean students who study abroad.
Internationally mobile students are not simply all foreign citizens
UIS defines internationally mobile students as people who physically cross an international border to participate in education in a destination country different from their country of origin.
For tertiary students, country of origin is preferably the country where upper-secondary qualifications were obtained. Usual residence can be used when that is unavailable, and citizenship is recommended only as a last-resort proxy. This is why a mobility statistic is not identical to a simple foreign-citizenship count.
GPIA uses 1 as the parity point
The gender parity index compares female and male indicator values. UIS uses an adjusted form that places parity at 1 and keeps the index on a 0–2 scale.
A value of 1 indicates parity. Values above 1 indicate a larger female value, while values below 1 indicate a larger male value. UIS uses 0.97–1.03 as a practical parity band.
Korea’s 1.249 does not mean 24.9% more women
Adjusted GPIA is not the raw female-to-male ratio once the unadjusted ratio exceeds 1. The transformation is designed so that disparity is represented more symmetrically around the parity value of 1.
Korea’s 1.249 therefore tells us that women outnumber men in the relevant indicator, but it should not be converted directly into a claim that there were exactly 24.9% more women. Exact percentage differences require the underlying female and male student counts.
Eight destinations are within the 0.97–1.03 parity band
8 of the 84 observations fall within the parity band. Madagascar is exactly 1.000, Spain 0.998, Switzerland 0.982, Botswana 0.981, Côte d’Ivoire 1.020, Greece 1.023, Denmark 0.977 and Portugal 0.971.
Those destinations have relatively similar female and male indicator values, but the index does not tell us how many Asia-origin students they host. A small destination and a large destination can both have GPIA near 1.
| Destination | ISO3 | GPIA | Interpretation |
|---|---|---|---|
| Madagascar | MDG | 1.000 | Parity band |
| Spain | ESP | 0.998 | Parity band |
| Switzerland | CHE | 0.982 | Parity band |
| Botswana | BWA | 0.981 | Parity band |
| Côte d’Ivoire | CIV | 1.020 | Parity band |
| Greece | GRC | 1.023 | Parity band |
| Denmark | DNK | 0.977 | Parity band |
| Portugal | PRT | 0.971 | Parity band |
| Brazil | BRA | 1.032 | More women |
| New Zealand | NZL | 1.034 | More women |
Korea is 1.249, with more women than men
The Republic of Korea records 1.249. France is 1.158, Brazil 1.032 and New Zealand 1.034, also indicating more women than men.
The United Kingdom is 0.955, Australia 0.922, Canada 0.827, Germany 0.673, Japan 0.795 and India 0.471, each indicating more men than women.
| Destination | GPIA | Gender composition |
|---|---|---|
| Republic of Korea | 1.249 | More women |
| France | 1.158 | More women |
| United Kingdom | 0.955 | More men |
| Australia | 0.922 | More men |
| Canada | 0.827 | More men |
| Germany | 0.673 | More men |
| India | 0.471 | More men |
| Brazil | 1.032 | More women |
| Spain | 0.998 | Parity band |
| Italy | 0.922 | More men |
| South Africa | 0.765 | More men |
| New Zealand | 1.034 | More women |
| Malaysia | 0.908 | More men |
| Japan | 0.795 | More men |
Monaco has the highest value at 1.720
Monaco records the highest GPIA at 1.720. Andorra is 1.500, Qatar 1.344, Bahrain 1.337, Iceland 1.293, Korea 1.249, Macao 1.231, Israel 1.227 and Hong Kong SAR 1.224.
High GPIA indicates more women than men among Asia-origin mobile tertiary students. It is not a score for international-student recruitment, education quality or destination popularity.
| Destinations with more women | ISO3 | GPIA |
|---|---|---|
| Monaco | MCO | 1.720 |
| Andorra | AND | 1.500 |
| Qatar | QAT | 1.344 |
| Bahrain | BHR | 1.337 |
| Iceland | ISL | 1.293 |
| Republic of Korea | KOR | 1.249 |
| Macao SAR, China | MAC | 1.231 |
| Israel | ISR | 1.227 |
| Hong Kong SAR, China | HKG | 1.224 |
| Mongolia | MNG | 1.191 |
| Guatemala | GTM | 1.161 |
| France | FRA | 1.158 |
Nicaragua, Cuba and Latvia have especially low GPIA values
Nicaragua has the lowest observation at 0.262. Cuba is 0.263, Latvia 0.281, Tunisia 0.314, Albania 0.314, Cyprus 0.350 and Slovenia 0.351.
These low values indicate more men than women among the observed Asia-origin mobile students. They do not imply lower educational quality or weaker international recruitment.
| Destinations with more men | ISO3 | GPIA |
|---|---|---|
| Nicaragua | NIC | 0.262 |
| Cuba | CUB | 0.263 |
| Latvia | LVA | 0.281 |
| Tunisia | TUN | 0.314 |
| Albania | ALB | 0.314 |
| Cyprus | CYP | 0.350 |
| Slovenia | SVN | 0.351 |
| Morocco | MAR | 0.438 |
| Ukraine | UKR | 0.470 |
| Romania | ROU | 0.471 |
| India | IND | 0.471 |
| Bermuda | BMU | 0.500 |
More destinations have male-majority composition than female-majority composition
Excluding the parity band, 56 destinations fall below 0.97 and 20 exceed 1.03. The median GPIA is 0.801, below the parity point of 1.
That does not mean a majority of all Asia-origin international students worldwide are men. Each destination receives equal weight in this country-level distribution, regardless of how many students it hosts. A population-weighted or student-count-weighted regional conclusion would require the underlying headcounts.
Extreme GPIA values need student counts for context
Values such as 1.720 or 0.262 are visually striking, but the dataset does not contain the underlying female and male counts for each destination.
A small number of students can move a parity index sharply when the destination population is small. Extreme values are therefore best treated as signals for follow-up with headcounts and multiple years of data.
The Asia-origin series is broader than the East Asia-Pacific series
A separate UIS indicator uses East Asia and the Pacific as the fixed origin region. The current Asia-origin series has a broader geographic origin scope.
The same destination can therefore show different GPIA values in the two series. Korea has more women than men in both origin-group comparisons, but the index levels differ because the underlying mix of origin countries is not the same.
Comparing with the North America-origin series shows why origin matters
UIS also publishes the same destination-side GPIA concept for North America-origin mobile tertiary students. A destination can show one gender pattern for North American students and another for students from Asia.
Fields of study, scholarships, language, tuition, migration pathways and bilateral education links can all differ by origin region. The parity index does not identify which mechanism is responsible.
This indicator does not rank destination popularity
GPIA measures gender composition, not student volume. It cannot identify which country hosts the largest number of Asia-origin mobile students or what share of all international students come from Asia.
Those questions require inbound student counts and different denominators. GPIA close to 1 can occur with very few students, while a large destination can have a sizeable imbalance.
Blank map areas do not mean zero
The source table contains 84 destination observations, of which 78 match separate polygons in the low-resolution world boundary layer used here. Small islands and territories may have valid observations without visible polygons.
Countries without a 2023 value remain unclassified. Missing GPIA values are never filled with zero because zero would falsely imply an extreme male-only pattern.
Data source and interpretation
Destination values come from the UNESCO UIS Data Browser for E.5T8.FOREIGN.ORG21000930.GPIA, using the 2023 observations. The mobility concept follows the UIS internationally mobile students definition.
GPIA is an adjusted gender parity index centered on 1 and bounded on a 0–2 scale. The source package’s internal provider tag named the World Bank, but the official indicator and dataset are UNESCO UIS, so the completed metadata corrects the provider to UNESCO UIS.
Frequently Asked Questions
What does Korea’s GPIA of 1.249 mean?
It indicates that women outnumber men among the observed Asia-origin mobile tertiary students in Korea. Because GPIA is adjusted, it does not mean women are exactly 24.9% more numerous.
What does a GPIA of 1 mean?
It indicates gender parity. UIS uses 0.97–1.03 as a practical parity band.
Are the mapped countries student origins?
No. Asia is the fixed origin region. The mapped countries are destinations where Asia-origin mobile tertiary students study.
Does a higher GPIA mean a destination hosts more international students?
No. GPIA measures gender composition only and does not measure student volume.
Related Maps
Green Map creates custom-edited map images using open geographic data sources such as geoBoundaries, Natural Earth, OpenStreetMap, and government open data.
These maps are edited visual materials, not raw data files, and are provided for education, documents, presentations, and graphic reference.