How much of public upper-secondary education spending goes to current costs other than staff compensation? UNESCO Institute for Statistics indicator XSPENDP.3.FDPUB.FNNONS measures the share of total expenditure in public upper-secondary institutions devoted to current expenditure other than staff compensation.
Across the 70 country and area observations dated 2021, the unweighted median is 16.5% and the mean is 17.4%. 21 observations are at or above 20%, while 5 are at or above 30%. The Republic of Korea is 19.8%, ranking 23rd among the 70 observations.
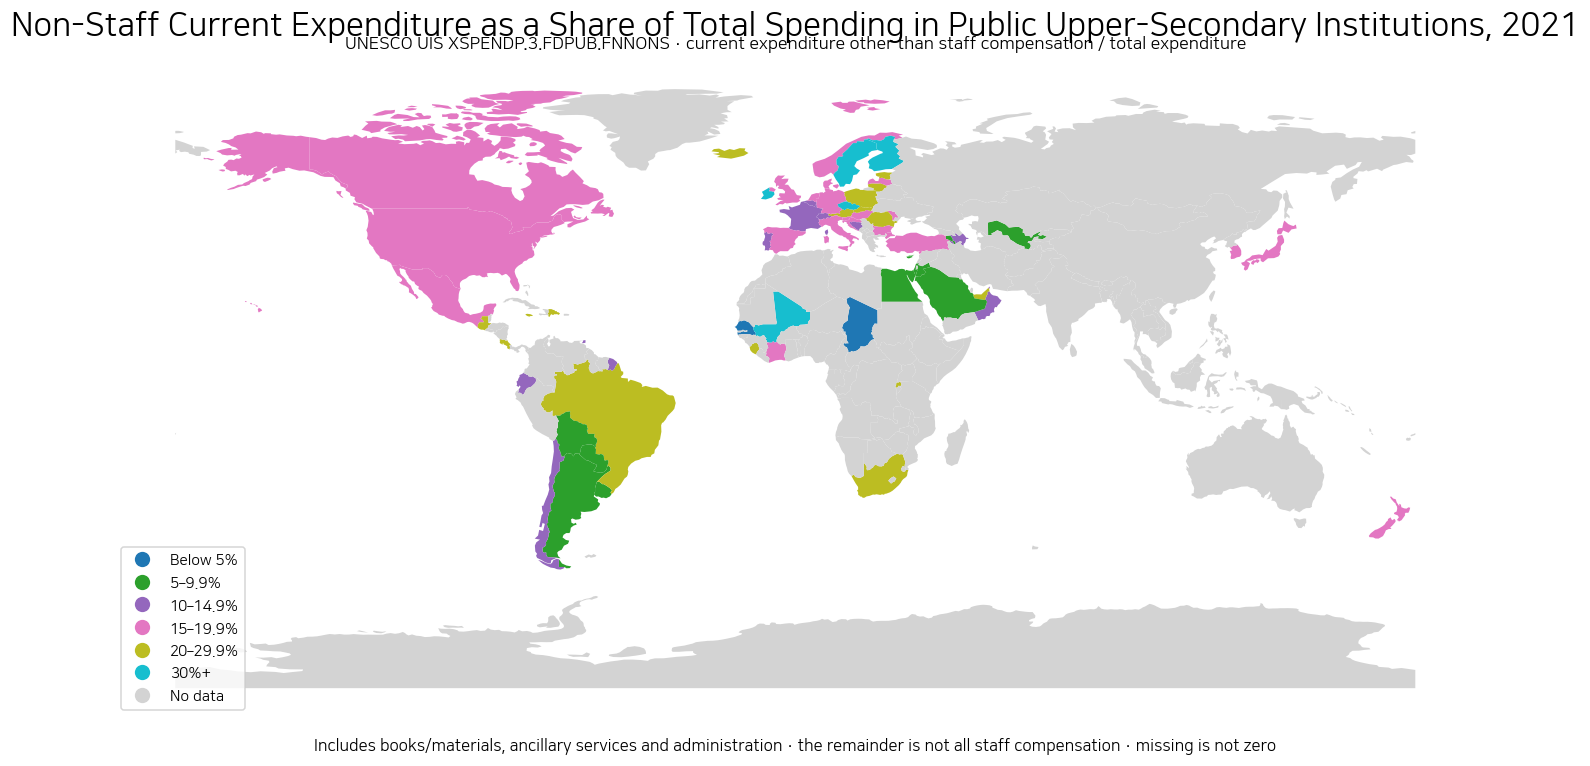
Table of Contents
What counts as current expenditure other than staff compensation
UIS defines non-staff current expenditure to include spending on school books and teaching materials, ancillary services, administration and other activities. Ancillary services can include school meals, health services, boarding and transport to and from school.
Staff compensation is also broader than salaries alone. It can include teaching and non-teaching staff salaries, employer contributions for retirement or pensions and social insurance, as well as allowances and benefits. The indicator therefore should not be reduced to a simple ‘everything except teacher salaries’ interpretation.
The word current matters as well. Current expenditure covers goods and services consumed within the current year and excludes capital formation such as major building or infrastructure investment. Books, materials and recurring operating services are typical current costs.
A 20% value does not mean the remaining 80% is all staff compensation
The numerator is non-staff current expenditure, but the denominator is total expenditure in public upper-secondary institutions. If the indicator is 20%, that means one-fifth of total spending went to non-staff current costs.
The other 80% can include staff compensation and capital expenditure. It is therefore incorrect to subtract this indicator from 100 and label the remainder as salaries. A separate staff-compensation share and a capital-expenditure share are needed to reconstruct the full expenditure structure.
The internal mix can also differ even when two countries have the same percentage. One may spend more on books and laboratory materials, while another directs a larger part of non-staff current spending to meals, transport or administration. An identical headline share does not imply identical services or resources.
The median across 70 observations is 16.5%
The median is 16.5%, with a first quartile of 10.9% and a third quartile of 21.8%. 21 observations are at least 20%, 13 are at least 25% and 5 are at least 30%.
At the low end, 16 observations are below 10% and 4 are below 5%. The distribution shows meaningful differences in spending structure, but neither high nor low values should automatically be labelled superior.
Mali is an outlier at 66.7%, while Ireland, Czechia and Sweden exceed 30%
Mali has the highest value at 66.7%. Ireland is 37.0%, Czechia 36.4%, Sweden 34.0% and Finland 32.3%. Rwanda, Sierra Leone, Austria and Slovakia are close to 29%.
A high share means non-staff current costs account for a large part of total expenditure. It does not automatically mean that teaching materials or student services are adequately funded. The total spending envelope may be small, staff compensation may be relatively low, or a specific operating cost may be unusually large.
| Rank | Country or area | ISO3 | Non-staff current share |
|---|---|---|---|
| 1 | Mali | MLI | 66.7% |
| 2 | Ireland | IRL | 37.0% |
| 3 | Czechia | CZE | 36.4% |
| 4 | Sweden | SWE | 34.0% |
| 5 | Finland | FIN | 32.3% |
| 6 | Rwanda | RWA | 29.6% |
| 7 | Sierra Leone | SLE | 29.6% |
| 8 | Austria | AUT | 29.5% |
| 9 | Slovakia | SVK | 29.4% |
| 10 | Jamaica | JAM | 25.9% |
| 11 | United Arab Emirates | ARE | 25.8% |
| 12 | Costa Rica | CRI | 25.2% |
| 13 | Romania | ROU | 25.2% |
| 14 | Estonia | EST | 24.8% |
| 15 | Dominican Republic | DOM | 22.8% |
The Republic of Korea is 19.8%, slightly above the median
The Republic of Korea records 19.8%, ranking 23rd and sitting about 3.3 percentage points above the 16.5% median. Brazil is 22.2%, the United States 17.4%, the United Kingdom 17.3% and Canada 16.8%.
Germany is 15.9%, Japan 15.3% and France 15.0%. Differences among high-income systems can reflect teacher compensation, operating models, student services, transport, materials and the timing of capital expenditure.
| Country | 2021 share | High-to-low rank |
|---|---|---|
| Republic of Korea | 19.8% | 23 |
| United States | 17.4% | 31 |
| United Kingdom | 17.3% | 32 |
| Canada | 16.8% | 35 |
| Germany | 15.9% | 39 |
| Japan | 15.3% | 40 |
| France | 15.0% | 43 |
| Brazil | 22.2% | 18 |
| Sweden | 34.0% | 4 |
| Finland | 32.3% | 5 |
A low share is not automatically a better budget structure
The Cayman Islands have the lowest observation at 1.1%, followed by Senegal at 1.2%, Chad at 3.2% and Monaco at 4.9%. A low non-staff current share does not, by itself, prove that resources are being used efficiently.
A very low share could mean that staff compensation dominates spending, but it could also reflect unusually large capital expenditure in the denominator. It may also signal limited spending on books, materials, meals, transport or administration. Additional expenditure categories are needed for interpretation.
A high share is not automatically better either
Books, instructional materials and student-support services are important, but teacher compensation and the ability to recruit and retain qualified staff are also central to education quality. A high non-staff current share can reflect useful operational investment or a relatively low staff-compensation share.
There is no single ideal percentage that applies to every system. Budget structure should be read alongside staffing levels, salaries, capital investment, enrolment, student needs, programme orientation and education outcomes.
The indicator is specific to public upper-secondary institutions
The ‘3’ in the UIS code refers to upper-secondary education. The spending structure of pre-primary, primary, lower-secondary or tertiary institutions can be very different, so the 2021 values should not be generalized to the entire education sector.
Systems with large vocational upper-secondary programmes may need more equipment and consumable materials. Countries that provide extensive meals or transport can also have higher ancillary-service costs. Two countries with the same percentage may therefore have very different underlying spending patterns.
A percentage does not tell us the actual amount spent
The indicator describes composition, not scale. Twenty percent of a $10 billion expenditure envelope is very different from 20% of a $1 billion envelope even though the percentage is identical.
To understand the actual resources available to schools, total expenditure and student numbers are also needed. A per-student measure of non-staff current expenditure would answer a different and often more operational question.
A single 2021 observation does not establish a long-term budget priority
The data are a 2021 cross-section. Pandemic-related health measures, digital learning, meals, transport, energy costs, material purchases or unusual capital projects may have affected expenditure composition in a particular year.
A sustained shift in budget structure should be evaluated with a time series rather than one observation. The article therefore describes the 2021 distribution without treating it as proof of a permanent fiscal strategy.
Data source and interpretation
Country values come from the UNESCO UIS Data Browser for XSPENDP.3.FDPUB.FNNONS, using the 2021 observations. UIS defines current expenditure other than staff compensation to include school books and teaching materials, ancillary services, administration and other activities.
The denominator is total expenditure in public upper-secondary institutions and the unit is percent. The article does not treat the remainder as staff compensation because capital expenditure can also be part of total expenditure. The provider tag and source metadata already agree on UNESCO UIS, so no provider correction is needed.
Frequently Asked Questions
What is included in non-staff current expenditure?
UIS includes school books and teaching materials, ancillary services such as meals and transport, administration and other current activities.
Does Korea’s 19.8% mean the remaining 80.2% is staff compensation?
No. The denominator is total expenditure, so the remainder can include staff compensation and capital expenditure. A separate staff-compensation indicator is needed.
Is a higher share necessarily better?
No. A higher share means non-staff current costs take a larger share of total spending, but interpretation requires staff compensation, capital spending, enrolment and service structure.
Does the indicator cover the whole education system?
No. It is specific to public upper-secondary institutions.
Related Articles
- Government Education Spending as % of GDP
- Government Final Consumption as % of GDP
- Upper-Secondary-or-Higher Attainment by Country
Green Map creates custom-edited map images using open geographic data sources such as geoBoundaries, Natural Earth, OpenStreetMap, and government open data.
These maps are edited visual materials, not raw data files, and are provided for education, documents, presentations, and graphic reference.