The young age dependency ratio shows how many people under age 15 there are for every 100 people ages 15–64. Using the 217 World Bank observations dated 2025, the median is 33.0 and the unweighted mean is 40.5. The Central African Republic is highest at 99.1 young dependents per 100 working-age people, while Korea is lowest at 14.7.
The World Bank indicator is SP.POP.DPND.YG, formally titled Age dependency ratio, young (% of working-age population). Its formula is 100 × population under age 15 divided by population ages 15–64. A value of 80 does not mean that 80% of the total population is under 15; it means there are 80 people under 15 for every 100 people ages 15–64.
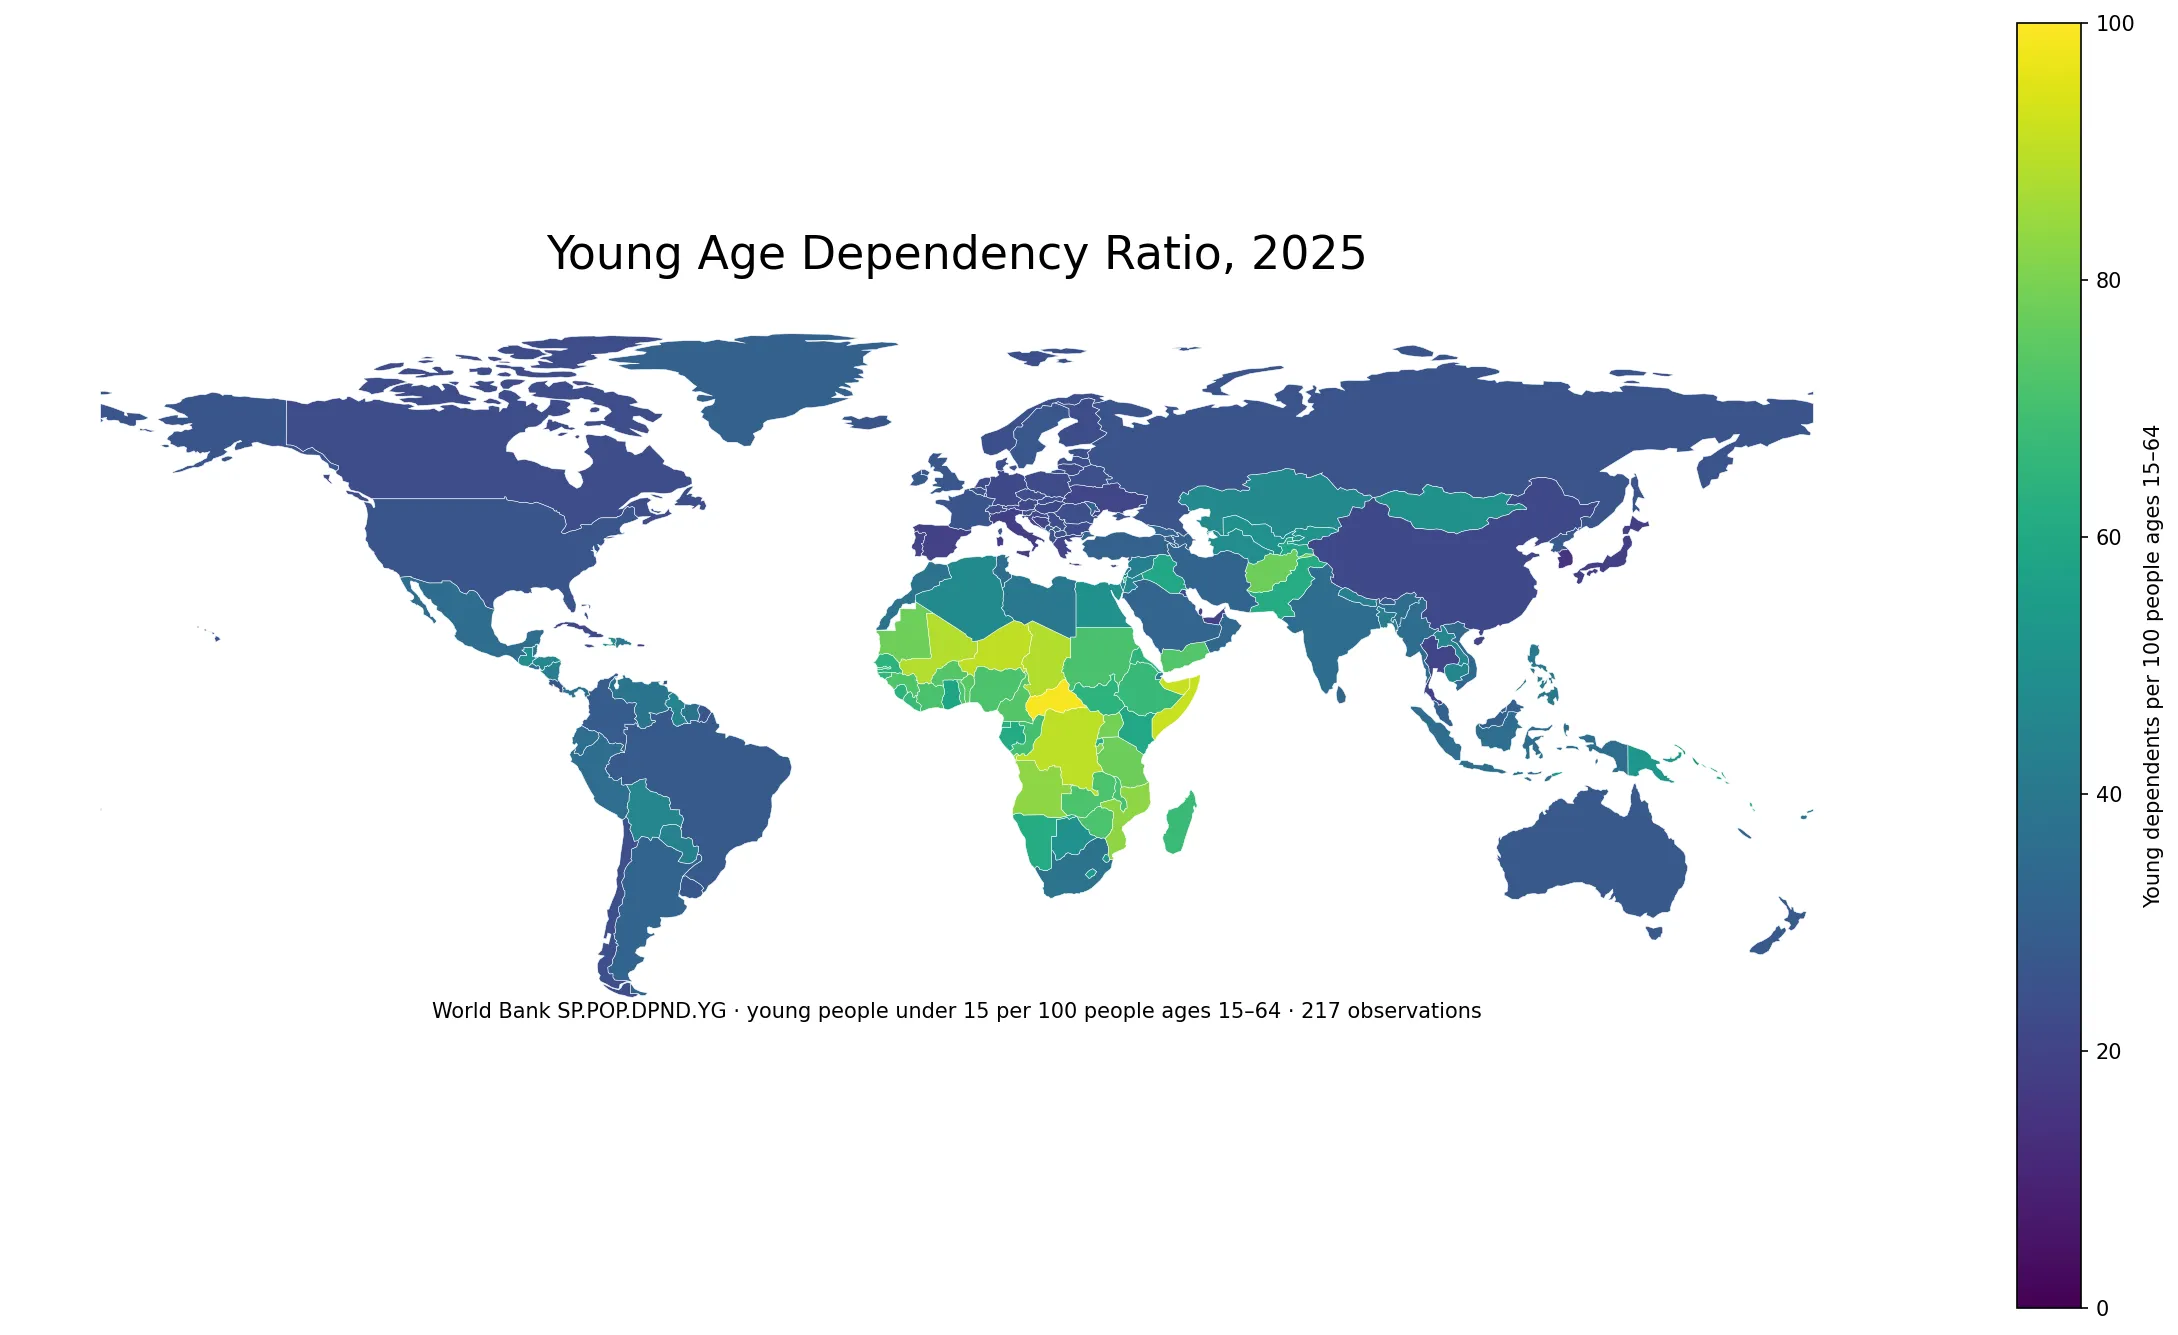
Table of Contents
The young dependency ratio is not the same as the share of children in the total population
The World Bank metadata defines the numerator as people younger than 15 and the denominator as people ages 15–64. Because the denominator is not the total population, the ratio should not be read as a conventional population percentage. A value of 50 means 50 young dependents per 100 people in the 15–64 age group.
The indicator also excludes older dependents from the numerator. The total age dependency ratio adds people under 15 and people over age 64, while the young ratio used here isolates the younger group. A country can therefore have a low young dependency ratio and still have a high old-age dependency ratio.
The Central African Republic is highest at 99.1 in 2025
The Central African Republic records 99.1, followed by Somalia at 91.6, Niger at 90.4, the Democratic Republic of the Congo at 90.2, Chad at 88.5 and Mali at 88.3. Angola and Mozambique are both about 83.2, and Burundi is 82.3.
| Country or economy | Young dependents per 100 people ages 15–64 |
|---|---|
| Central African Republic | 99.1 |
| Somalia, Fed. Rep. | 91.6 |
| Niger | 90.4 |
| Congo, Dem. Rep. | 90.2 |
| Chad | 88.5 |
| Mali | 88.3 |
| Angola | 83.2 |
| Mozambique | 83.2 |
| Burundi | 82.3 |
| Uganda | 78.9 |
| Mauritania | 78.0 |
| Tanzania | 77.5 |
The highest observations are concentrated heavily in Sub-Saharan Africa. The map describes the resulting age structure; it does not by itself separate the contributions of fertility, mortality and migration.
62 of 217 observations are at 50 or above
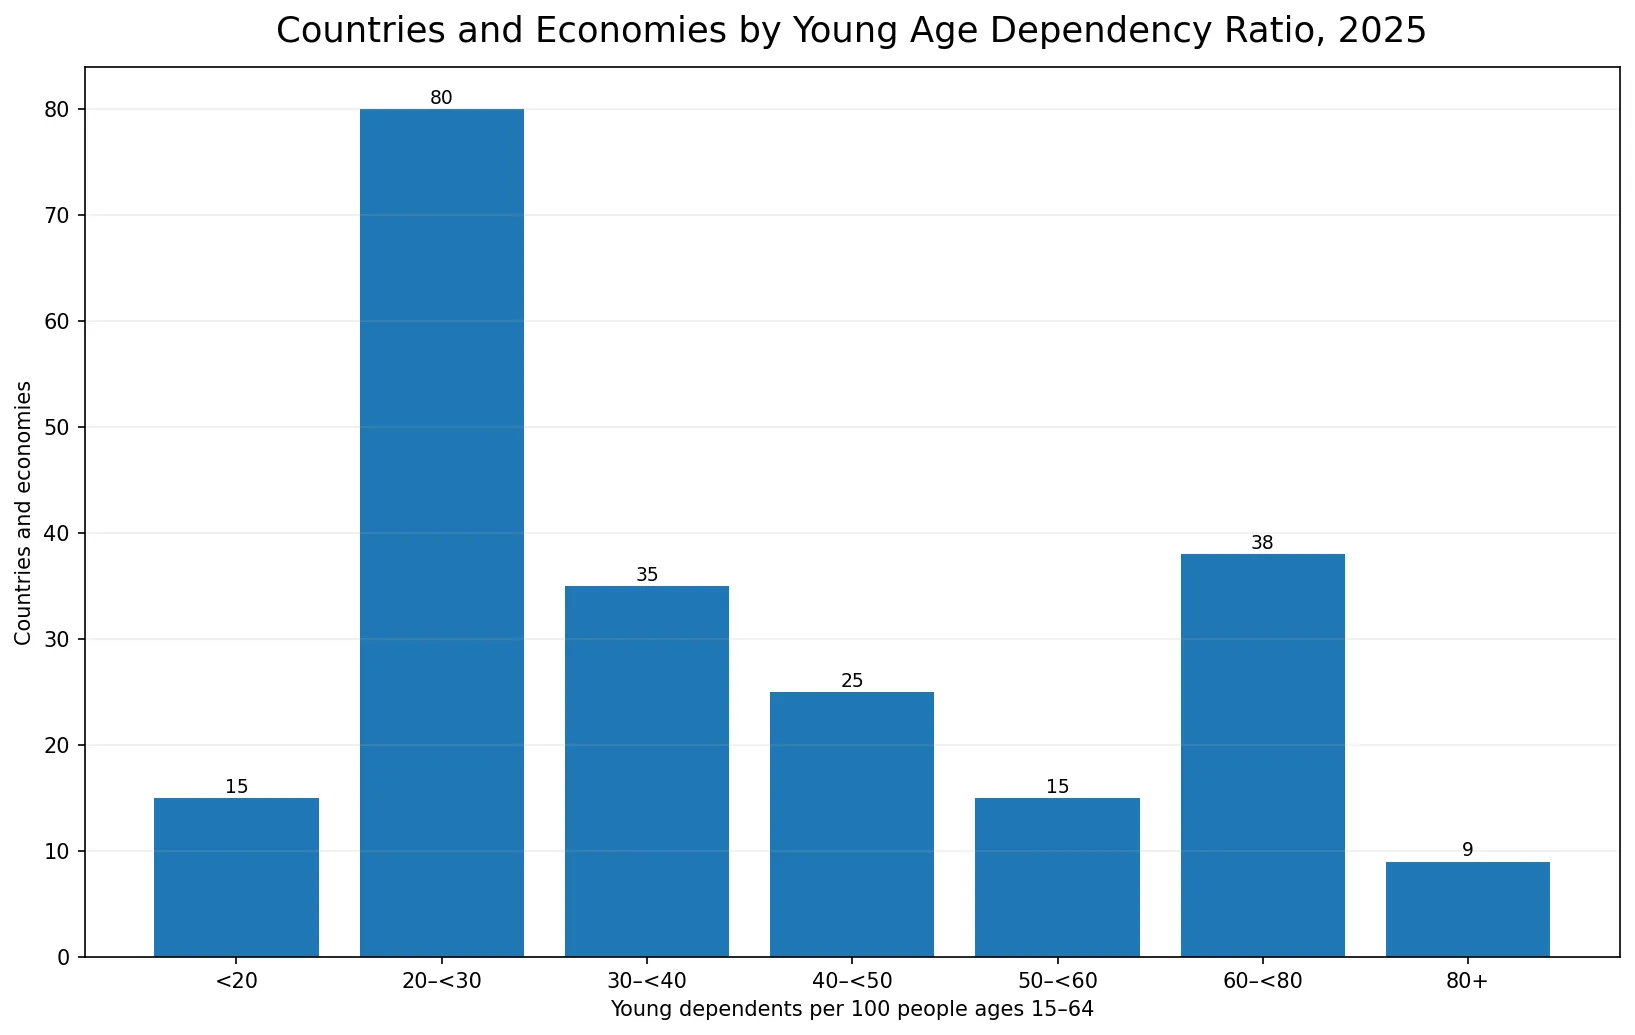
62 observations have at least 50 young dependents per 100 people ages 15–64, 47 reach 60, 26 reach 70, and 9 reach 80 or more. At the other end, 95 are below 30 and 15 are below 20.
| Young dependents per 100 people ages 15–64 | Countries/economies | Share of 217 |
|---|---|---|
| <20 | 15 | 6.9% |
| 20–<30 | 80 | 36.9% |
| 30–<40 | 35 | 16.1% |
| 40–<50 | 25 | 11.5% |
| 50–<60 | 15 | 6.9% |
| 60–<80 | 38 | 17.5% |
| 80+ | 9 | 4.1% |
The middle half of the country/economy observations lies between about 24.2 and 55.1. The simple mean is higher than the median because a group of values near 70–100 pulls the average upward. These statistics are not population-weighted world ratios; every country/economy row contributes equally.
Korea is lowest at 14.7, followed by Hong Kong and Singapore
Korea is the lowest observation at 14.7, followed by Hong Kong SAR at 15.6, Singapore at 15.8 and Andorra at 16.2. Puerto Rico is 17.7, Qatar 18.0, San Marino 18.2, Italy 18.4 and Japan 19.1.
| Country or economy | Young dependents per 100 people ages 15–64 |
|---|---|
| Korea, Rep. | 14.7 |
| Hong Kong SAR, China | 15.6 |
| Singapore | 15.8 |
| Andorra | 16.2 |
| Puerto Rico (US) | 17.7 |
| Qatar | 18.0 |
| San Marino | 18.2 |
| Italy | 18.4 |
| British Virgin Islands | 18.6 |
| Japan | 19.1 |
| Spain | 19.2 |
| Macao SAR, China | 19.3 |
A low young dependency ratio does not mean that overall demographic dependency is low. Countries with few children relative to the 15–64 population can simultaneously have large older populations, which are measured by a separate old-age dependency ratio.
Nigeria is at 71.8, while India, Indonesia and Mexico are near 35
Among selected large economies, Nigeria is much higher at 71.8. Mexico is 35.8, Indonesia 35.5 and India 35.4. Brazil is 28.0, Australia 27.5, the United Kingdom 26.8, the United States 26.5 and France 26.5.
| Country | Young dependents per 100 people ages 15–64 |
|---|---|
| Nigeria | 71.8 |
| India | 35.4 |
| Indonesia | 35.5 |
| Mexico | 35.8 |
| Brazil | 28.0 |
| Australia | 27.5 |
| United Kingdom | 26.8 |
| United States | 26.5 |
| France | 26.5 |
| Canada | 23.1 |
| Germany | 22.2 |
| China | 22.1 |
| Japan | 19.1 |
| Korea, Rep. | 14.7 |
Canada is at 23.1, Germany 22.2, China 22.1, Japan 19.1 and Korea 14.7. These differences describe age composition rather than economic performance or living standards.
The word ‘dependency’ does not mean every working-age person is supporting children economically
The World Bank cautions that dependency ratios describe age composition, not literal economic dependency. Not everyone ages 15–64 is employed, and some people outside that age range can participate in the labor force. A ratio of 70 therefore should not be translated into a claim that 100 workers financially support exactly 70 children.
The measure is useful for thinking about the relative size of younger age groups and potential demand for schools, health services and family-related infrastructure. Actual fiscal or household support burdens require employment, income, public spending and service-cost data.
Population growth helps separate age structure from the speed of demographic change
Countries with high young dependency ratios often have youthful age structures, but the population growth rate does not have to rank in exactly the same order. Population growth reflects births, deaths and migration, while the young dependency ratio is a snapshot of the relative size of two age groups.
Urbanization and rural population growth answer other questions again. A youthful population does not automatically imply a low urban share or fast rural population growth. Those relationships need separate indicators rather than assumptions from age structure alone.
The 2025 values are based on UN World Population Prospects age structures and World Bank estimates
World Bank metadata identifies the United Nations Population Division’s World Population Prospects and World Bank staff estimates as the source. The methodology notes that annual age-structure estimates can involve interpolation from five-year age-group and period data, so tiny decimal-point differences should not be treated like direct census counts.
Broad differences such as 20 versus 80 are highly informative about age structure. Differences of a few tenths of a point are less suitable for precise policy rankings, especially when the underlying figures are demographic estimates.
Data source and mapping method
The data come from World Bank World Development Indicators SP.POP.DPND.YG. All 217 retained country/economy observations are dated 2025. The unweighted median is 32.97 and the mean 40.54; quartiles, thresholds and ranked values are calculated directly from the verified source rows.
ISO-3 codes are joined to a simplified world boundary layer for the map. The statistical sample contains 217 observations and 171 polygons are directly matched. Small islands and separately reported territories can have valid statistics without a distinct visible polygon at world scale.
Frequently Asked Questions
What does a young age dependency ratio of 50 mean?
It means there are 50 people under age 15 for every 100 people ages 15–64. It does not mean that 50% of the total population is under 15.
Does the young dependency ratio include people age 65 and older?
No. SP.POP.DPND.YG compares only people under 15 with people ages 15–64. Older dependents are captured by the old-age or total dependency ratio.
Does a high young dependency ratio prove a high economic support burden?
No. It is an age-composition ratio, not a direct measure of employment, household transfers, public spending or actual economic dependency.
Which 2025 observation has the lowest young dependency ratio?
Korea is lowest among the 217 verified 2025 observations at about 14.7, followed by Hong Kong SAR at about 15.6 and Singapore at about 15.8.
Related Articles
These population maps help distinguish age structure from population growth and settlement patterns.
- Global Population Growth Map – Country Patterns in 2025
- Global Urbanization Rate Map – Urban Population by Country in 2025
- Global Rural Population Growth Map – 2025 Country Comparison
Green Map creates custom-edited map images using open geographic data sources such as geoBoundaries, Natural Earth, OpenStreetMap, and government open data.
These maps are edited visual materials, not raw data files, and are provided for education, documents, presentations, and graphic reference.