World Bank data show a wide 2020 spread in cropland renewable natural capital per person. Across the verified set of 150 countries and economies, the indicator ranges from about US$ 41 to US$ 10,330 per person, with a median of US$ 1,288. Unlike mixed-vintage “latest observation” datasets, every row in this package is dated 2020, so the map supports a same-year country comparison.
The concept is monetary wealth, not physical cropland area. World Bank indicator NW.NCA.CROP.PC.CD is titled Renewable natural capital per capita, agricultural land: cropland (current US$). It expresses the value attributed to cropland within renewable natural capital on a per-person basis in current U.S. dollars. It is therefore not hectares per person, cropland as a share of land area, crop output, or farm income.
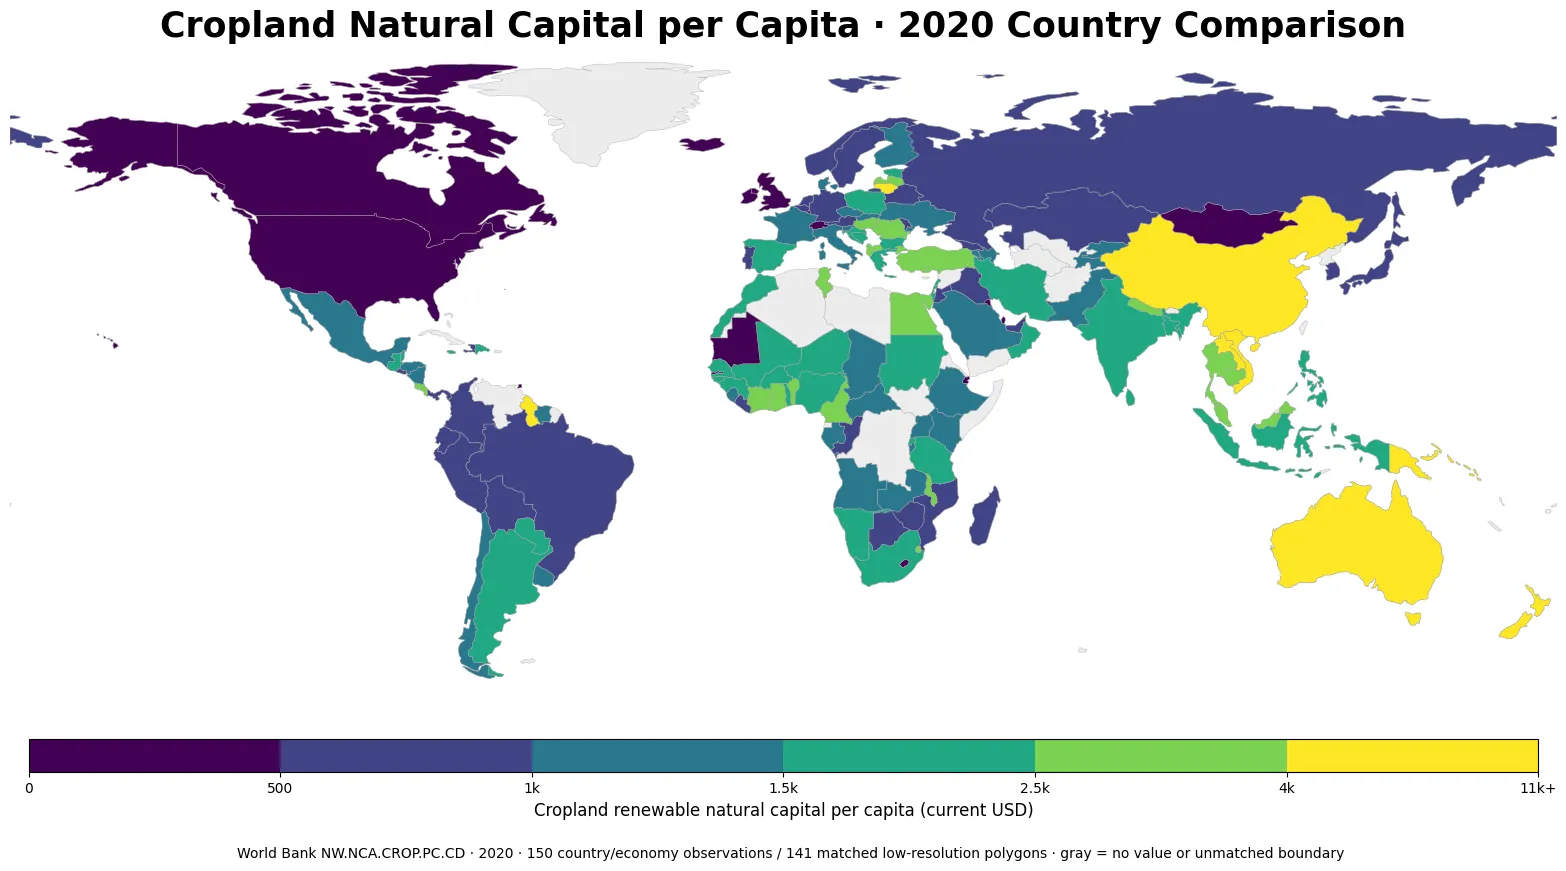
Table of Contents
This is a wealth-accounting value, not a map of how much land is cultivated
The World Bank’s Changing Wealth of Nations (CWON) framework complements GDP by treating the productive asset base of an economy as wealth. The portfolio includes produced capital, human capital, natural capital and other balance-sheet components. Renewable natural capital includes agricultural land alongside other renewable assets. NW.NCA.CROP.PC.CD isolates the cropland component of agricultural-land natural capital and expresses it per person.
That distinction prevents several common errors. A high value does not automatically mean a high cropland share of national territory, and a low value does not mean agriculture is unimportant. The numerator is a monetary asset value and the denominator is population. Questions about physical land area, crop yields, agricultural employment, food security, or farm revenue require other indicators.
The median is about US$1,288 per person, while the distribution has a long upper tail
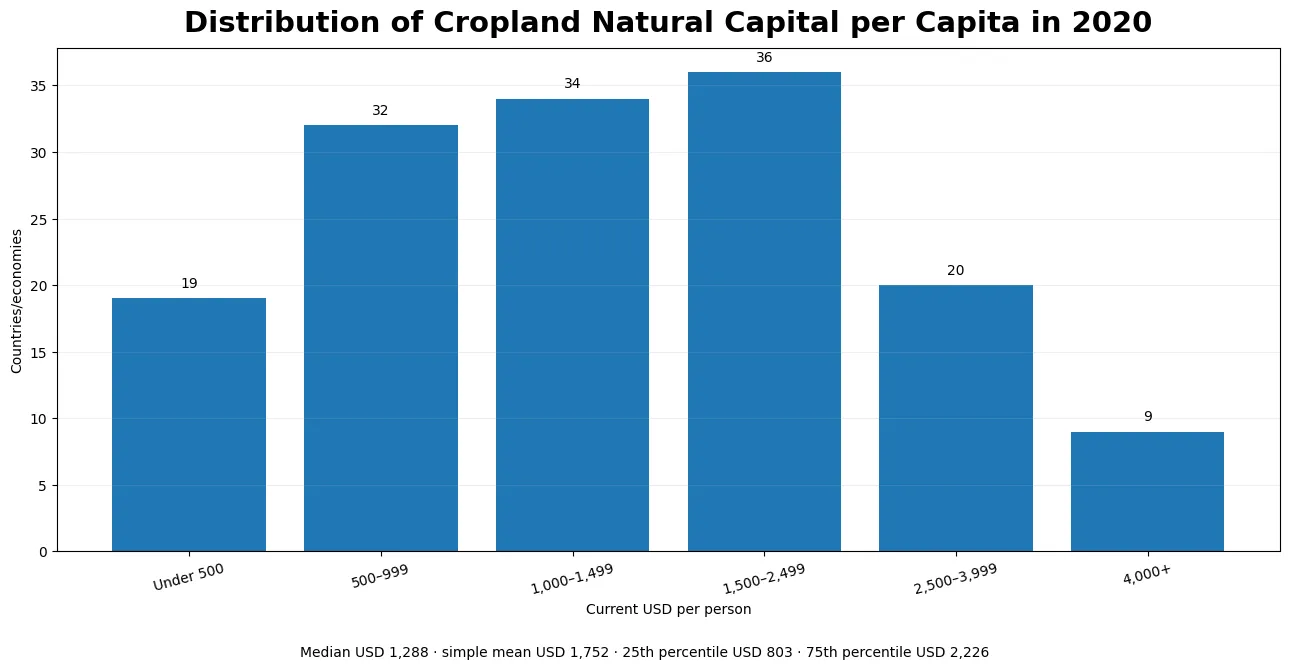
There are 19 observations below US$500 per person, 32 from US$500 to US$999, 34 from US$1,000 to US$1,499, 36 from US$1,500 to US$2,499, 20 from US$2,500 to US$3,999, and 9 at US$4,000 or more. The 25th percentile is about US$ 803 and the 75th percentile about US$ 2,226.
The simple mean is US$ 1,752, roughly US$ 464 above the median. A small number of very high observations pull the average upward, so the mean is not a good stand-alone description of a typical country. Lao PDR exceeds US$10,000 per person, while Australia and New Zealand are both above US$7,000.
Lao PDR, Australia and New Zealand are at the top; the United States and Canada are below US$300
The ten highest observations are Lao PDR US$ 10,330, Australia US$ 8,193, New Zealand US$ 7,831, Papua New Guinea US$ 6,074, Guyana US$ 4,935, Solomon Islands US$ 4,840, Viet Nam US$ 4,451, China US$ 4,317, Lithuania US$ 4,242, Egypt, Arab Rep. US$ 3,953. Lao PDR, at about US$ 10,330, stands well above the rest of the distribution. Australia and New Zealand follow, and Papua New Guinea is above US$6,000. Guyana, Solomon Islands, Viet Nam, China and Lithuania are all around US$4,000 or higher.
At the lower end are Singapore US$ 41, Iceland US$ 148, Bahrain US$ 180, Luxembourg US$ 181, Malta US$ 191, Qatar US$ 200, Djibouti US$ 232, United States US$ 249, Maldives US$ 278, Canada US$ 278. The United States is about US$ 249 per person and Canada about US$ 278, while Mexico is roughly US$ 1,333. That North American contrast is enough to show that physical country size or the simple presence of extensive farmland does not determine this indicator by itself. The supplied dataset does not decompose the difference into population, valuation assumptions, crop returns, or other factors, so no single cause is assigned here.
High values form visible clusters in East and Southeast Asia and across parts of Oceania
A prominent spatial pattern runs through East and Southeast Asia. Lao PDR is about US$10,330 per person, Viet Nam US$4,451, China US$4,317, Malaysia US$3,897, Thailand US$3,880, and Cambodia US$3,609. Indonesia, at about US$2,495, and India, at US$2,174, sit lower than that group but remain above the overall median.
Oceania also contains several high observations: Australia about US$8,193, New Zealand US$7,831, Papua New Guinea US$6,074, and Solomon Islands US$4,840. The map makes the regional concentration visible, but the indicator alone cannot prove that climate, crop mix, land policy, or any other single factor caused it. Explaining the pattern would require additional, definition-matched data.
West Africa and Europe show large differences even among neighboring countries
In West Africa, Côte d’Ivoire is about US$3,784, Benin US$3,758, Ghana US$2,925, Nigeria US$2,426, and Togo US$1,535. The cluster is not uniform: countries in the same broad region occupy multiple map bands. The result is more useful as a guide to where the cropland wealth estimate is relatively high or low than as a claim that the region has one shared agricultural structure.
Europe is similarly varied. Lithuania is about US$4,242 and Latvia US$3,211, while Germany is about US$527 and the United Kingdom US$340. France is around US$1,023 and Spain US$1,678. Geography, income group, and agricultural importance therefore cannot be substituted for the actual indicator value.
Selected countries on the same 2020 basis
| Country/economy | Cropland renewable natural capital per capita, 2020 |
|---|---|
| Lao PDR | US$ 10,330 |
| Australia | US$ 8,193 |
| New Zealand | US$ 7,831 |
| Papua New Guinea | US$ 6,074 |
| Guyana | US$ 4,935 |
| Viet Nam | US$ 4,451 |
| China | US$ 4,317 |
| Lithuania | US$ 4,242 |
| Egypt, Arab Rep. | US$ 3,953 |
| Malaysia | US$ 3,897 |
| Thailand | US$ 3,880 |
| Cote d'Ivoire | US$ 3,784 |
| Benin | US$ 3,758 |
| Indonesia | US$ 2,495 |
| Nigeria | US$ 2,426 |
| India | US$ 2,174 |
| Argentina | US$ 1,775 |
| South Africa | US$ 1,511 |
| Mexico | US$ 1,333 |
| France | US$ 1,023 |
| Korea, Rep. | US$ 998 |
| Brazil | US$ 892 |
| Japan | US$ 610 |
| Germany | US$ 527 |
| United Kingdom | US$ 340 |
| Canada | US$ 278 |
| United States | US$ 249 |
All table values are current U.S. dollars for the same year, so mixed reference years are not a concern. They are not purchasing-power-parity values and they are not inflation-adjusted constant-dollar series. The 2020 cross-section is appropriate for a nominal same-year comparison; analysis of real change through time should use a consistent time series designed for that purpose.
Cropland wealth is not the same question as arable-land or permanent-crop share
Green Map’s arable-land map measures the physical share of national land in the arable category, while the permanent-cropland map measures the share under long-lived crops. This article uses a monetary wealth-accounting indicator per person. The measures can complement one another, but they should not be subtracted, ranked as if they were interchangeable, or used to claim that more land area mechanically produces more natural-capital value.
“Current US$” also does not mean a current market sale price for farmland. It means the monetary value reported for the observation year in nominal U.S. dollars under the World Bank wealth-accounting indicator. It is not the same as farm real-estate prices, taxable land value, or annual agricultural income.
Data source and mapping method
The statistical source is World Bank indicator NW.NCA.CROP.PC.CD. The indicator page is available at World Bank Data. The broader comprehensive-wealth framework and the role of renewable natural capital are described by the World Bank’s Changing Wealth of Nations program.
The verified dataset contains 150 country/economy observations for 2020 after aggregate groups are excluded. No missing values were replaced with zero and no other reference year was used. Every statistic in this article—the mean, median, quartiles, band counts and table values—was calculated directly from those rows. ISO-3 codes were joined to a locally available low-resolution world boundary layer, producing 141 mapped polygons with values. Small islands and separately reported economies can remain in the statistical sample without a visible polygon, so gray or absent map geometry should not be read as a zero-dollar observation.
Frequently Asked Questions
Does higher cropland natural capital per capita mean a country has more cropland?
Not necessarily. This is a monetary natural-capital value divided by population. Physical cropland area and land-share percentages require separate land-use indicators.
Are all countries compared for the same year?
Yes. All 150 country/economy observations in the supplied dataset are for 2020.
What does current US$ mean here?
It means nominal U.S. dollars for the observation year. These 2020 values are not constant-dollar or PPP-adjusted figures.
Does a low value mean agriculture is economically unimportant?
No. The indicator does not directly measure farm output, agricultural employment, yields, food security, or farm income. It is a cropland natural-capital wealth measure.
Related Articles
These Green Map pages provide the closest physical-land comparisons. They measure land shares rather than monetary natural-capital value, so they are useful for context but are not substitutes for NW.NCA.CROP.PC.CD.
- Global Agricultural Land Share Map – 2023 Country Comparison
- Global Arable Land Share Map – 2023 Country Comparison
- Global Permanent Cropland Share Map – 2023 Country Comparison
Green Map creates custom-edited map images using open geographic data sources such as geoBoundaries, Natural Earth, OpenStreetMap, and government open data.
These maps are edited visual materials, not raw data files, and are provided for education, documents, presentations, and graphic reference.