This Walworth County, South Dakota map page lets you preview the county, city, water, and elevation maps and download the high-resolution JPG files in one ZIP archive. Walworth County sits in north-central South Dakota and has a distinctive western edge that curves around a broad water boundary. Mobridge is close to that western side, while Glenham, Selby, Java, Akaska, and Lowry are spread across the interior. The maps below separate roads and boundaries, community locations, waterways, and elevation so you can choose the view that matches what you need before downloading the printable files.
The county is easier to understand when west and east are compared rather than treated as one uniform area. Along the west, the county line bends around a broad body of water and the land beside it is relatively low. Farther east, the outer boundary becomes straighter and the terrain rises into higher ground, especially toward the northeast and southeast. The northern settlements form a loose west-to-east sequence from Mobridge through Glenham and Selby to Java, while Akaska and Lowry sit farther south. Seeing roads, waterways, and elevation together makes these relationships much clearer than a simple list of place names.
Table of Contents
From Mobridge on the curved west edge to Java in the northeast
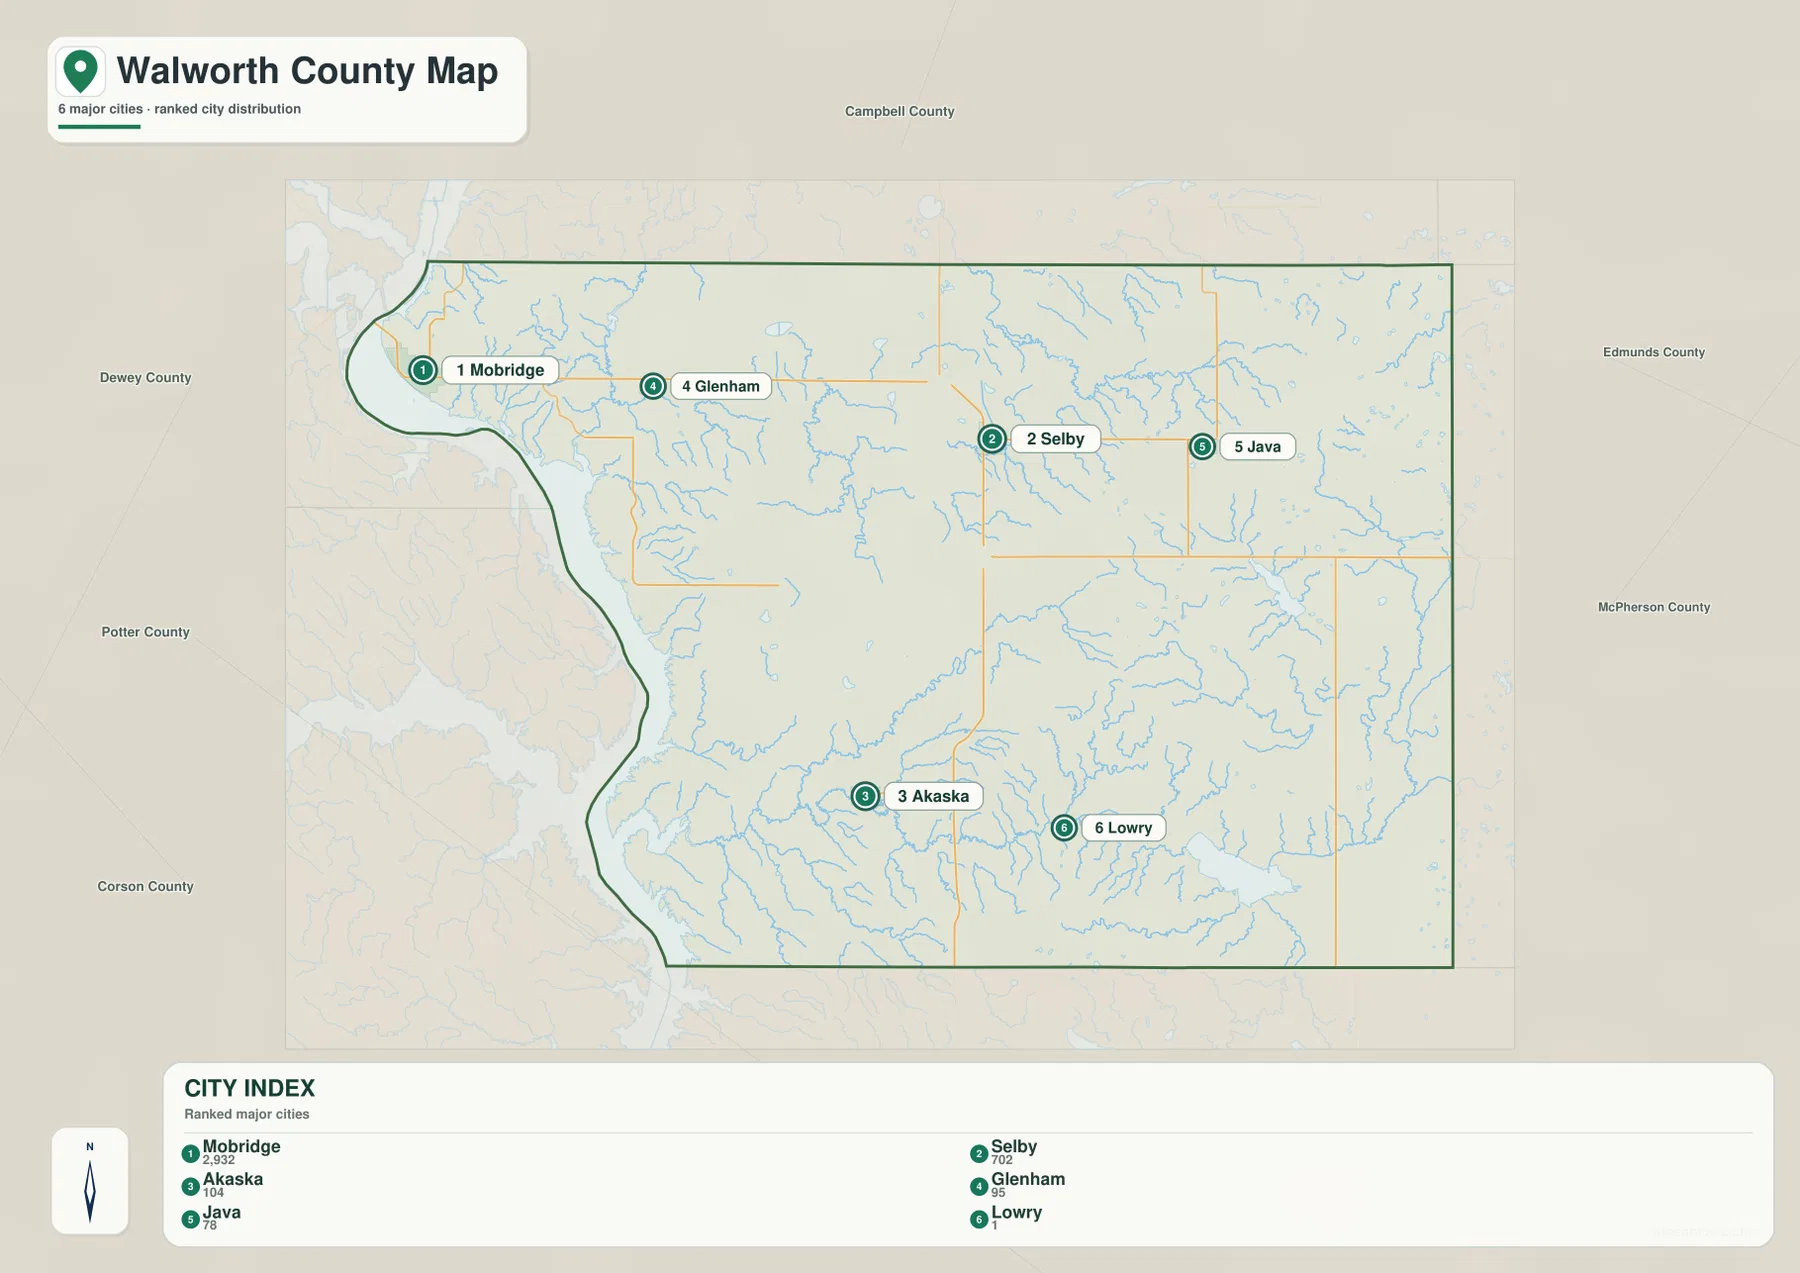
The general county map is the best starting point for orientation. Mobridge stands out immediately because it lies beside the curved northwestern boundary. From there, a major east-west road continues through Glenham and toward the county interior. Route shields for 12 and 20 appear along this northern corridor, giving readers an easy line to follow across the map. Selby is farther east, where a north-south road intersects the east-west route and creates one of the clearest reference points in the county.
Java lies east of Selby near the 130 route marker. A north-south road marked 271 enters from the north near this part of the county. Farther south and east, route 47 runs near the eastern side, while route 83 passes through the south-central area. Route 144 appears in the southwestern interior. These roads are useful for understanding direction and relative location, but this map is not a turn-by-turn navigation product and should not be used to estimate current travel time or road conditions.
The surrounding county labels help place Walworth County within South Dakota. Campbell County is shown to the north. Dewey, Potter, and Corson counties appear along the western side outside the boundary, while Edmunds and McPherson counties are labeled to the east. Looking at those neighboring names makes the unusual western outline easier to recognize and also shows how the county fits between the curved western water boundary and the straighter county lines farther east.
How the six mapped communities are distributed across the county
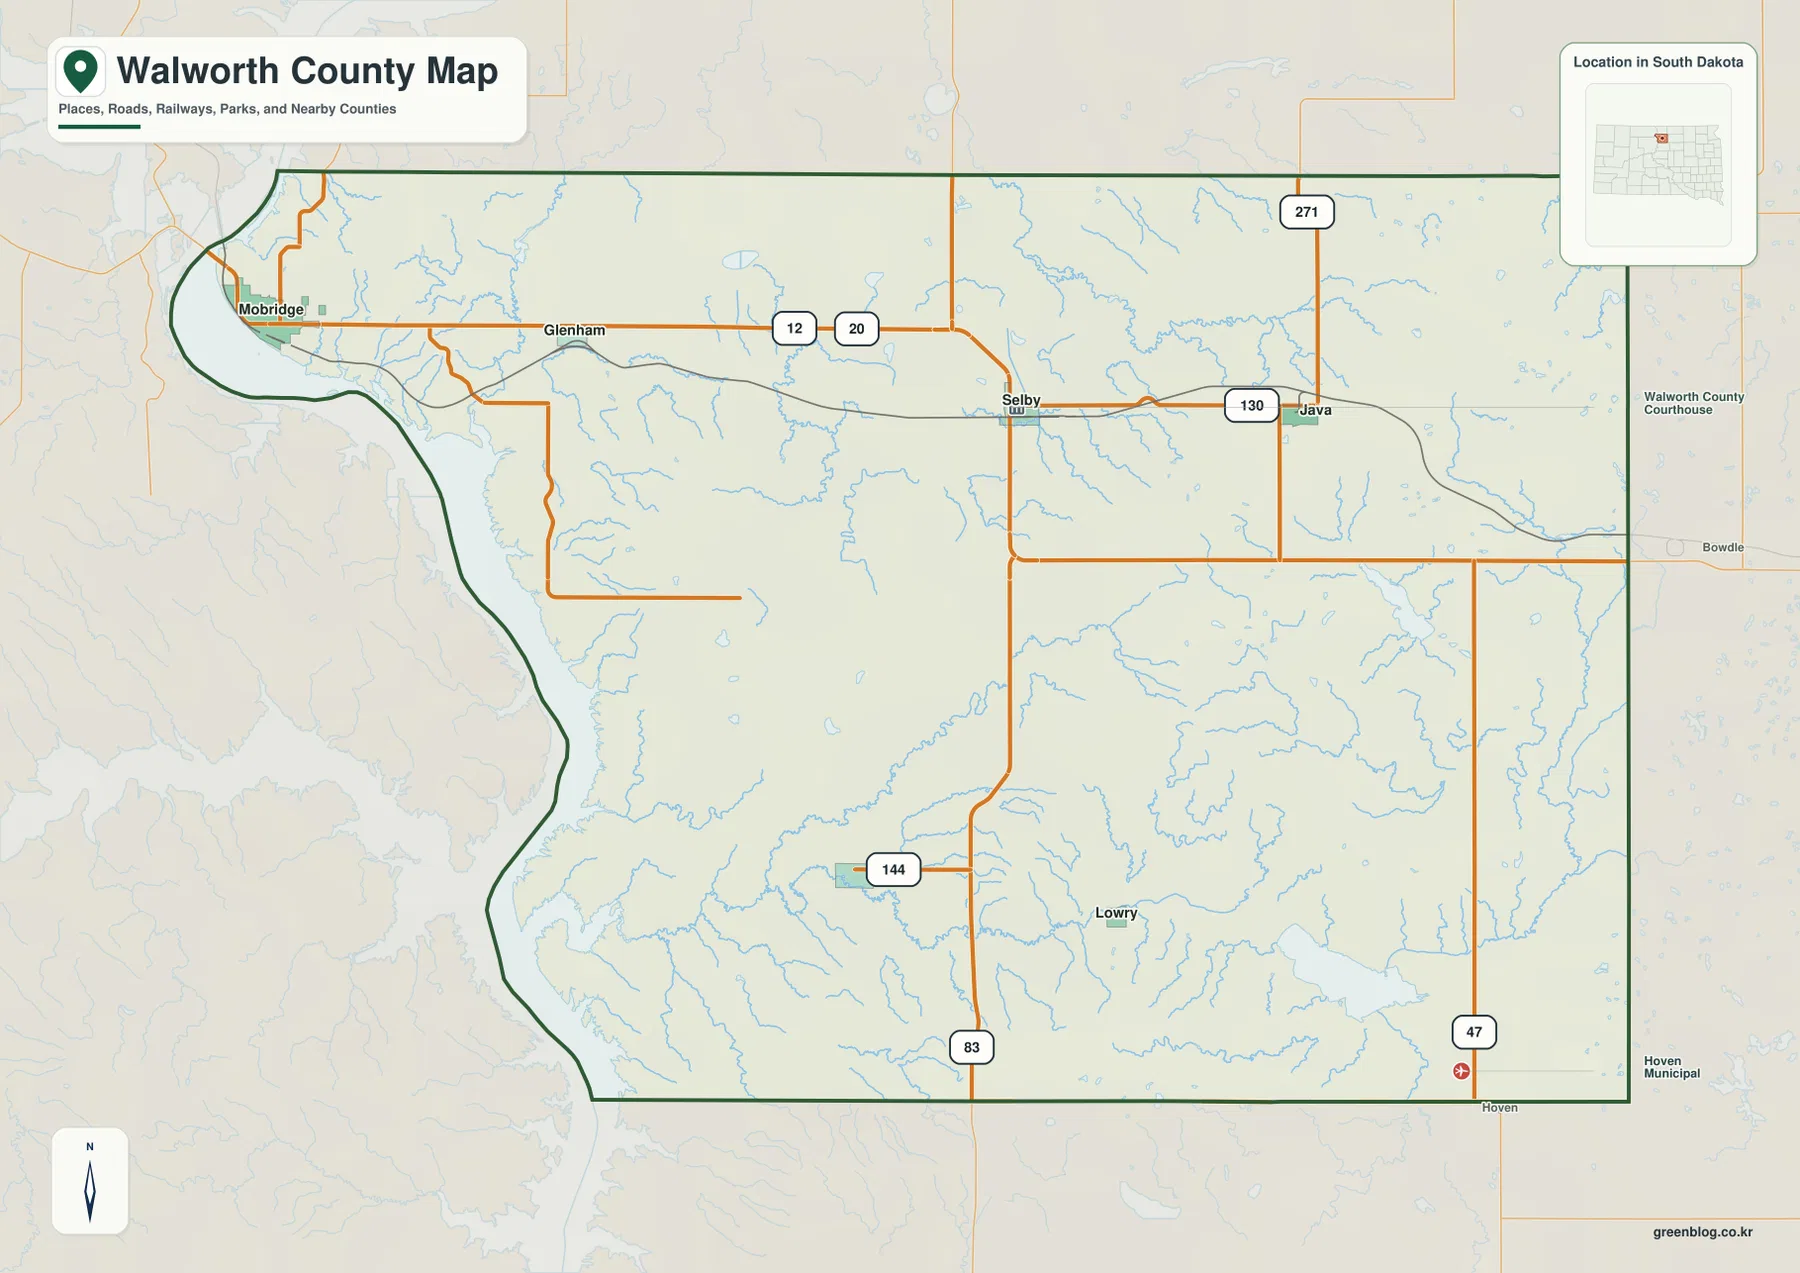
The city map removes much of the road detail and emphasizes six named communities. Mobridge is ranked first in the map index and is positioned at the western edge. Selby is second and occupies a more central-northern position. Akaska is farther south and west of the county center, while Glenham is east of Mobridge on the northern route. Java lies east of Selby, and Lowry is in the southern half of the county.
This distribution matters because the communities are not clustered around a single central point. Four of them—Mobridge, Glenham, Selby, and Java—form a broad northern sequence, but even those places are separated by sizable gaps. Akaska and Lowry are set apart in the south. The pattern makes the county feel wide and open on the map, with the named places serving as isolated reference points rather than one continuous urban corridor.
The numbered city markers should be read as a simple index, not as driving distances. The apparent spacing between points does not replace a road map or navigation service. What the map does especially well is show which communities are closest to the western water boundary, which are nearer the eastern side, and how far the southern places sit from the northern road corridor. For a visitor who only needs a quick geographic overview, this uncluttered layout is often easier to read than the full base map.
Water shapes the west side and threads through the southern interior
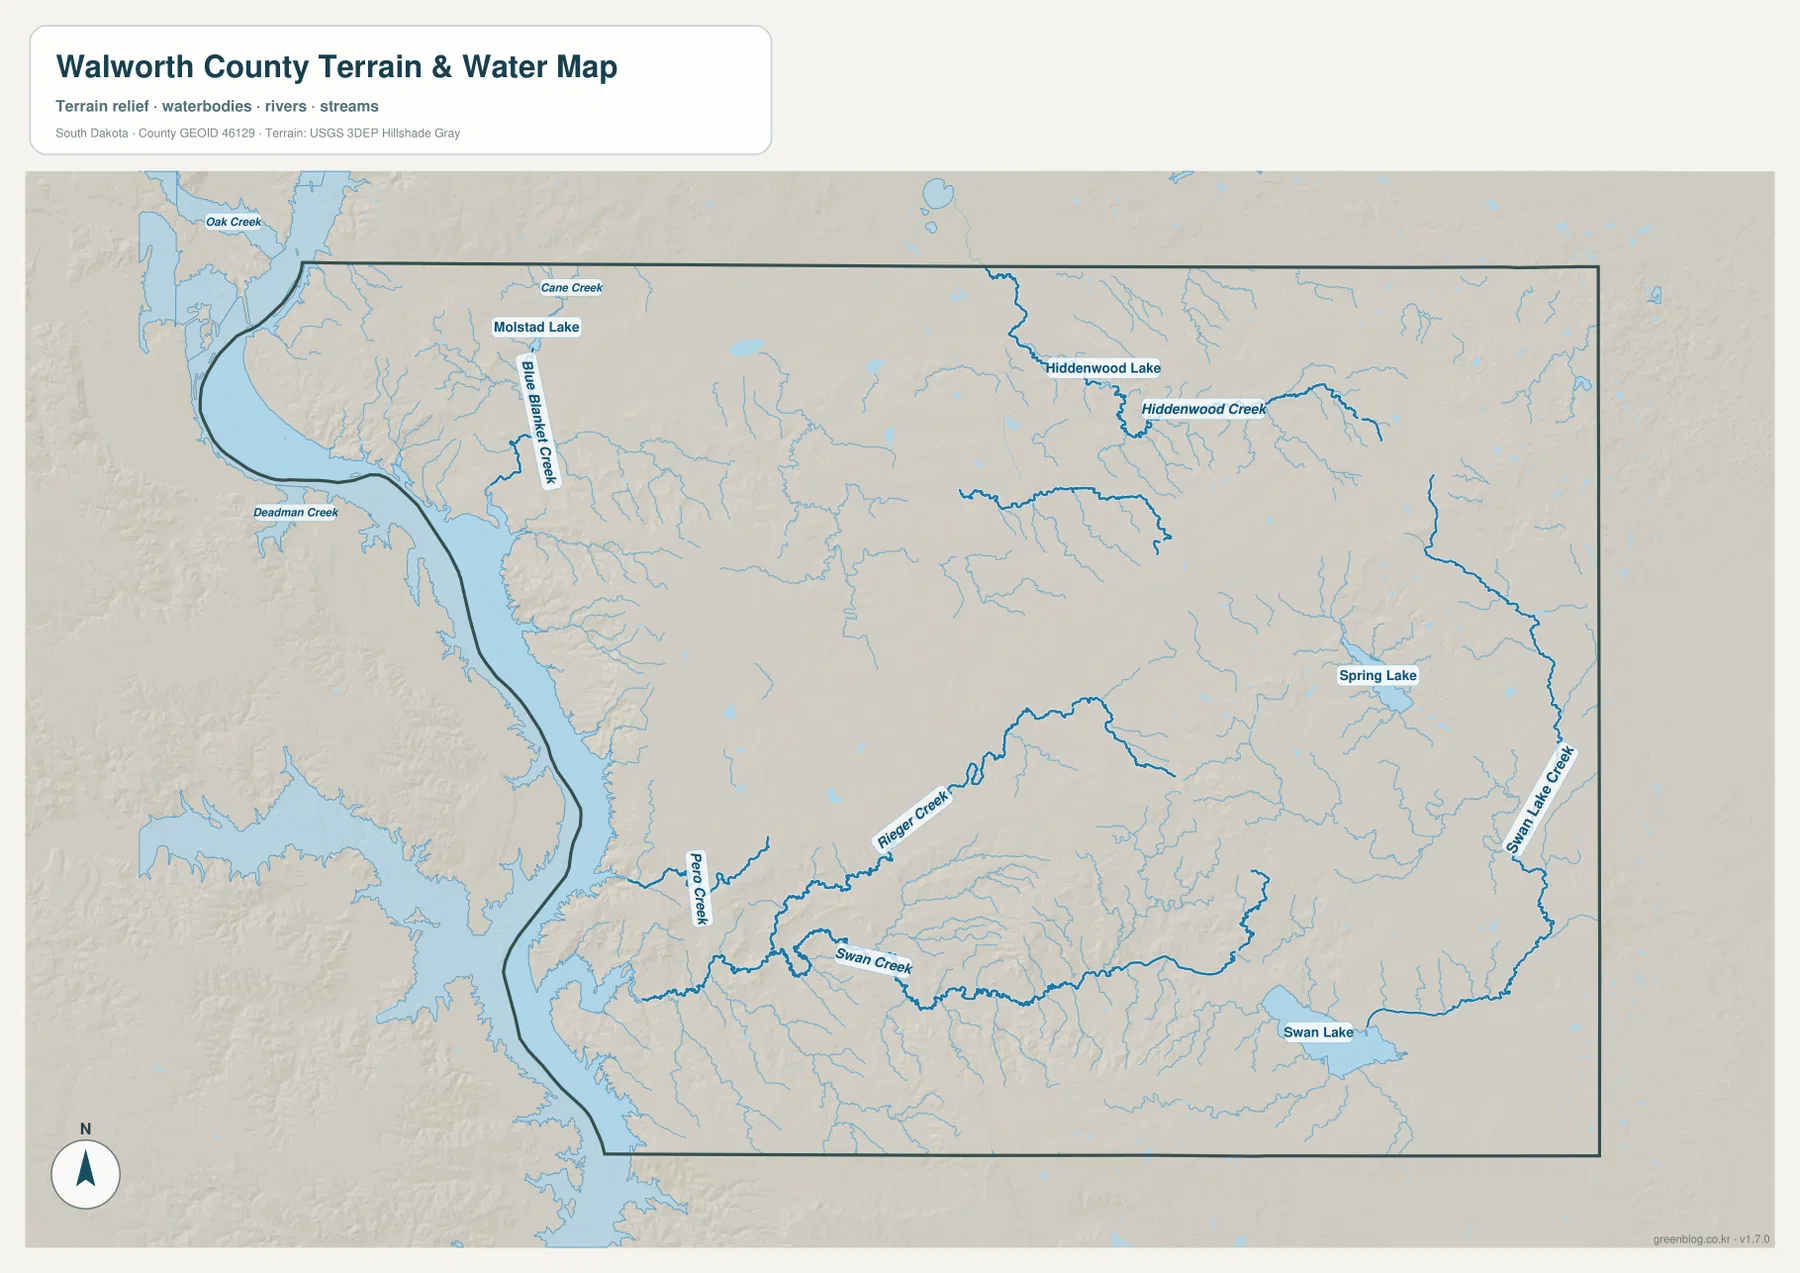
The terrain and water map explains the county’s western outline more clearly than the general map. A broad water body runs along the western side, and the county boundary follows its curves. Oak Creek and Deadman Creek are labeled near the northwest, while Molstad Lake and Blue Blanket Creek appear just inside the county. These names give the western part of the map a strong water-related identity and help explain why the outer boundary is so different from the straighter lines to the east.
In the northeast, Hiddenwood Lake and Hiddenwood Creek appear close together. Spring Lake is marked farther south and east, and Swan Lake Creek follows the eastern side. Swan Lake itself is visible in the southern portion of the county. The network is not limited to a few large named features; numerous smaller tributaries spread between them, especially across the southern half.
Swan Creek and Rieger Creek form prominent winding lines through the south-central interior, while Pago Creek approaches the large western water body. These creek courses are much easier to follow on this map because the water lines are highlighted. The terrain background also shows shallow valleys around many of them, giving a useful visual connection between drainage and relief without requiring technical GIS interpretation.
This map should be used as a water-reference map, not as a flood, boating, parcel, or water-quality map. It does not show flood zones, channel depth, legal access, navigational conditions, or property restrictions. Anyone planning activity on or near the water should check the appropriate current official source. For general geographic reading, however, it is very useful for linking place direction with named creeks and lakes.
Low ground along the west contrasts with higher eastern terrain
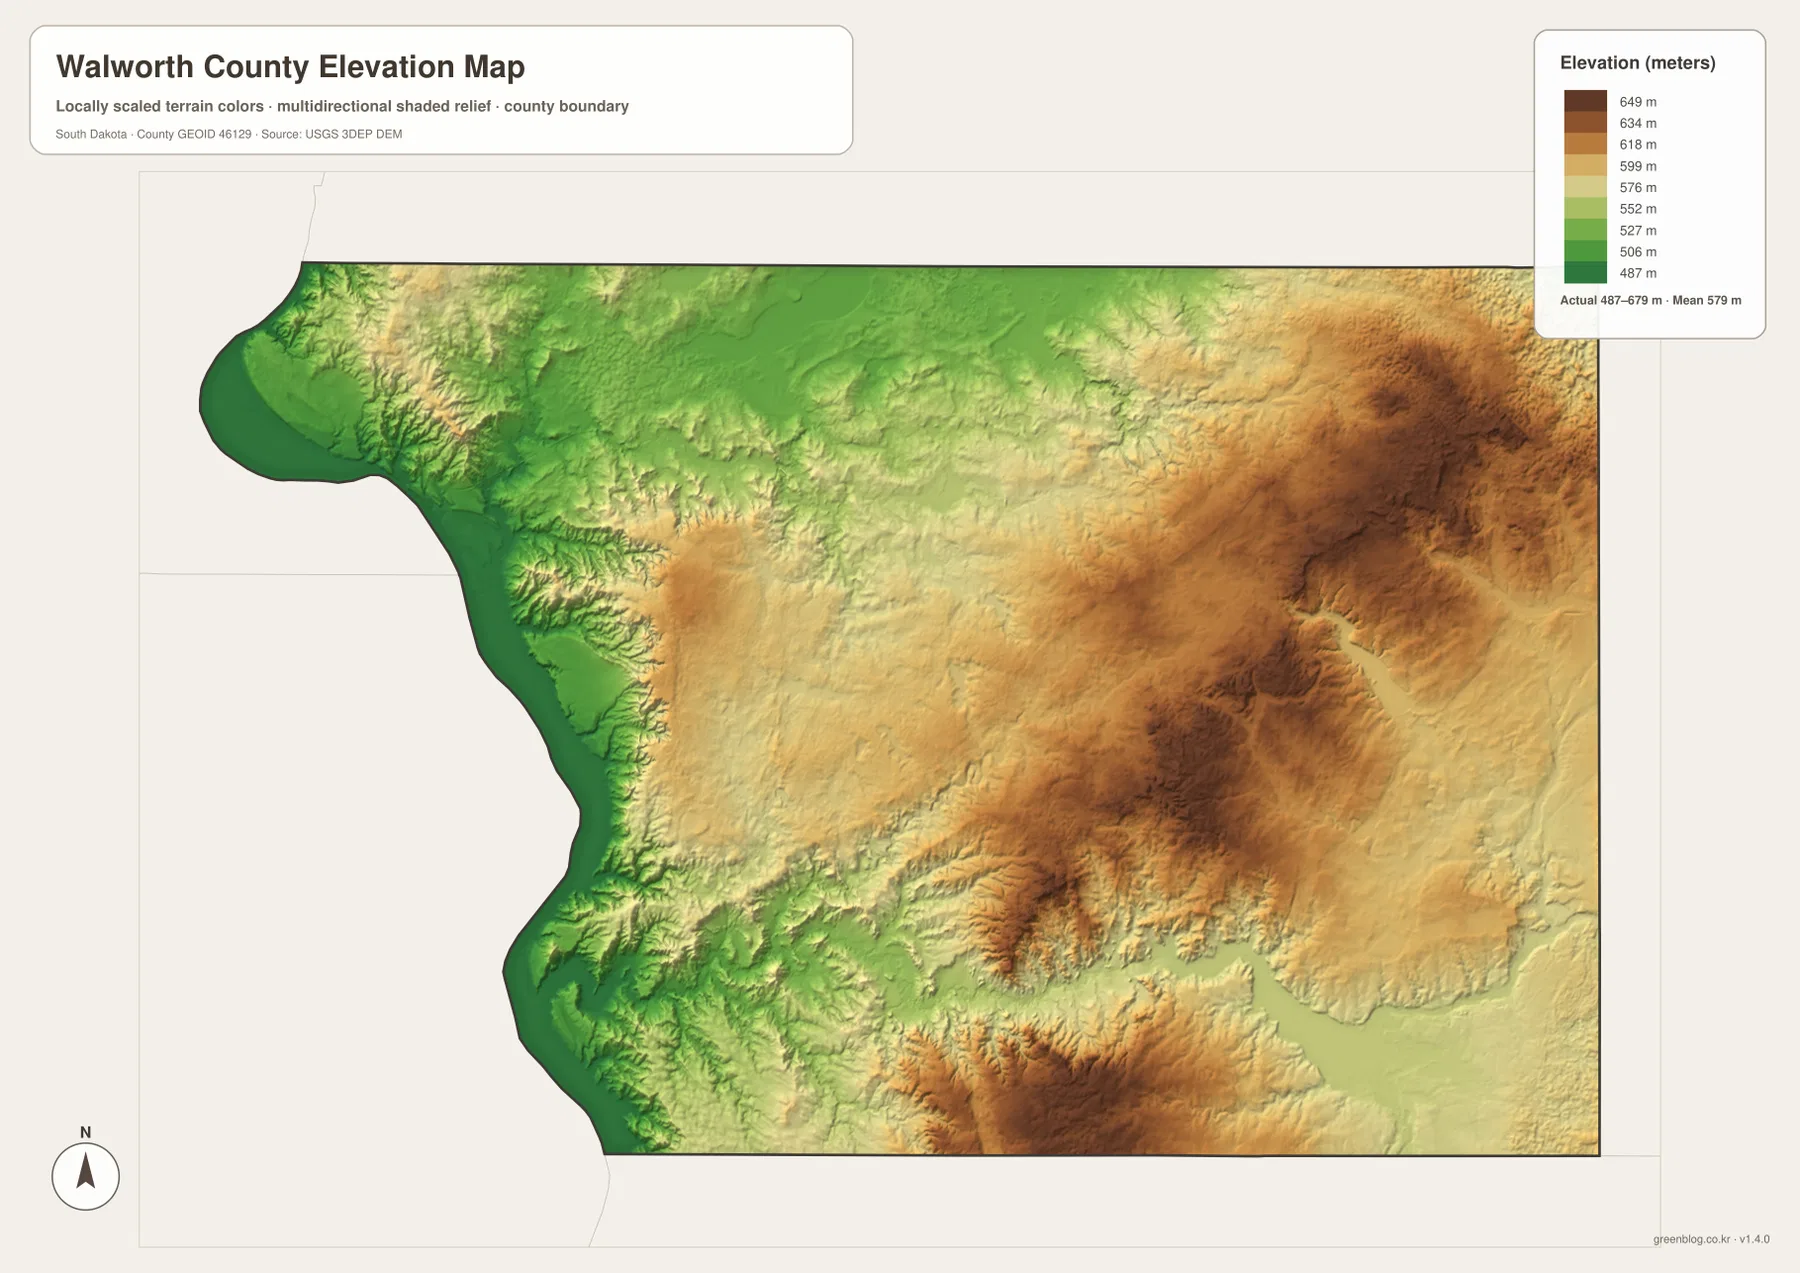
The elevation map strips away most names and roads so the height differences become the main subject. Its legend shows an actual mapped range of about 487 to 679 meters, with a mean near 579 meters. Green marks lower areas, while yellow and brown represent progressively higher ground. The strongest low-elevation band follows the western side beside the broad water boundary. The northwestern projection and the lower southwestern edge are both distinctly green.
Moving inland, the colors shift toward lighter green and yellow. Higher brown terrain becomes much more prominent in the eastern half, including a broad rise in the northeast and another high area through the southeast. These elevated zones are not smooth blocks. Narrower valleys cut between ridges and rounded high areas, producing a more varied surface than the general road map suggests.
The water map helps explain that relief. Many creeks follow lower channels between higher areas, and the land generally drops toward the large water body on the west. In the east and southeast, drainage lines cut through the higher ground and create repeated bands of lower terrain. Comparing the two maps side by side gives a clearer picture of how water and elevation relate across the county.
The elevation surface is generalized for county-wide comparison. The legend is useful for seeing relative height, but it should not be treated as survey-grade measurement for a specific property, engineering project, drainage design, or construction decision. Those uses require more detailed official elevation data or field surveying.
Choosing the map that fits the question
For a first look at the county, start with the general map. It combines boundary shape, named places, roads, and neighboring counties, so it answers basic questions such as where Mobridge sits, how Selby relates to Java, and which direction the main roads run. It is also the clearest choice when the county outline itself matters, because the western curve and the straighter eastern edge are both visible at once.
If community location is the main concern, the city map is faster to scan. The six numbered places stand out without competing with a dense road network. For lakes and creeks, switch to the water map, where Hiddenwood Lake, Spring Lake, Swan Lake, Swan Creek, Rieger Creek, and other named features are easier to find. The elevation map is the best option when the question is not where a place lies but how high or low the surrounding ground is.
The maps also work well in pairs. The general map plus the water map explains why the west boundary curves. The city map plus the general map shows how the named communities connect to the road network. The water map plus the elevation map reveals how creeks follow lower channels and how the county rises away from the western water edge. Using two views this way often gives more useful context than trying to read every detail from a single image.
For printing, the JPG files in the downloadable archive are preferable to the smaller on-page WebP previews. They can be placed into a document or presentation and scaled to fit the page. Because the original images are much larger than the web previews, labels and boundary lines remain clearer when reduced for standard page sizes.
Reading the layers together without overinterpreting them
No single map on this page is meant to answer every geographic question. The road and boundary map makes the county outline obvious, but it does not emphasize relief. The water map shows the creek network, but it is not designed to tell you where current roads are open. The elevation map reveals broad differences in height but leaves out community names. Treating each image as a layer with a specific purpose produces a more accurate reading.
Mobridge is a good example. On the general map it is a named place close to the northwestern boundary. On the water map that same area is clearly tied to the large western water body. On the elevation map it sits within the lower western terrain. Selby and Java tell a different story: their northern positions are easy to follow on the road map, while the elevation map shows that the landscape farther east rises above the western lowland.
The southern part of the county also changes depending on the layer. Akaska and Lowry provide human reference points on the city map, while the water map reveals a web of creeks and lakes around the broader southern area. The elevation map adds ridges and lower channels that are not obvious in the place-name view. Reading these layers together gives a richer sense of the county without turning the maps into products they were never meant to be.
Road lines should not be read as live traffic information, blue water lines should not be read as flood boundaries, and elevation colors should not be read as legal or parcel information. For decisions that depend on current conditions or exact measurements, use the appropriate official source and, when necessary, professional field data.
Frequently Asked Questions
How does elevation change from west to east in Walworth County?
On the supplied elevation map, the lowest terrain is concentrated along the western water boundary and is shown in green. The land becomes higher inland, with broader yellow and brown areas in the east and southeast. The map legend spans roughly 487 to 679 meters, but those values are intended for county-wide comparison rather than precise site surveying.
Where are Mobridge, Selby, and Java in relation to one another?
Mobridge is near the curved northwestern edge of the county. Glenham lies to its east, Selby is farther east in the northern interior, and Java is east of Selby. Together they form a loose west-to-east sequence across the northern part of Walworth County.
Can the water map be used to check flood risk?
No. The water map is a reference for the location of rivers, creeks, lakes, and the broad western water boundary. It does not show flood hazard zones, water depth, navigation conditions, property boundaries, or regulatory restrictions. Use a current official flood or water-management source for those questions.
Map File Information
The ZIP package contains four high-resolution JPG files: the county map, city map, water map, and elevation map. Review the previews above, then download the archive for printing, presentations, classroom material, or personal reference.
- Included Files: Use only the versions confirmed in the article and supplied images
- File Type: Use the confirmed download contents
- Intended Use: Printing, education, presentations, and map-based projects
Related Maps
Sources and reference data
For more detailed or current geographic information, these official sources are useful companions to the maps on this page.
- U.S. Census Bureau TIGER/Line Shapefiles – county boundaries, roads, and geographic reference data
- USGS National Hydrography – rivers, streams, lakes, and other hydrographic data
- USGS 3D Elevation Program – national elevation data and 3DEP information
Green Map creates custom-edited map images using open geographic data sources such as geoBoundaries, Natural Earth, OpenStreetMap, and government open data.
These maps are edited visual materials, not raw data files, and are provided for education, documents, presentations, and graphic reference.