Coal plays two very different roles in the world’s electricity systems. In the common-year 2021 World Bank WDI data, 118 of the 208 countries and economies with numeric observations report a coal share of exactly 0%, while 15 generate at least half of their electricity from coal-category fuels. South Korea is at 35.4%, China at 63.0%, and India at 71.5%. The map therefore does not describe one global norm; it shows a split between systems where coal is absent or marginal and a much smaller group where it remains central to the generation mix.
The measure used here is EG.ELC.COAL.ZS, the coal share of total electricity production. It answers a composition question: out of all electricity produced within an economy, what percentage came from coal-category fuels? It does not measure coal mining, coal exports, installed coal capacity, or tonnes of coal burned. Keeping that denominator in view is essential because a small power system with a 70% share can still produce far less coal-fired electricity than a very large system with a 30% share.
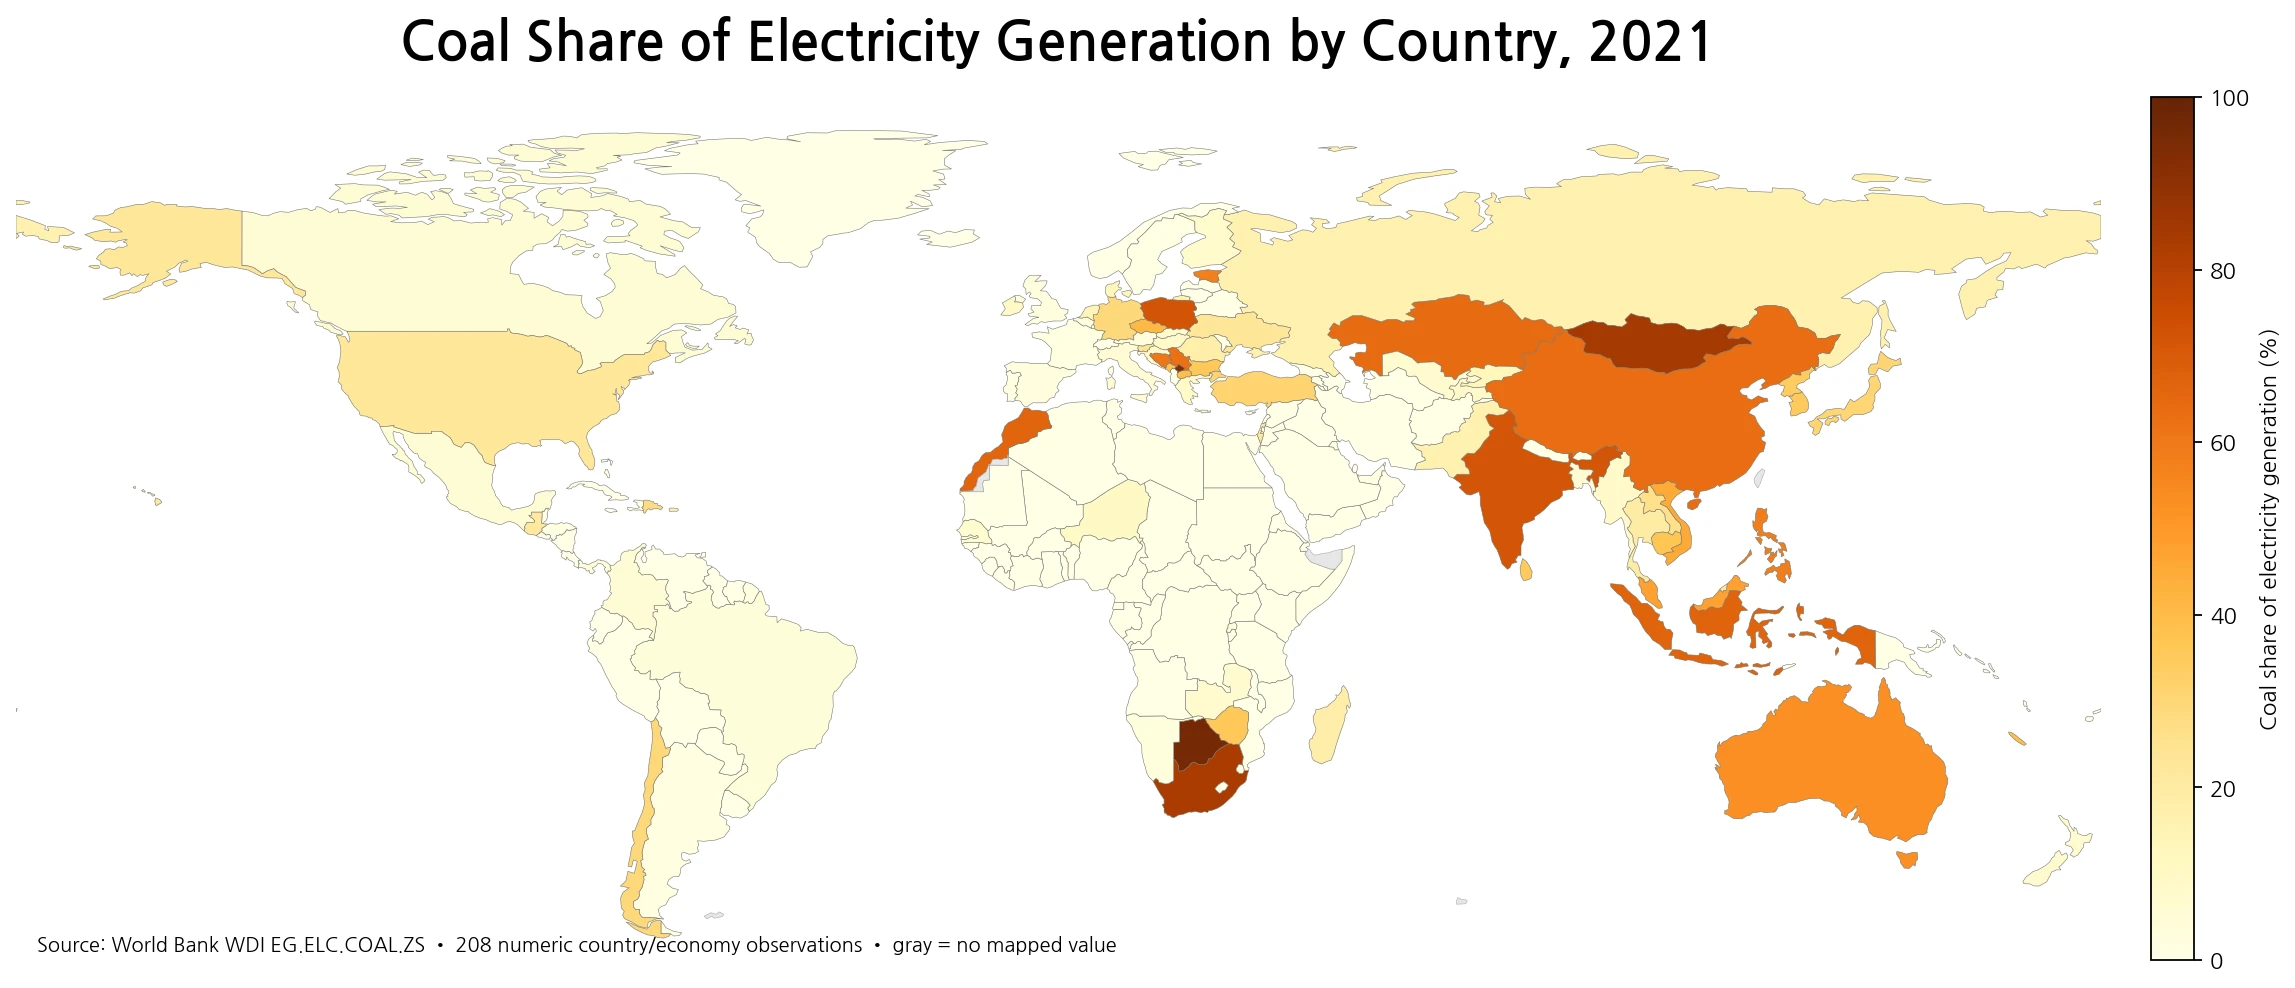
Table of Contents
More than half of reported electricity systems sit at 0% coal
A four-band view makes the distribution easier to interpret. Exactly 118 observations, or 56.7% of the numeric set, are 0%. Another 55 are above zero but below 25%. Twenty fall between 25% and 50%, and only 15 are at 50% or higher. Coal dependence is therefore concentrated in a minority of reported systems rather than spread evenly across the world.
| 2021 coal share | Countries/economies | Share of 208 |
|---|---|---|
| 0% | 118 | 56.7% |
| >0% to <25% | 55 | 26.4% |
| 25% to <50% | 20 | 9.6% |
| 50%+ | 15 | 7.2% |
The unweighted mean is 10.7% and the median is 0.0%. Those statistics summarize the cross-country distribution only. They are not estimates of coal’s share of total world electricity because every economy receives one equal statistical weight. China, India, and the United States count once each, just as a small island economy does. A world generation-weighted share would require total electricity generation as a separate weight.
The highest shares range from Botswana and Kosovo to major Asian power markets
Botswana has the highest 2021 observation at 96.1%, followed by Kosovo at 93.4%, Mongolia at 84.3%, and South Africa at 83.2%. Poland is at 72.3% and India at 71.5%. Indonesia, Morocco, Kazakhstan, and China all sit between roughly 63% and 67%. The upper end is geographically diverse, spanning Southern Africa, Europe, Central Asia, East Asia, South Asia, Southeast Asia, and North Africa.
| Country or economy | Coal share in 2021 |
|---|---|
| Botswana | 96.1% |
| Kosovo | 93.4% |
| Mongolia | 84.3% |
| South Africa | 83.2% |
| Poland | 72.3% |
| India | 71.5% |
| Indonesia | 66.9% |
| Morocco | 66.5% |
| Kazakhstan | 64.1% |
| China | 63.0% |
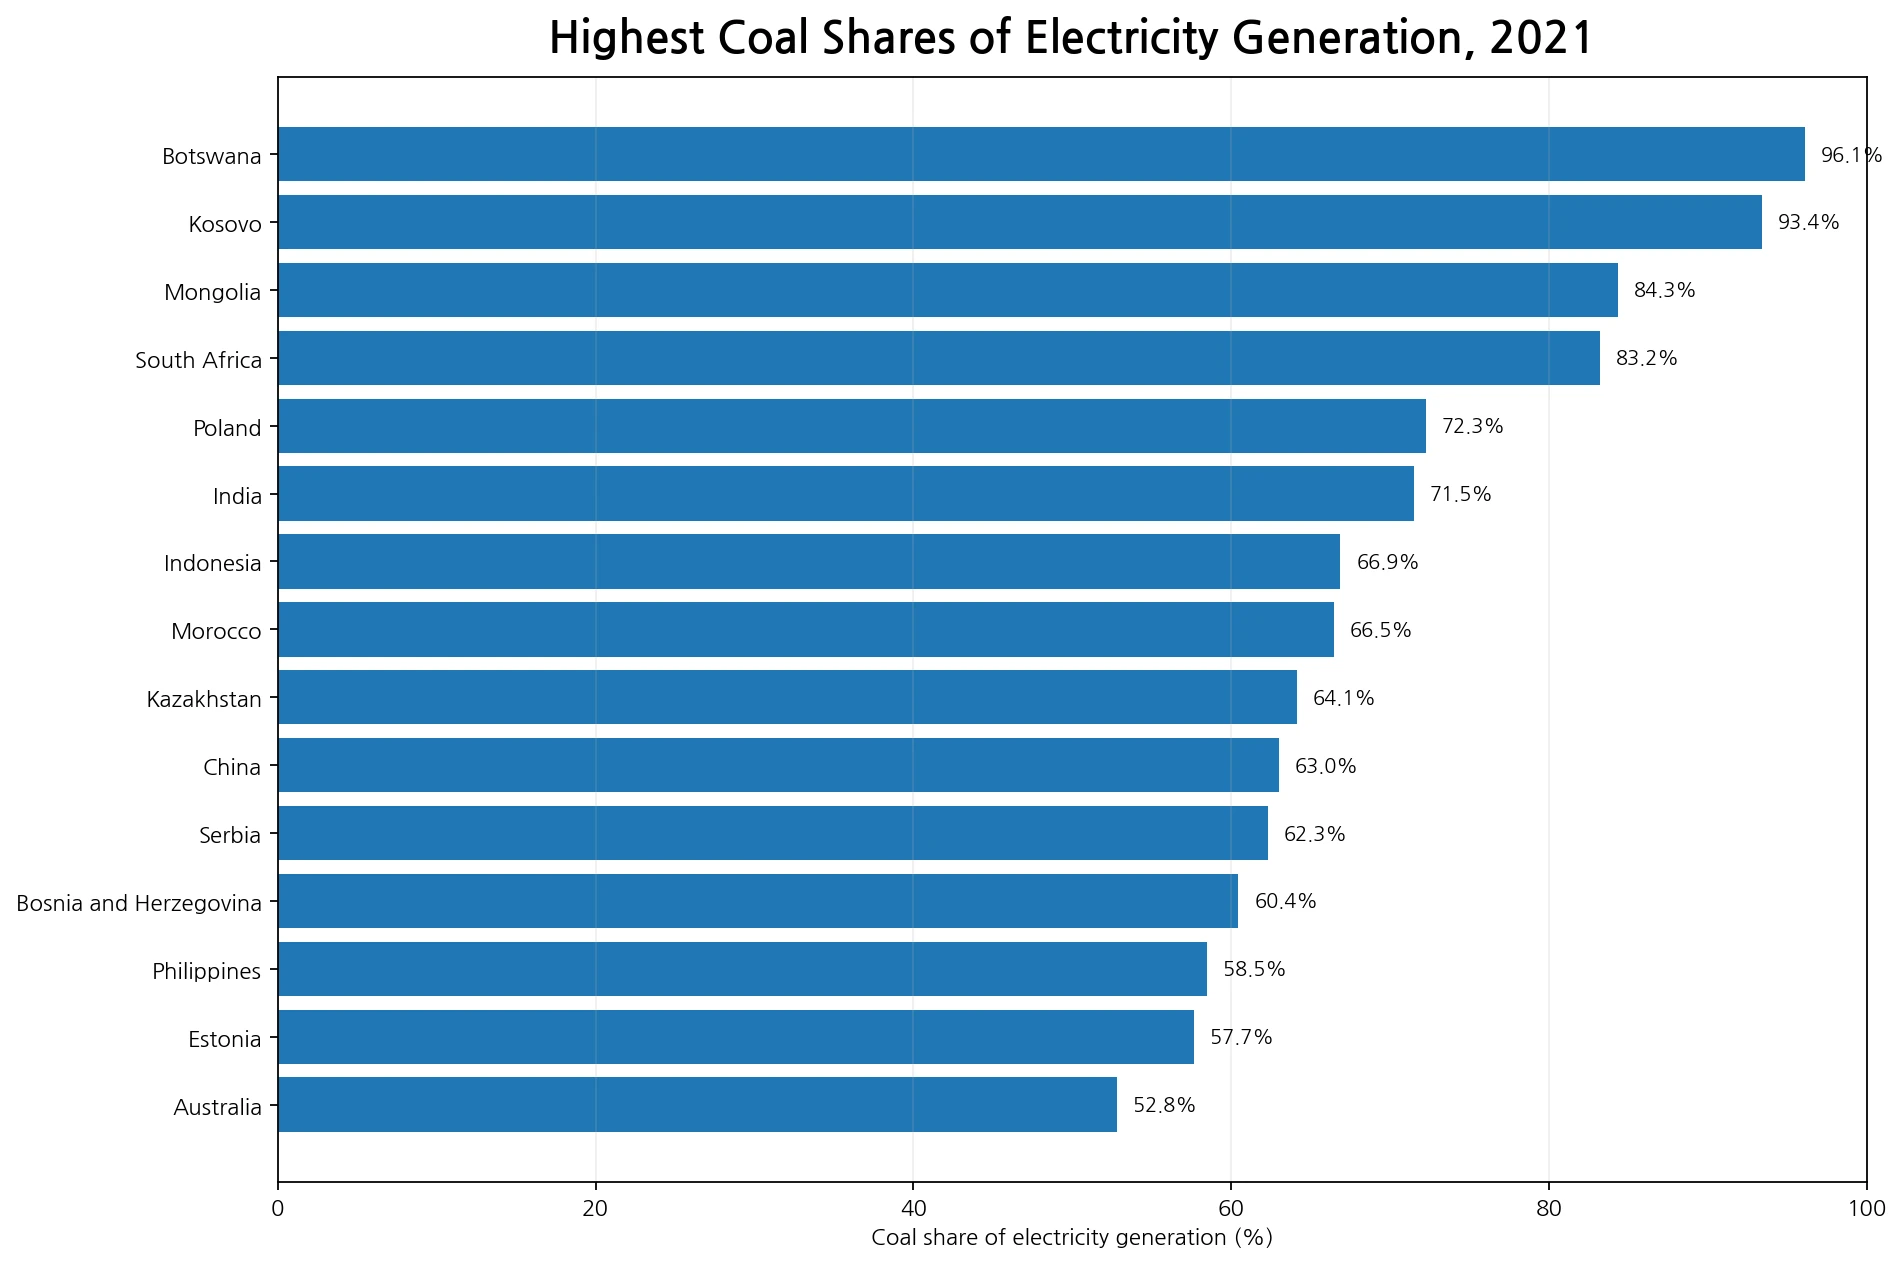
Percentage rank should not be confused with output volume. Botswana’s share is much higher than China’s, but that does not mean Botswana produces more coal-fired electricity. The indicator tells us how dependent each electricity mix is on coal, not how many terawatt-hours a country generates from it.
South Korea sits below coal-heavy China and India but above Japan and the United States
South Korea’s 2021 coal share is 35.4%, the 27th-highest observation among the 208 numeric rows. India is at 71.5%, China 63.0%, Australia 52.8%, and Viet Nam 45.4%. South Korea is lower than those economies but higher than Japan at 30.6%, Germany at 29.5%, the United States at 22.7%, and the Russian Federation at 16.2%.
| Selected economy | Coal share in 2021 |
|---|---|
| India | 71.5% |
| China | 63.0% |
| Australia | 52.8% |
| Viet Nam | 45.4% |
| South Korea | 35.4% |
| Japan | 30.6% |
| Germany | 29.5% |
| United States | 22.7% |
| Russian Federation | 16.2% |
The 75th percentile of the country/economy distribution is only about 9.6%, while the 90th percentile is about 38.5%. South Korea is therefore far above the broad low-coal majority but just below the top decile threshold. That position is more informative than calling 35.4% simply “high” or “low,” because the global distribution is heavily concentrated at zero.
Asia contains many high-share large markets, while Europe is much more divided
Several Asian electricity systems remain in the upper part of the 2021 distribution. Mongolia is at 84.3%, India 71.5%, Indonesia 66.9%, Kazakhstan 64.1%, China 63.0%, and the Philippines 58.5%. Malaysia is at 47.9%, Viet Nam 45.4%, South Korea 35.4%, and Japan 30.6%. These values do not mean every Asian economy is coal-heavy, but they show that many of the world’s high-share observations include large and industrially important Asian power markets.
Europe shows a wider internal spread. Poland is at 72.3%, Serbia 62.3%, Bosnia and Herzegovina 60.4%, Estonia 57.7%, and Czechia 40.9%. Germany is lower at 29.5%, Greece 9.7%, the United Kingdom 2.5%, and France 1.3%. A single “European coal share” would hide those differences, so country-level comparison is much more useful than a broad regional label.
A coal share is a dependence measure, not a measure of coal-fired output
The strength of a percentage indicator is comparability across power systems of very different sizes. Its limitation is that scale disappears. A 60% coal share in a small system can correspond to fewer coal-fired kilowatt-hours than a 20% share in a very large system. Comparing absolute output therefore requires total generation and source-specific generation in GWh or TWh.
The same caution applies to installed capacity and emissions. A coal share does not reveal the age or efficiency of power plants, the utilization of the fleet, the type of coal burned, or the amount of electricity generated in total. Those variables are necessary for estimating fuel use or carbon emissions. This map is best read as a measure of coal’s position inside the electricity mix.
Reported zero and missing data are kept separate
The cleaned 2021 table contains 118 genuine numeric observations at 0.0%. They are included in the distribution and are the reason the median is zero. Nine other country/economy rows have no 2021 value and remain missing. They were not converted to zero and were not filled with observations from another year, because doing so would undermine the common-year comparison.
Map visibility adds another distinction. The statistical analysis uses all 208 numeric observations, but 170 polygons are directly filled in the low-resolution world boundary layer. Very small islands and separately reported economies can have valid statistics without appearing as distinct polygons. A gray or invisible area should therefore not automatically be interpreted as 0% coal.
The map identifies where dependence is high; separate evidence is needed to explain why
The 2021 values can show where coal occupies a large share of electricity generation, but they do not contain causal variables. Domestic coal resources, plant age, fuel prices, electricity-demand growth, grid constraints, nuclear and hydro availability, renewable deployment, policy, and retirement schedules can all matter. None of those explanations should be inferred from the percentage alone.
A stronger follow-up analysis would pair the coal share with total generation and same-year shares for natural gas, nuclear, hydropower, wind, and solar. A time series would answer a different question again: whether coal dependence is falling or rising. This article deliberately keeps those questions separate from the single-year spatial comparison.
Data source and mapping method
The statistical source is World Bank World Development Indicators series EG.ELC.COAL.ZS, which measures electricity production from coal sources as a percentage of total electricity production. World Bank metadata identifies the IEA Energy Statistics Data Browser as the underlying source. This comparison keeps 2021 fixed across countries instead of mixing different “latest available” years.
The map was produced by joining the verified ISO-3 values to low-resolution Natural Earth country boundaries. All 208 numeric country/economy observations are used for rankings, percentiles, and distribution statistics, while nine missing rows remain missing. The map layer and the statistical table are treated separately so small economies that are not visible as standalone polygons are not accidentally removed from the analysis.
Frequently Asked Questions
What was South Korea’s coal share of electricity generation in 2021?
South Korea was at about 35.4% in World Bank WDI series EG.ELC.COAL.ZS. That ranks 27th among the 208 numeric country/economy observations used here.
What do China’s 63.0% and India’s 71.5% values mean?
They mean that coal-category fuels supplied those shares of each economy’s total electricity production in 2021. They are not shares of world coal production or coal consumption.
Does Botswana’s 96.1% mean it produced more coal-fired electricity than China?
No. The indicator is a percentage within each electricity system. Absolute coal-fired generation requires source-specific output in GWh or TWh and can rank very differently.
Are 0% coal observations the same as missing values?
No. The 2021 table contains 118 reported 0.0% observations and nine separate missing rows. Missing values were not converted to zero or filled from another year.
Related Articles
These Green Map articles extend the comparison to other parts of the energy system and to electricity access.
- Global Renewable Energy Share Map – 2021 Final Energy Consumption by Country
- Global Electricity Access Map – 2024 Country Comparison
- Global GDP Growth Map – Country Patterns in 2025
Green Map creates custom-edited map images using open geographic data sources such as geoBoundaries, Natural Earth, OpenStreetMap, and government open data.
These maps are edited visual materials, not raw data files, and are provided for education, documents, presentations, and graphic reference.