The 2021 renewable electricity generation share varies across almost the full 0–100% range when countries and economies are compared on a common year. This article uses World Bank World Development Indicators series EG.ELC.RNEW.ZS, which measures electricity generated by renewable power plants as a percentage of total electricity output from all power plants. It is a generation-mix indicator, not installed renewable capacity and not the renewable share of total final energy consumption.
The cleaned master table contains 217 World Bank country/economy rows. Of those, 204 have a numeric 2021 observation and 13 remain source-missing for the same-year comparison. Across the numeric observations, the unweighted mean is 34.0% and the median is 22.8%. The first quartile is 6.4% and the third quartile 61.4%, showing that the distribution is broad rather than clustered around one typical electricity mix.
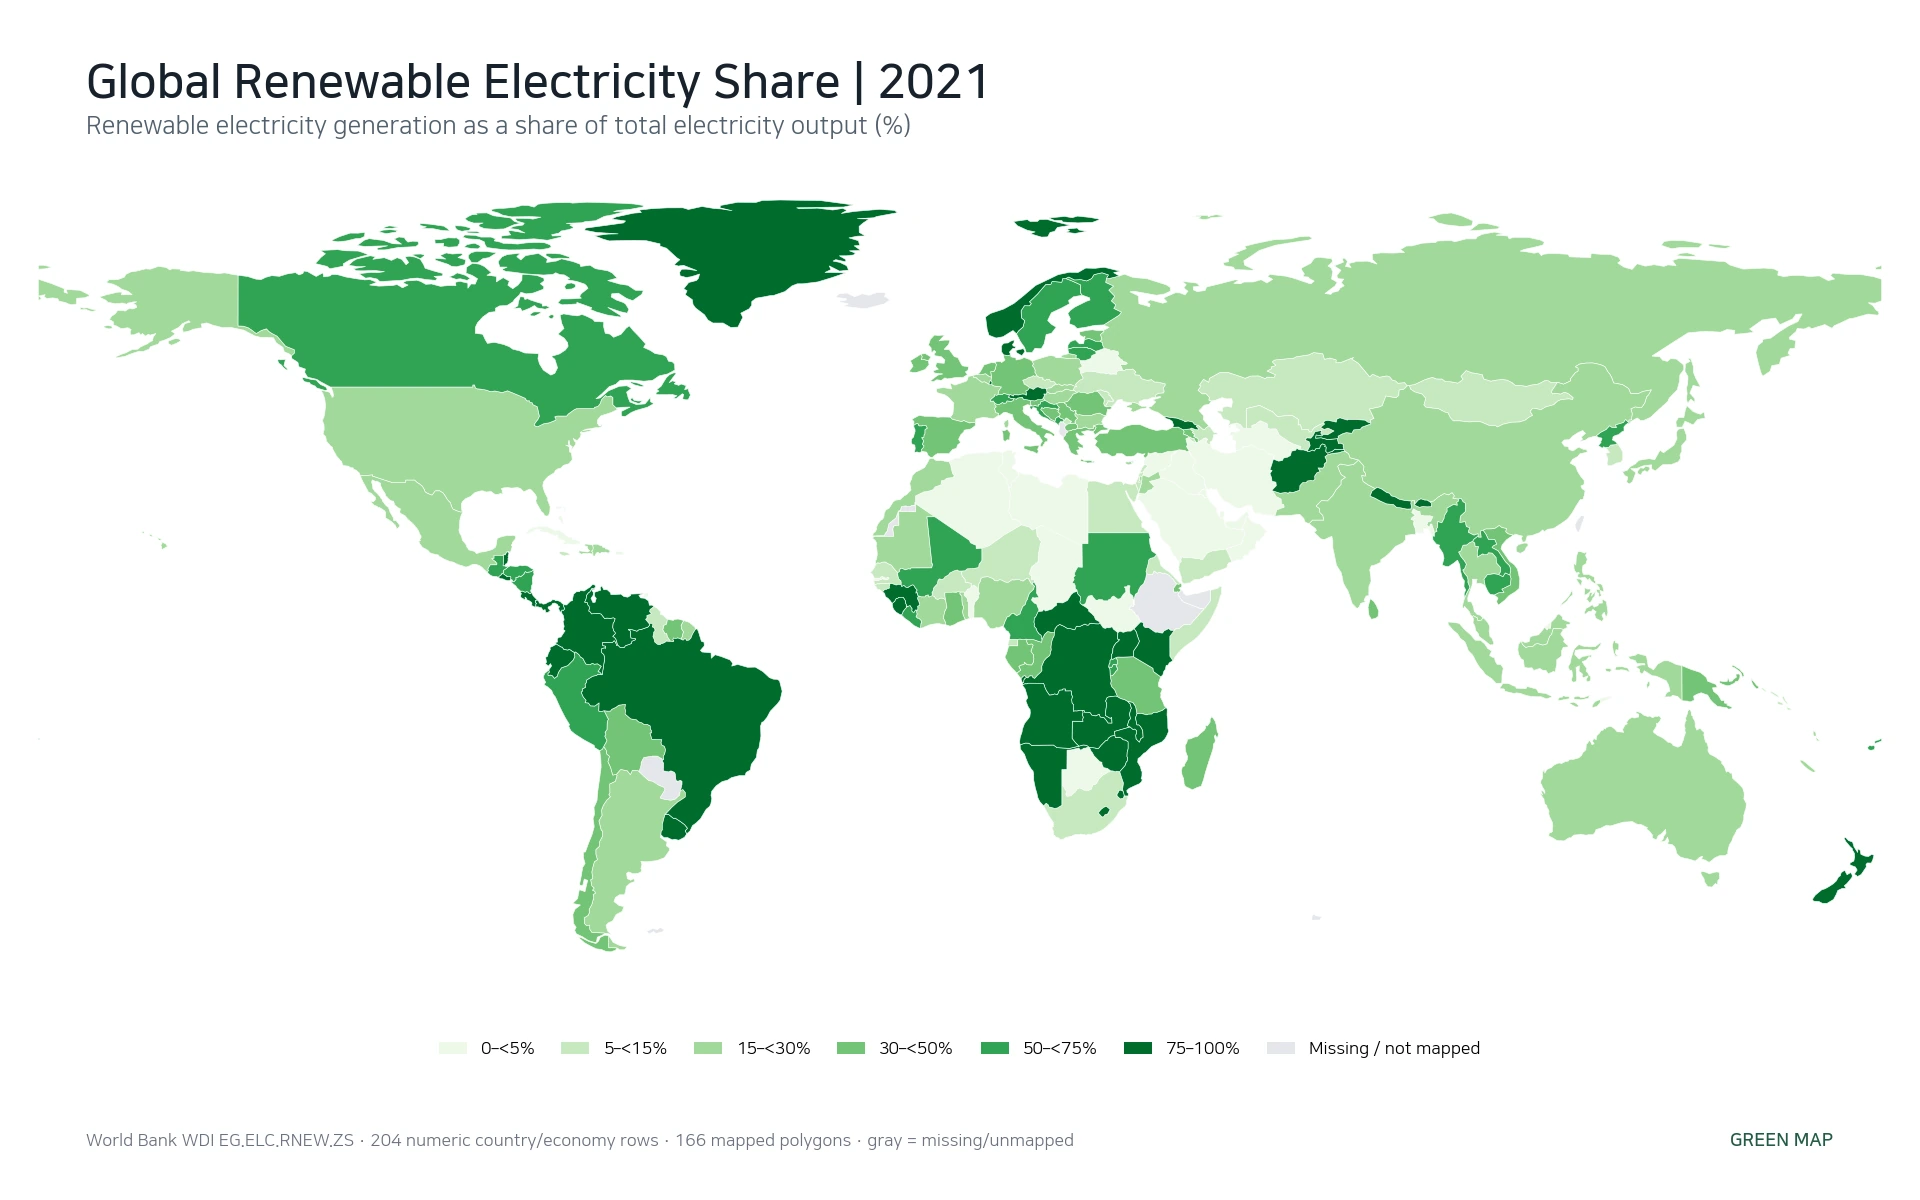
Table of Contents
What the renewable electricity share actually measures
The numerator is electricity generated from renewable sources, while the denominator is total electricity output from all generating sources. World Bank metadata describes the renewable component as hydropower, wind, solar, biomass, geothermal, and ocean energy. Total electricity output includes fossil-fuel, nuclear, and renewable generation. A reported 50% therefore means renewable power plants supplied half of the electricity generated in that economy under the indicator definition.
That definition makes the metric different from installed capacity. A country can add large amounts of wind or solar capacity without producing the same percentage of annual electricity if utilization, weather, grid constraints, or the output of other generators changes. It also means a hydro-dominated system can report a very high renewable electricity share even if wind and solar play a smaller role. The map should therefore be read as a generation outcome, not a ranking of one technology.
The official definition and calculation notes are available in the World Bank WDI metadata glossary. The World Bank lists the IEA Energy Statistics Data Browser as the underlying source for this series.
The 2021 distribution covers nearly the entire percentage scale
Among the 204 numeric country/economy observations, 44 are below 5%, 32 are from 5% to below 15%, and 39 are from 15% to below 30%. At the upper end, 60 are at or above 50%, 36 at or above 75%, and 14 at or above 90%. The coexistence of near-zero and near-100% systems is more informative than a single average.
| 2021 renewable electricity share | Country/economy observations | Share of 204 |
|---|---|---|
| 0–<5% | 44 | 21.6% |
| 5–<15% | 32 | 15.7% |
| 15–<30% | 39 | 19.1% |
| 30–<50% | 29 | 14.2% |
| 50–<75% | 24 | 11.8% |
| 75–100% | 36 | 17.6% |
The median of 22.8% means half of the reported economies are below that level and half are above it. The third-quartile threshold is 61.4%, so an economy needs a value above roughly 61% to enter the top quarter of this unweighted distribution. The first quartile is only 6.4%, another sign that the spread between electricity systems is large.
Several of the highest observations are above 90%
Bhutan records the highest 2021 observation at 100.0%, followed by Lesotho at 99.8%, Costa Rica at 99.4%, and Norway at 99.1%. The Central African Republic and El Salvador are also above 95%, while Tajikistan, Namibia, Andorra, and Belize remain above 90%.
| Country or economy | 2021 renewable electricity share |
|---|---|
| Bhutan | 100.0% |
| Lesotho | 99.8% |
| Costa Rica | 99.4% |
| Norway | 99.1% |
| Central African Republic | 96.5% |
| El Salvador | 95.6% |
| Tajikistan | 93.4% |
| Namibia | 93.4% |
| Andorra | 93.3% |
| Belize | 92.9% |
These rankings should not be converted into a wind-and-solar league table. Hydropower is part of the renewable numerator, and geothermal, biomass, and ocean energy can also contribute. A country-specific explanation requires generation-by-source data. The present dataset can identify where the share is high or low, but it does not isolate the technology or policy responsible for the observed value.
Near-zero reported values are not the same as missing data
At the low end, Comoros and Sint Maarten are recorded at 0.0%. Turkmenistan is 0.01%, Brunei Darussalam 0.02%, Libya 0.02%, Bahrain 0.04%, and Saudi Arabia 0.07%. In total, 18 numeric observations are below 1%.
A numeric zero must be separated from a missing observation. The 13 source-missing 2021 rows in this package are Albania, Bermuda, Channel Islands, Ethiopia, Gibraltar, Isle of Man, Iceland, Liechtenstein, Macao SAR, Monaco, Northern Mariana Islands, Paraguay, and San Marino. They remain NA. No zero substitution, interpolation, or prior-year backfill is used.
A displayed 0.0% should also be interpreted at the precision of the published series rather than treated as proof that every renewable generator was literally absent. This article preserves the official observation and avoids adding a technology-specific explanation that is not present in the cleaned file.
South Korea is 6.6%, while major economies span a wide range
South Korea records 6.6% in 2021. Japan is 21.1%, China 28.4%, and the United States 20.3%. Germany and the United Kingdom are near 40%, while Canada is 67.0% and Brazil 77.4%. Even among large economies, renewable electricity occupies very different positions in the generation mix.
| Economy | 2021 renewable electricity share |
|---|---|
| Brazil | 77.4% |
| Canada | 67.0% |
| United Kingdom | 40.2% |
| Germany | 39.8% |
| Turkiye | 35.4% |
| China | 28.4% |
| Australia | 26.7% |
| Mexico | 23.4% |
| France | 22.8% |
| Japan | 21.1% |
| United States | 20.3% |
| Russian Federation | 19.2% |
| India | 19.1% |
| Indonesia | 15.5% |
| Korea, Rep. | 6.6% |
| South Africa | 6.4% |
| United Arab Emirates | 4.2% |
| Saudi Arabia | 0.1% |
These percentages are not rankings of total renewable electricity generation. A smaller power system with a 90% share can generate less renewable electricity in absolute MWh than a large system with a 30% share. Absolute-scale comparisons require renewable output in GWh or TWh together with total electricity generation. The percentage map intentionally answers the composition question only.
This is different from renewable energy in total final consumption
A closely related World Bank indicator, EG.FEC.RNEW.ZS, measures renewable energy as a share of total final energy consumption. That denominator includes final energy uses beyond electricity, such as fuels and heat used by transport, industry, buildings, and households. The present EG.ELC.RNEW.ZS series restricts the question to electricity generation. The two indicators can therefore give substantially different percentages for the same economy and year without contradicting each other.
This distinction is why the title uses “renewable electricity generation share” rather than the broader phrase “renewable energy share.” A country with a relatively renewable power grid may still rely heavily on fossil fuels in transport or industrial heat. Conversely, direct renewable energy use outside the power sector can affect the final-energy indicator without changing the renewable share of electricity output.
The 34.0% simple mean is not the world renewable electricity share
If every one of the 204 reported countries and economies receives equal weight, the arithmetic mean is 34.0%. That is useful for describing the cross-country distribution, but it is not the percentage of global electricity generated from renewables. A tiny island economy and a very large electricity producer each count as one observation in this mean. A true global share requires weighting by total electricity output or using an official global aggregate constructed with the appropriate weights.
The same caution applies to the median and quartiles. They describe where country/economy observations sit in the distribution, not how the world’s MWh are divided among energy sources. A large, darkly shaded country on the map is not automatically the largest renewable generator either; geographic area is unrelated to annual electricity output.
Data source and mapping method
The statistical series is World Bank World Development Indicators EG.ELC.RNEW.ZS, “Renewable electricity output (% of total electricity output).” This completed package fixes the comparison to 2021 and uses 204 numeric observations from the 217-row World Bank country/economy master. The 13 missing observations are preserved as NA. Rankings, thresholds, mean, median, and quartiles are calculated directly from the cleaned CSV.
The choropleth was created by joining the supplied ISO-3 identifiers to a low-resolution Natural Earth country boundary layer. 166 polygons are directly colored in the current map. Small islands and separately reported territories may have valid statistical observations but no separate visible polygon at 1:110m scale. Gray therefore means missing data or no direct low-resolution polygon match; it does not automatically mean a 0% observation.
The map is most useful as a way to identify broad contrasts and neighboring differences that deserve further investigation. Explaining those differences requires generation-by-source data and, depending on the question, information on electricity demand, capacity, hydrology, wind and solar resources, nuclear generation, fossil-fuel supply, storage, and grid operation. This article does not assign causes beyond what the verified indicator itself can support.
Frequently Asked Questions
Does the renewable electricity share mean wind and solar only?
No. World Bank EG.ELC.RNEW.ZS includes renewable electricity from hydropower, wind, solar, biomass, geothermal, and ocean energy in the renewable numerator.
What was South Korea’s renewable electricity share in 2021?
South Korea records 6.6% in the supplied 2021 World Bank WDI series. Japan is 21.1% and China 28.4%.
Is renewable electricity share the same as renewable energy share in final consumption?
No. Renewable electricity share uses total electricity output as the denominator. Renewable energy in final consumption covers a broader set of end uses, including non-electric fuels and heat.
Is the 34.0% simple mean the global renewable electricity share?
No. 34.0% is an unweighted average across 204 country/economy observations. A global electricity share requires weighting by each economy’s total electricity output.
Related Articles
These Green Map articles help separate renewable electricity generation from other energy-access and renewable-energy concepts.
- Global Renewable Energy Share Map – 2021 Final Energy Consumption by Country
- Global Electricity Access Map – 2024 Country Comparison
- Global Clean Cooking Access Map – 2023 Country Comparison
Green Map creates custom-edited map images using open geographic data sources such as geoBoundaries, Natural Earth, OpenStreetMap, and government open data.
These maps are edited visual materials, not raw data files, and are provided for education, documents, presentations, and graphic reference.