The Global Agricultural Land Share Map compares how much of each country or economy’s land area is classified as agricultural in 2023. The underlying series is World Bank World Development Indicators AG.LND.AGRI.ZS. Regional and income-group aggregates are removed before the comparison, leaving a 217-row country/economy master set with 209 numeric observations and 8 missing values.
Across the 209 reported observations, the unweighted median is 38.0% and the simple mean is 37.16%. The first quartile is 17.9% and the third quartile is 54.0%. These descriptive statistics give every country or economy equal weight. They should not be read as the land-area-weighted agricultural share of the entire world.
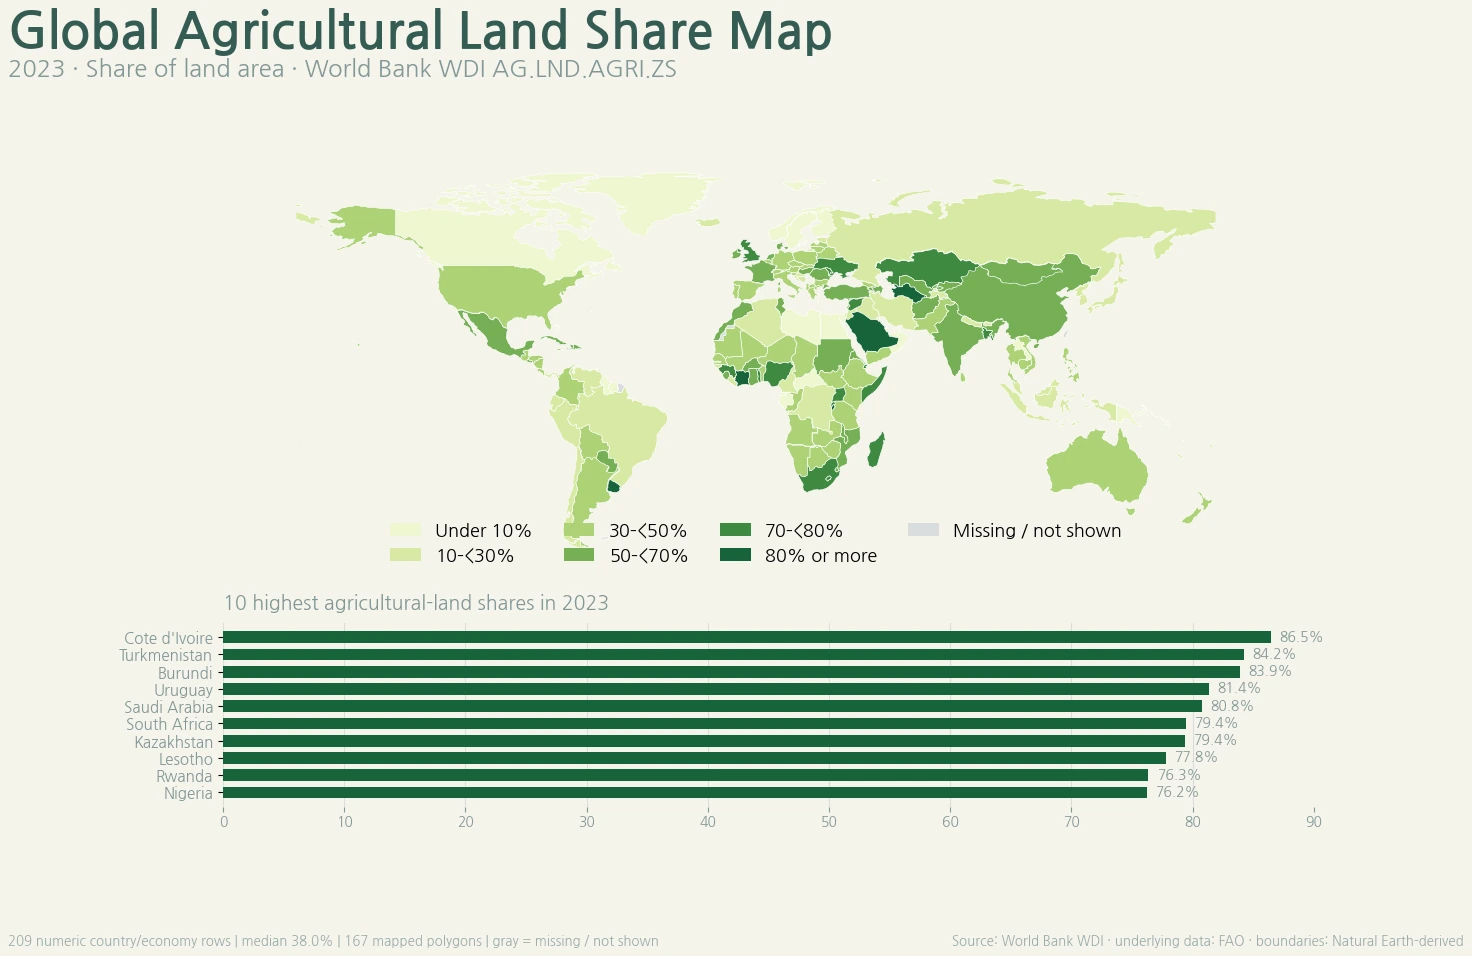
Table of Contents
Agricultural land is a broader category than arable land
The indicator’s formal name is Agricultural land (% of land area). Under the World Bank/FAO definition, agricultural land includes three components: arable land, land under permanent crops, and permanent pasture. That makes this series broader than the arable-land indicator. Temporary crops and temporary fallow are part of arable land; long-lived crops such as coffee, cocoa, fruit trees, nuts and vines are treated as permanent crops; land used for forage for five years or more falls within permanent pasture.
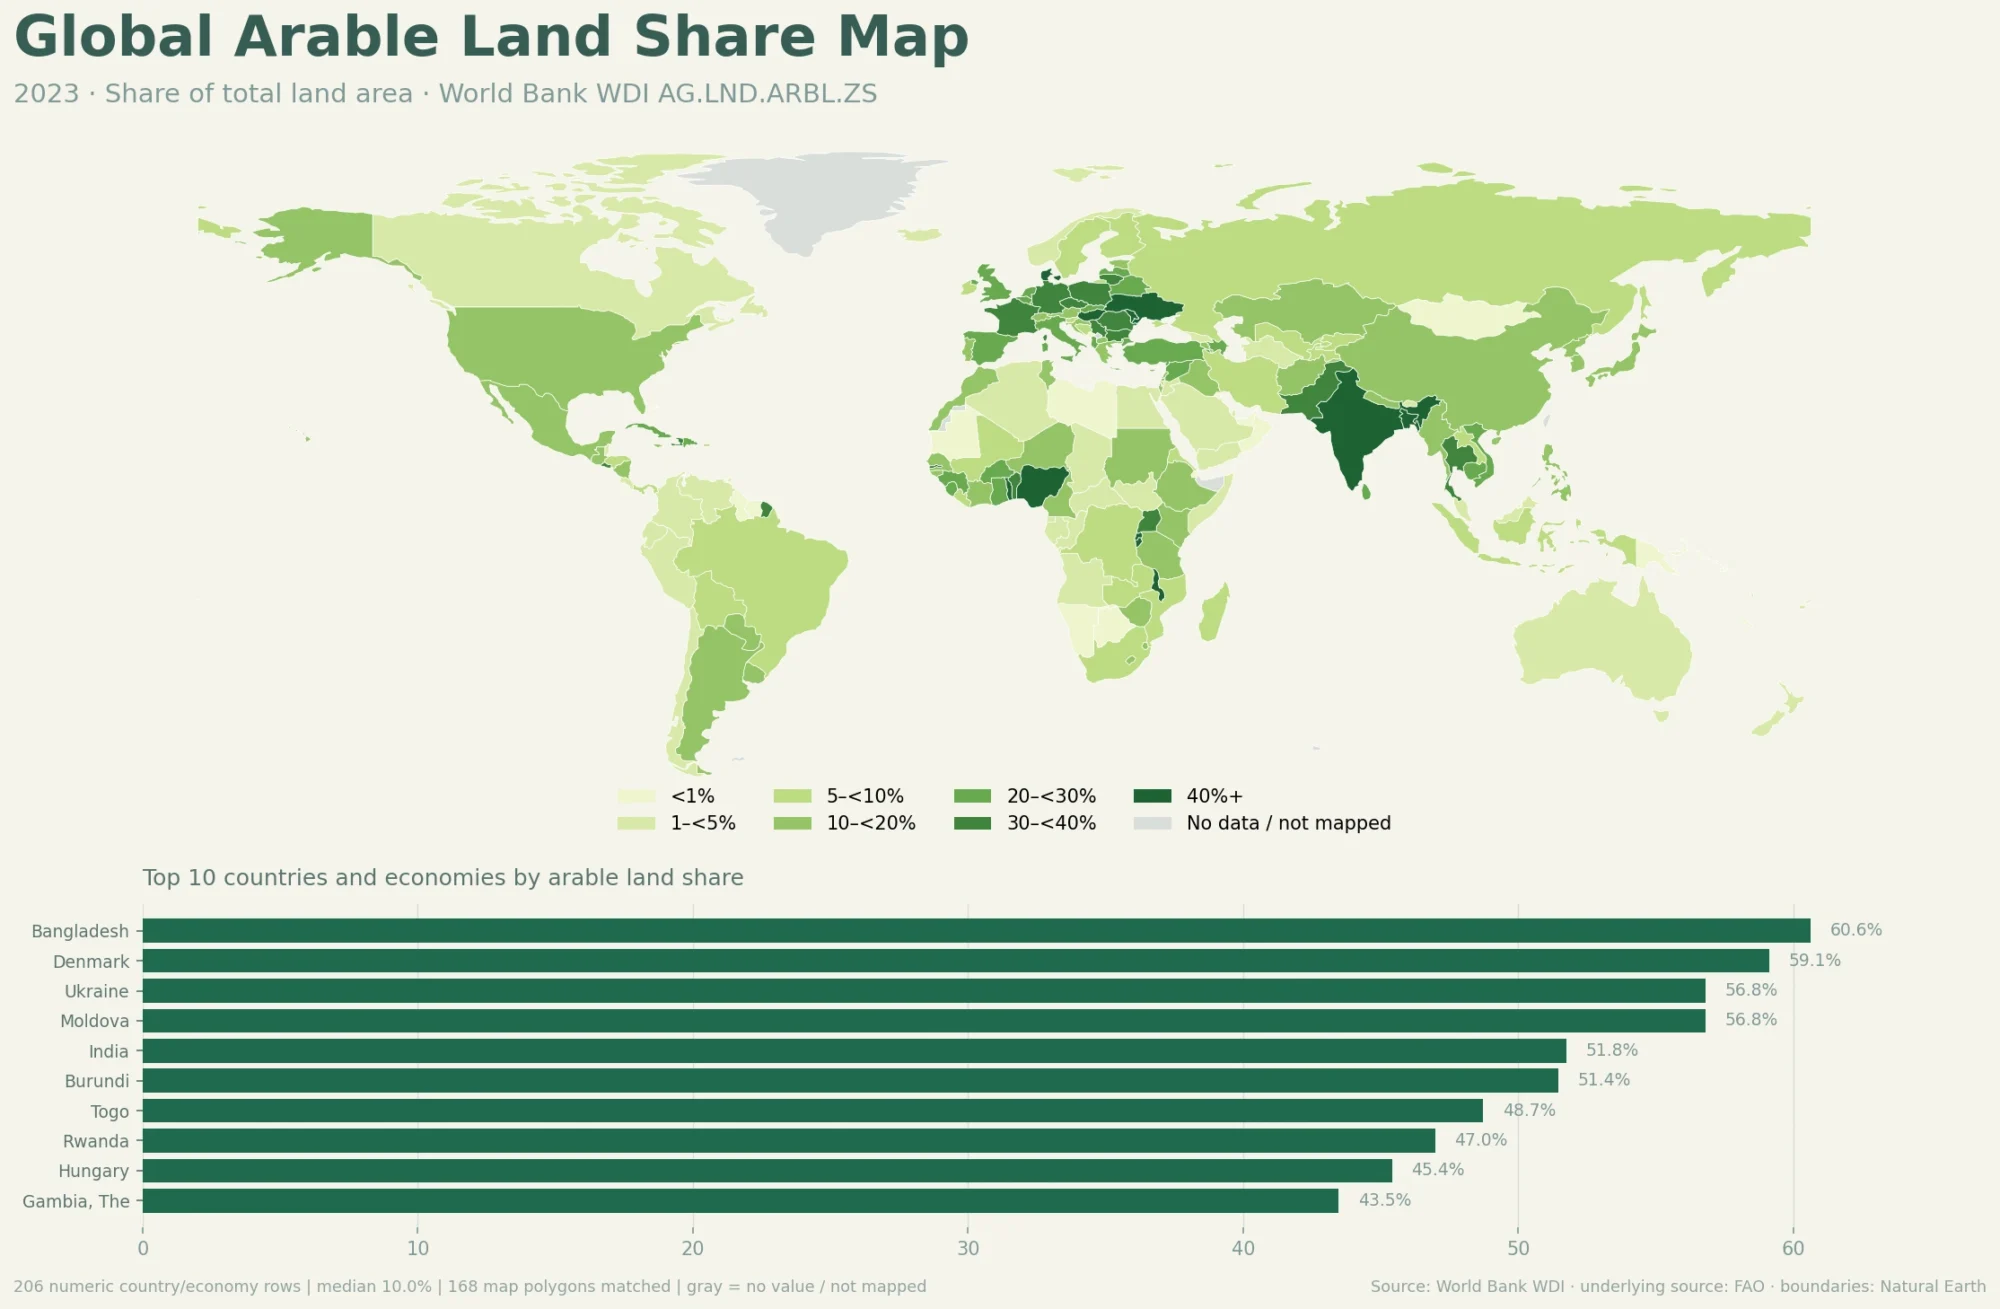
This distinction prevents a common reading error. A high agricultural-land percentage does not necessarily mean that most of the country is covered by annual crop fields. A large share can come from pasture, permanent crops, arable land, or a mixture of all three. AG.LND.AGRI.ZS does not separate those components, so a second indicator is needed if the question is specifically about arable land or cropland.
Most 2023 observations fall between 10% and 50%
The largest class in this same-year set is 30–<50%, containing 64 countries and economies. Another 53 fall in the 10–<30% range. At the high end, 60 observations are at 50% or above, including 23 at 70% or more. There are 32 observations below 10%.
| 2023 agricultural land share | Countries/economies | Share of 209 |
|---|---|---|
| Under 10% | 32 | 15.3% |
| 10–<30% | 53 | 25.4% |
| 30–<50% | 64 | 30.6% |
| 50–<70% | 37 | 17.7% |
| 70–<80% | 18 | 8.6% |
| 80% or more | 5 | 2.4% |
The class breaks are visual aids rather than agronomic thresholds. Two countries on opposite sides of the 30% boundary may have nearly identical values. The map is best used to locate broad differences in land composition; exact values are better for close comparisons.
Five observations are above 80%
Cote d’Ivoire has the highest 2023 observation in the supplied table at 86.5%. Turkmenistan follows at 84.2%, Burundi at 83.9%, Uruguay at 81.4%, and Saudi Arabia at 80.8%. South Africa and Kazakhstan are both around 79.4%, followed by Lesotho at 77.8%, Rwanda at 76.3%, and Nigeria at 76.2%.
| Country or economy | 2023 agricultural land share |
|---|---|
| Cote d’Ivoire | 86.5% |
| Turkmenistan | 84.2% |
| Burundi | 83.9% |
| Uruguay | 81.4% |
| Saudi Arabia | 80.8% |
| South Africa | 79.4% |
| Kazakhstan | 79.4% |
| Lesotho | 77.8% |
| Rwanda | 76.3% |
| Nigeria | 76.2% |
These percentages rank land composition, not agricultural output. A country with 80% agricultural land can be much smaller in absolute agricultural area than a very large country with a lower percentage. The statistic also says nothing directly about yields, farm income, irrigation, livestock productivity, or the share of workers employed in agriculture.
Large economies occupy very different parts of the distribution
The selected-economy comparison illustrates the spread. Saudi Arabia is at 80.8%, South Africa 79.4%, Nigeria 76.2%, and the United Kingdom 70.3%. India is at 60.1% and China 55.4%. France and Mexico are just above 50%, while Germany, Australia, the United States and Italy sit in the mid-40s. Brazil is at 28.3%, South Korea 16.1%, Russia 13.2%, Japan 12.6%, and Canada 6.5%.
| Selected country | 2023 agricultural land share |
|---|---|
| Saudi Arabia | 80.8% |
| South Africa | 79.4% |
| Nigeria | 76.2% |
| United Kingdom | 70.3% |
| India | 60.1% |
| China | 55.4% |
| France | 52.5% |
| Mexico | 50.7% |
| Germany | 47.5% |
| Australia | 47.2% |
| United States | 46.1% |
| Italy | 44.3% |
| Argentina | 42.4% |
| Indonesia | 29.1% |
| Brazil | 28.3% |
| Korea, Rep. | 16.1% |
| Russian Federation | 13.2% |
| Japan | 12.6% |
| Canada | 6.5% |
Agricultural-land share is therefore a poor one-number ranking of national farming performance. Countries differ in climate, landforms, forest extent, drylands, pasture systems, crop intensity and urban land. Similar percentages can represent very different combinations of arable land, permanent crops and pasture.
Land share should be separated from productivity and food output
This indicator answers a land-use question: what percentage of national land area is in the agricultural-land category? It does not answer how much food is harvested, how much agricultural value added is produced, or how productive each hectare is. Those outcomes depend on additional factors such as water availability, soils, crop choice, farm technology, input use, multiple cropping and livestock systems.
The reverse is equally important. A country with a small agricultural-land share can still have intensive or high-value production on the land it does use. For food-security or farm-efficiency questions, the land-share map should be combined with crop production, yields, irrigation, agricultural value added, or other directly relevant indicators rather than used as a substitute for them.
Very low shares occur in very different geographic settings
The lowest values also span very different types of economies. Suriname is at 0.4%, Greenland 0.6%, Singapore 0.9%, the Turks and Caicos Islands 1.1%, and the Northern Mariana Islands 1.2%. Brunei is at 2.5%, Norway 2.7%, Papua New Guinea 3.1%, Seychelles 3.4%, and Guyana 3.4%.
The dataset identifies the size of the agricultural category but does not prove the reason for a low value. Forest dominance, mountains, ice, aridity, urban land, island geography, and other factors can all matter in different places. Explaining a specific country requires additional geographic and land-cover evidence rather than an inference from this percentage alone.
Eight missing observations remain missing
The 2023 master set has no numeric value for the Channel Islands, Curacao, Gibraltar, Macao SAR China, St. Martin (French part), Monaco, Sint Maarten (Dutch part), or Kosovo. None of these rows is replaced with zero or filled from another year. A gray area on the map therefore means that the 2023 value is missing or that the economy is not represented by a directly matched low-resolution polygon.
The 217-row universe is also not a count of sovereign states. World Bank reporting includes separately listed territories and economies while this analysis removes regional and income-group aggregates. The statistical calculations use all 209 numeric rows; the map rendering uses the 167 country polygons that could be joined directly at this scale.
Source, definition, and calculation method
The statistical series is World Bank World Development Indicators AG.LND.AGRI.ZS. The underlying source is the Food and Agriculture Organization of the United Nations. The unit is percent of land area. The World Bank definition includes arable land, permanent crops, and permanent pasture, while total land area excludes major inland water bodies.
The WDI metadata glossary also notes that perfect comparability across countries and time is not possible and that some year-to-year variation can reflect revised or updated reporting. This article therefore fixes the comparison to one common year—2023—rather than mixing each economy’s latest available observation.
All rankings, class counts, quartiles, the simple mean, and the median were calculated directly from the 209 numeric 2023 observations in the verified dataset. Missing values were preserved, regional aggregates were excluded, and no interpolation or synthetic estimate was added.
Frequently Asked Questions
Is agricultural land the same as arable land?
No. Agricultural land is broader. It includes arable land, permanent crops, and permanent pasture. AG.LND.AGRI.ZS and AG.LND.ARBL.ZS therefore measure different land-use categories.
Does a high agricultural-land share mean a country produces more food?
No. The indicator measures the percentage of land classified as agricultural. Output and productivity depend on many other factors, including country size, water, climate, crops, technology, and farming intensity.
Does permanent pasture count as agricultural land?
Yes. The World Bank/FAO definition includes land used for forage for five years or more within the agricultural-land category.
Are gray areas on the map countries with 0% agricultural land?
No. Gray indicates a missing 2023 observation or a place that is not directly represented in the simplified world polygon layer. Missing values were not converted to zero.
Related Articles
These Green Map comparisons provide additional context for land composition and country-level change.
- Global Forest Area Share Map 2023 by Country
- Global Population Growth Map – 2025 Country Comparison
- Global GDP Growth Map – Country Patterns in 2025
Green Map creates custom-edited map images using open geographic data sources such as geoBoundaries, Natural Earth, OpenStreetMap, and government open data.
These maps are edited visual materials, not raw data files, and are provided for education, documents, presentations, and graphic reference.