Agriculture covers 69.40% of DeKalb County in the supplied 2025 data, yet the county does not appear as one uninterrupted field block. Developed land accounts for 13.75%, forest for 9.77%, and wetlands for 5.82%, producing repeated breaks in the agricultural background. This DeKalb County Indiana Land Cover Map page separates those current surface classes from impervious cover and from the 1985–2025 endpoint comparison, so each map answers a different question without treating all development or change as the same thing.
Four WebP previews are included in the article: current land cover, forest and farmland, impervious surface and developed land, and mapped class differences between 1985 and 2025. The matching original JPG files measure 2480 × 1754 pixels each and are packaged together in one ZIP below. They can be used for county profiles, classroom comparisons, presentation graphics, or a quick visual check of where agriculture, hard surfaces, woodland, wetlands, and water are concentrated.
Table of Contents
The 2025 surface is mostly agricultural, but the built pattern is divided among several centers
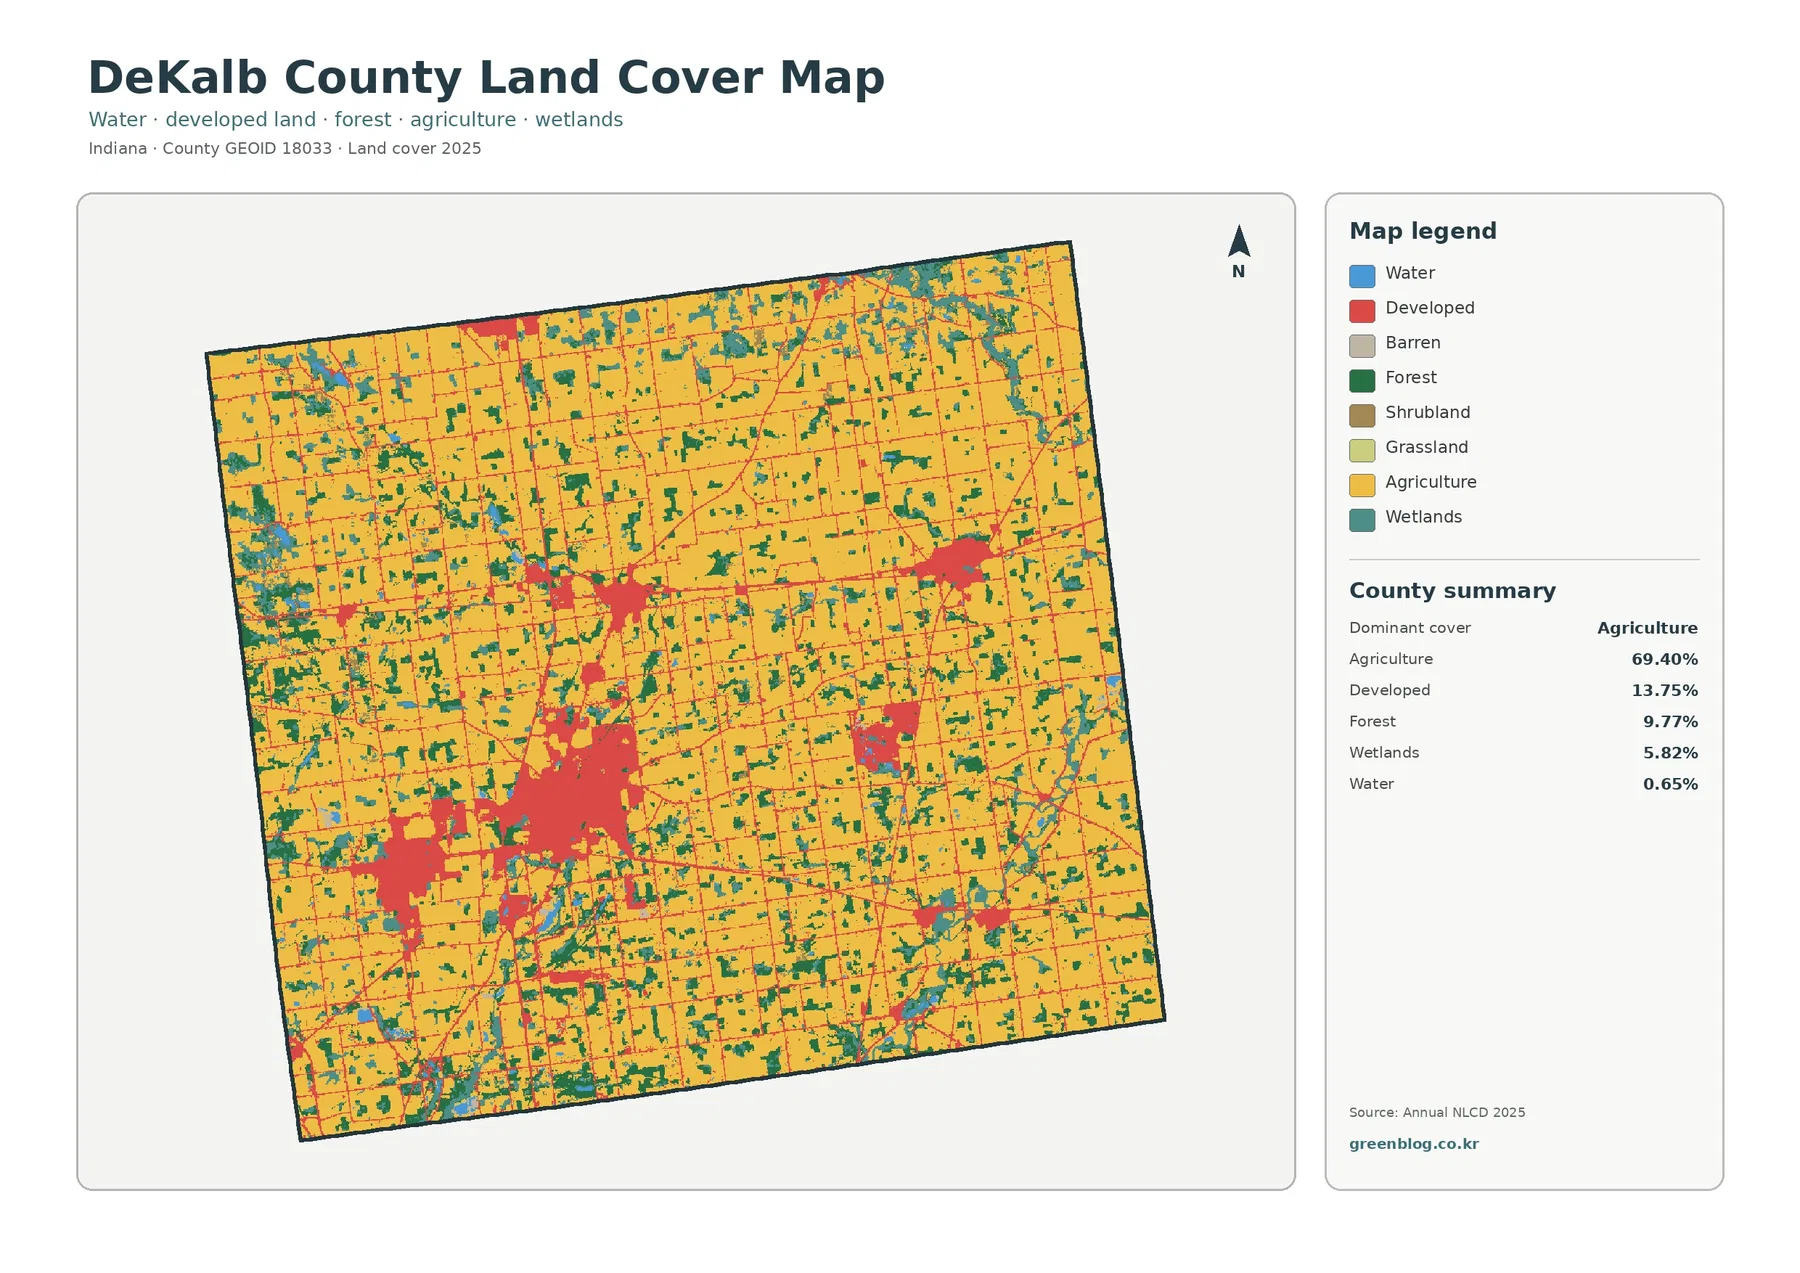
Yellow agricultural cover fills most of the map from north to south and remains the dominant background through the center and eastern half. The large blocks are repeatedly interrupted by narrow developed traces, dark green woodland, and teal wetland cells. The 69.40% agricultural share therefore describes the leading class well, but it does not mean that every rural section has the same mix of surfaces.
Developed cover is the second-largest class at 13.75%. The broadest red concentration lies in the southwestern part of the county and extends toward the interior, while additional developed centers appear farther north and east. Smaller red clusters also occur near the southern and northern edges. This scattered arrangement is important because a single countywide percentage cannot show whether built land is concentrated in one place or split among several distinct areas.
Wetlands account for 5.82%, a substantial share compared with open water at 0.65%. Teal wetland cells occur in winding and broken strips across the west, north, and parts of the east, whereas blue water is limited to smaller locations. A wetland cell should not be read as permanent open water. The classes describe different surface conditions, and the preview is not a regulatory wetland map or a named hydrography layer.
Impervious cover makes the contrast between rural blocks and built centers much sharper
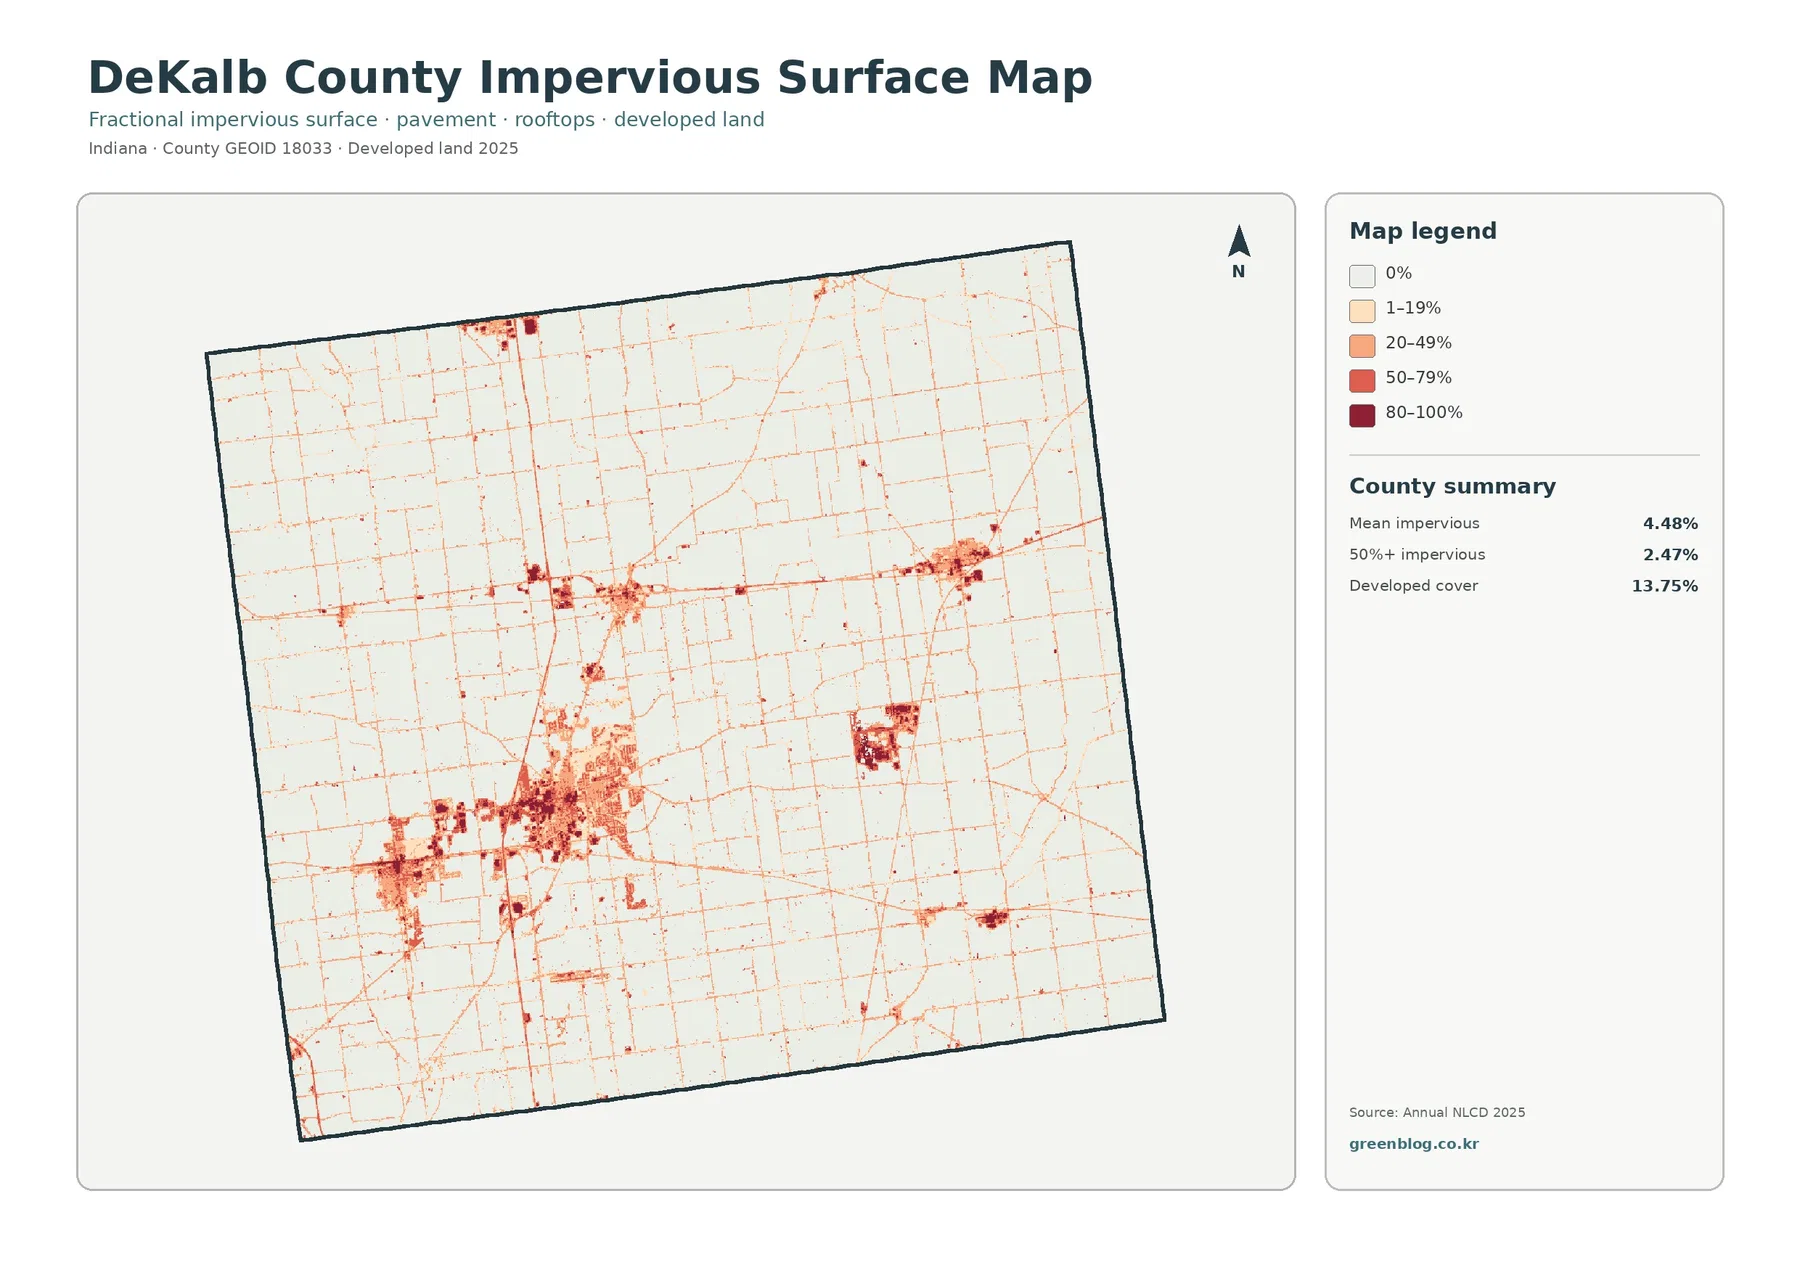
Mean impervious cover is 4.48%, and 2.47% of the county is mapped at 50% impervious or greater. Those figures are lower than the 13.75% developed share because developed classes can include lawns, trees, open soil, and other surfaces that still absorb water. Impervious cover isolates the harder portion of the developed landscape, including roofs, paved roads, parking areas, and similar materials.
The darkest values are concentrated in the large southwestern built area and continue into an interior cluster. Separate dark concentrations appear in the eastern half and in a smaller center farther north. Additional high-value patches occur near the edges. The image therefore reinforces the idea that DeKalb County contains several built centers rather than one continuous urban surface.
Wetland and water cells interrupt the farm grid without becoming a legal boundary map
The difference between 5.82% wetlands and 0.65% open water is one of the clearest reasons to keep the legend visible. Blue water appears in relatively few places, including locations in the western and southwestern portions of the map, while teal wetland cells are far more widespread. Some wetland strips sit beside forest, and others cut directly through agricultural areas.
Removing most developed color exposes the smaller woodland and wetland pieces between fields
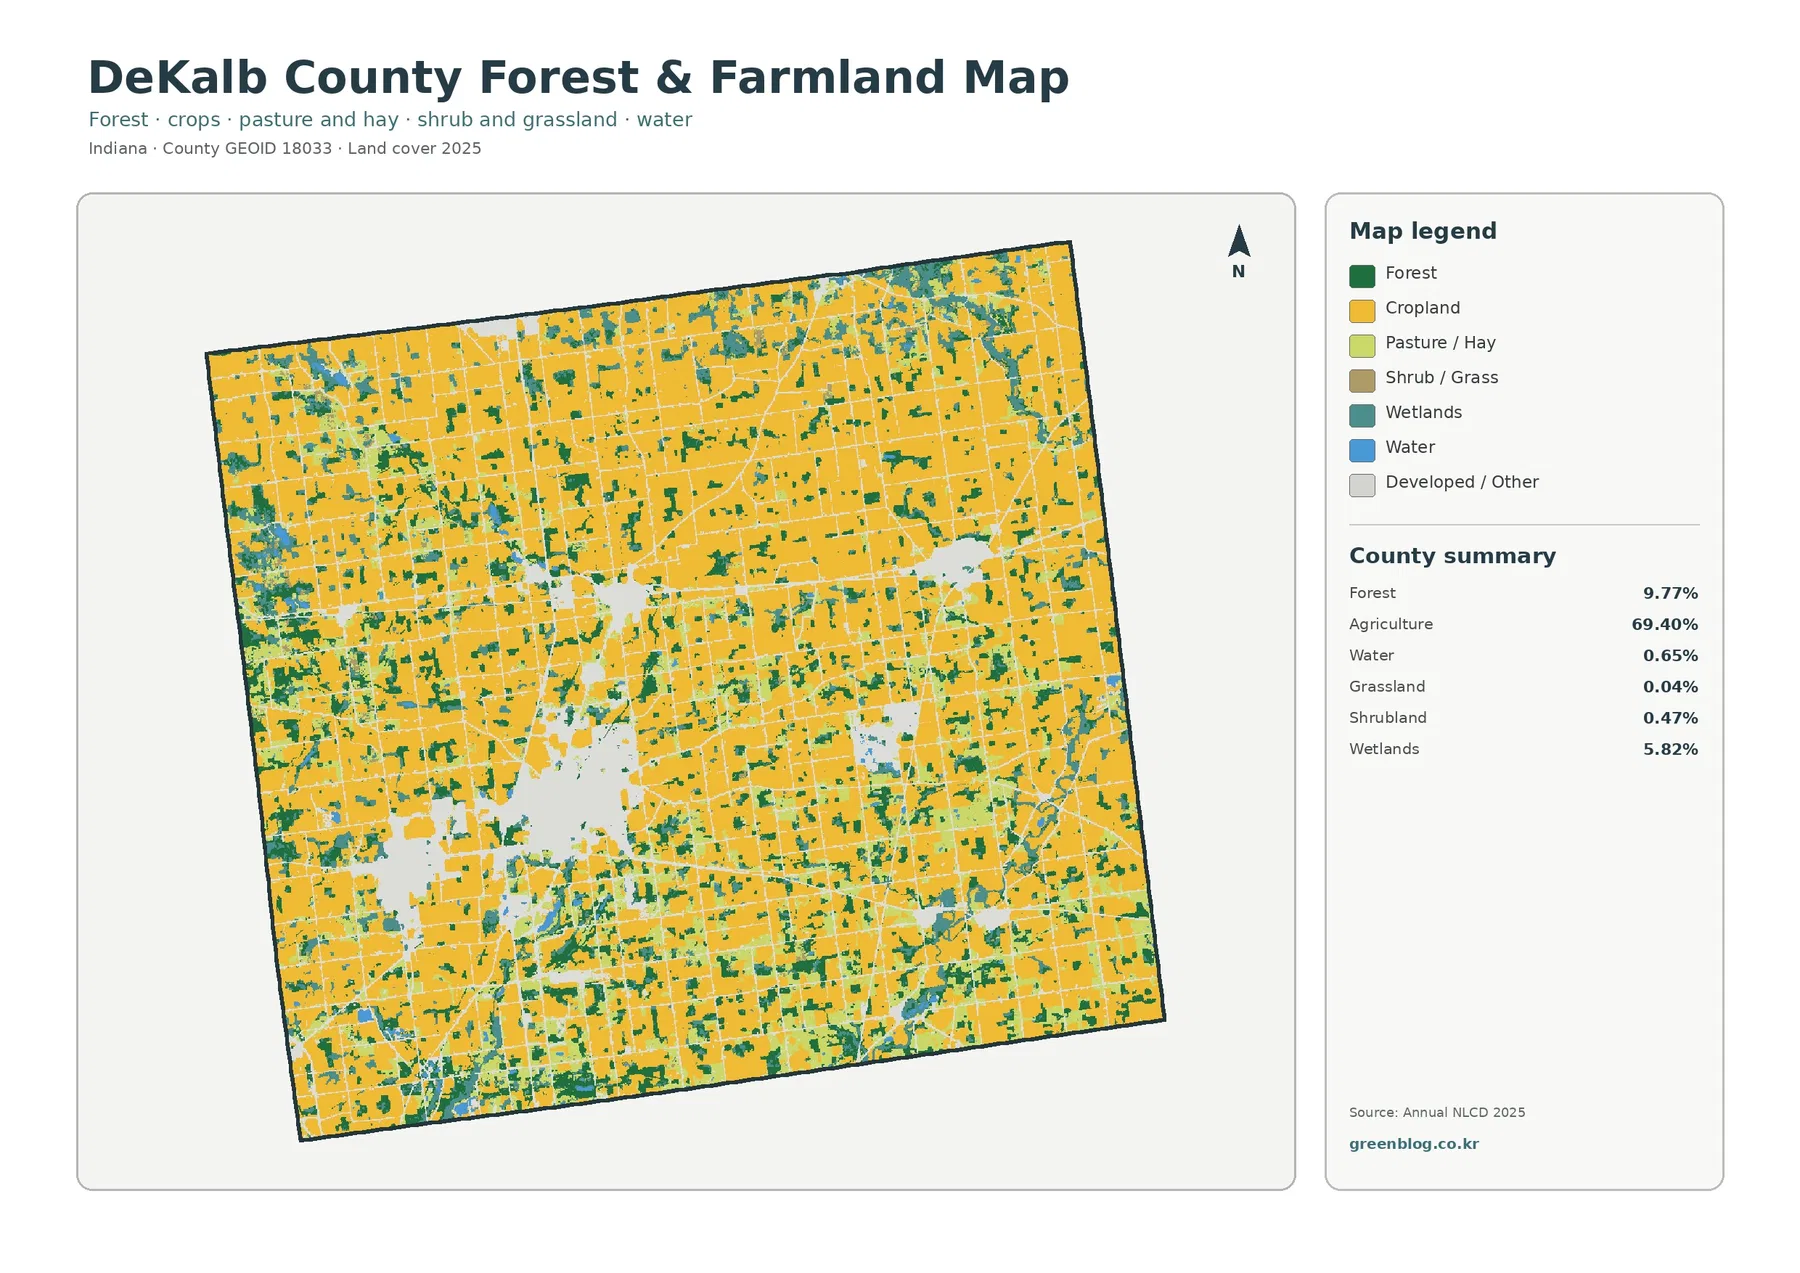
Once developed and miscellaneous surfaces are faded, the agricultural structure becomes easier to compare from one side of the county to the other. Cropland remains broad and continuous across much of the north, center, and east, but it is crossed by numerous dark green and teal pieces. The western half contains several of the more noticeable forest-wetland combinations, while the eastern half often presents larger uninterrupted agricultural blocks with smaller natural-cover interruptions.
Agricultural blocks may look like individual parcels because many edges are straight, but the source is raster land-cover classification rather than a survey. Annual NLCD uses roughly 30-meter cells, and each cell receives a predominant class even when several surfaces share the same square. A tree row, ditch, farm road, small pond, crop strip, and building can therefore be simplified into one class at this scale.
The 15.62% endpoint difference is dominated by the broad “other class difference” category
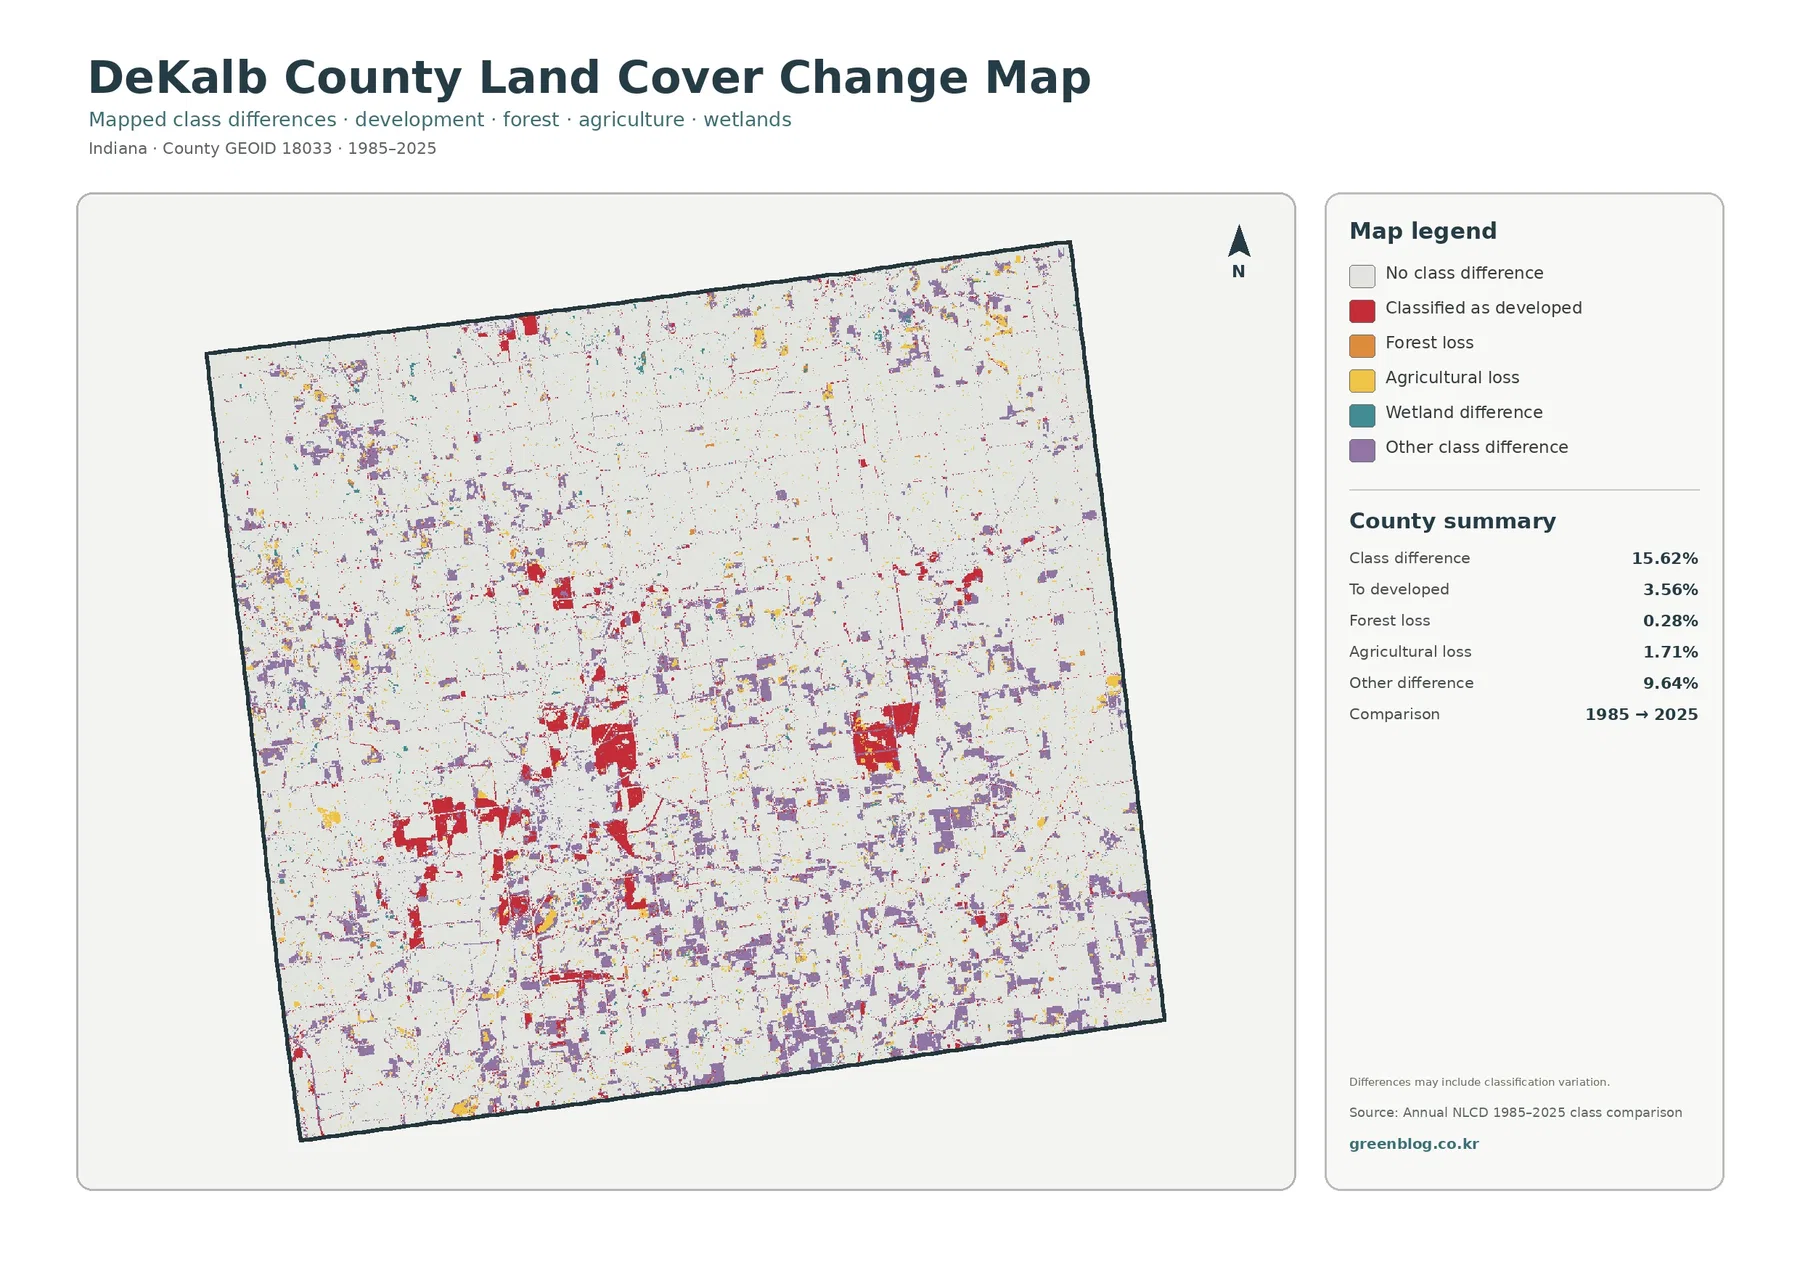
The supplied comparison reports 15.62% total class difference between 1985 and 2025. Listed components are 3.56% classified as developed, 0.28% forest loss, 1.71% agricultural loss, and 9.64% other difference. Wetland difference appears in the legend but has no separate percentage in the summary, so a residual calculation or visual estimate should not be presented as an official wetland-change value.
Red developed-conversion cells are concentrated around several of the current built centers, including the large southwestern area and separate interior and eastern clusters. Smaller red pieces appear elsewhere. These cells do not represent all developed land visible in 2025. They identify locations whose endpoint class changed to developed after a different 1985 class, while already-developed cells can remain in the no-difference background.
Purple other-class-difference cells are much more widely scattered and account for 9.64%, the largest listed component. They occur throughout the county, with many patches in the western and southern portions as well as smaller pieces elsewhere. Because this broad category is so large, the total 15.62% difference cannot be described simply as urban growth, forest clearing, or agricultural decline.
“Forest loss” and “agricultural loss” are endpoint classification terms here. A cell labeled forest in 1985 and another class in 2025 is counted as forest loss, but the map does not identify logging, construction, farming changes, storms, water conditions, or classification variation as the cause. The same limitation applies to agricultural loss. Intermediate-year imagery and local records are needed to establish timing and explanation.
Land cover is not zoning, ownership, a parcel survey, or permission to build
Land cover describes what the ground surface is classified as from imagery and related data. Zoning describes legal land-use rules, parcel maps describe property units, and transportation maps identify road networks. A yellow agricultural cell does not prove a farm boundary or agricultural zoning, and a red developed cell does not identify whether the site is residential, commercial, industrial, or another legal use.
The current land-cover images represent the supplied 2025 observation year. Construction, road work, harvest, vegetation recovery, drainage changes, or standing water after that observation may not appear. Agricultural and wetland surfaces can also vary seasonally, so the map should be treated as a dated countywide classification rather than a live site map.
Use the current map first, then add the specialized view that matches the question
For a county profile, start with the 2025 land-cover overview because it shows the 69.40% agricultural background together with developed centers, woodland, wetlands, and water. If the topic is farmland beside natural cover, pair it with the forest-and-farmland view so the red developed areas do not dominate the comparison.
Each original JPG measures 2480 × 1754 pixels. The files are suitable for on-screen viewing, document placement, presentations, and general printing. The supplied package does not mark them as meeting an A3 high-resolution reference, so a test print is sensible before producing a large poster that depends on small legend text or fine cell detail.
Frequently Asked Questions
Does 69.40% agriculture mean nearly every part of DeKalb County looks the same?
No. Agriculture is the largest class, but 13.75% developed land, 9.77% forest, and 5.82% wetlands repeatedly divide the farm grid. Several built centers and many natural-cover strips create clear local differences that a single countywide percentage cannot show.
Why is developed cover 13.75% when mean impervious cover is only 4.48%?
Developed classes can include lawns, trees, open soil, and other permeable surfaces around buildings and roads. Impervious cover focuses on roofs, pavement, parking areas, and similar hard materials, so its countywide mean is lower than the total developed share.
Does the 15.62% class difference equal the amount of land that was developed or damaged after 1985?
No. It is the share of cells with a different endpoint class in 1985 and 2025. Other class difference is the largest listed component at 9.64%, while developed conversion, forest loss, and agricultural loss are separate categories. Intermediate imagery and local records are needed to determine the timing and cause of an actual change.
Sources and Reference Data
- MRLC Annual NLCD Data – official access point for current annual land-cover and comparison products
- USGS Annual NLCD Land Cover Classification – definitions and guidance for agriculture, forest, developed land, wetlands, water, and related classes
- U.S. Census Bureau TIGER/Line Shapefiles – official county-boundary reference for DeKalb County
Map File Information
The ZIP contains four original JPG maps for comparing DeKalb County's 2025 land cover, farmland and forest, impervious surfaces, and 1985–2025 class differences.
- Included Files: Use only the versions confirmed in the article and supplied images
- File Type: Use the confirmed download contents
- Intended Use: Printing, education, presentations, and map-based projects
Related Maps
- Adams County Indiana Land Cover Map
- Allen County Indiana Land Cover Map
- Bartholomew County Indiana Land Cover Map
Green Map creates custom-edited map images using open geographic data sources such as geoBoundaries, Natural Earth, OpenStreetMap, and government open data.
These maps are edited visual materials, not raw data files, and are provided for education, documents, presentations, and graphic reference.