Hardin County, Illinois stands out for a forest share that covers nearly two-thirds of the 2025 map. Forest accounts for 64.30% of the county summary, while agriculture makes up 24.73%. Developed land is 5.42%, wetlands 2.11%, and water 2.10%. The general map shows broad wooded areas across much of the county, farm openings in several directions, and a conspicuous water band along the eastern boundary.
The page provides four views of the same county: current land cover, forest and farmland, impervious surface with developed land, and class differences between 1985 and 2025. The four original JPG maps are available together in one ZIP download. Comparing them side by side is more useful than treating one view as a complete description of land use or property conditions.
Table of Contents
The eastern water edge is the quickest landmark for orienting the county
Before comparing forest and farmland, it helps to use the eastern boundary as a visual reference. A broad blue water area follows much of that side of the county and forms a strong contrast with the surrounding green forest. Smaller blue patches also occur farther inland, but they are much less prominent. Wetlands appear separately in teal, so the map distinguishes standing or open water from surfaces classified as wetland.
Along portions of the east, forest extends close to the water edge. Small agricultural areas and wetland patches interrupt that wooded margin in places. In the south-central part of the county, water and wetland colors also appear near developed and agricultural cover. Those relationships are useful for reading the landscape, but the map does not identify flood zones, water quality, wetland jurisdiction, or legal shoreline boundaries.
Forest covers 64.30%, but agricultural openings keep the landscape from looking uniform
The 2025 land-cover map is dominated by green. Large forest blocks span the center, north, and much of the east, creating one of the clearest forest-heavy patterns among the Illinois county maps in this set. Yellow agricultural cover is still substantial at 24.73%, but it appears as openings and broader patches within or beside the wooded areas rather than as one continuous countywide field pattern.
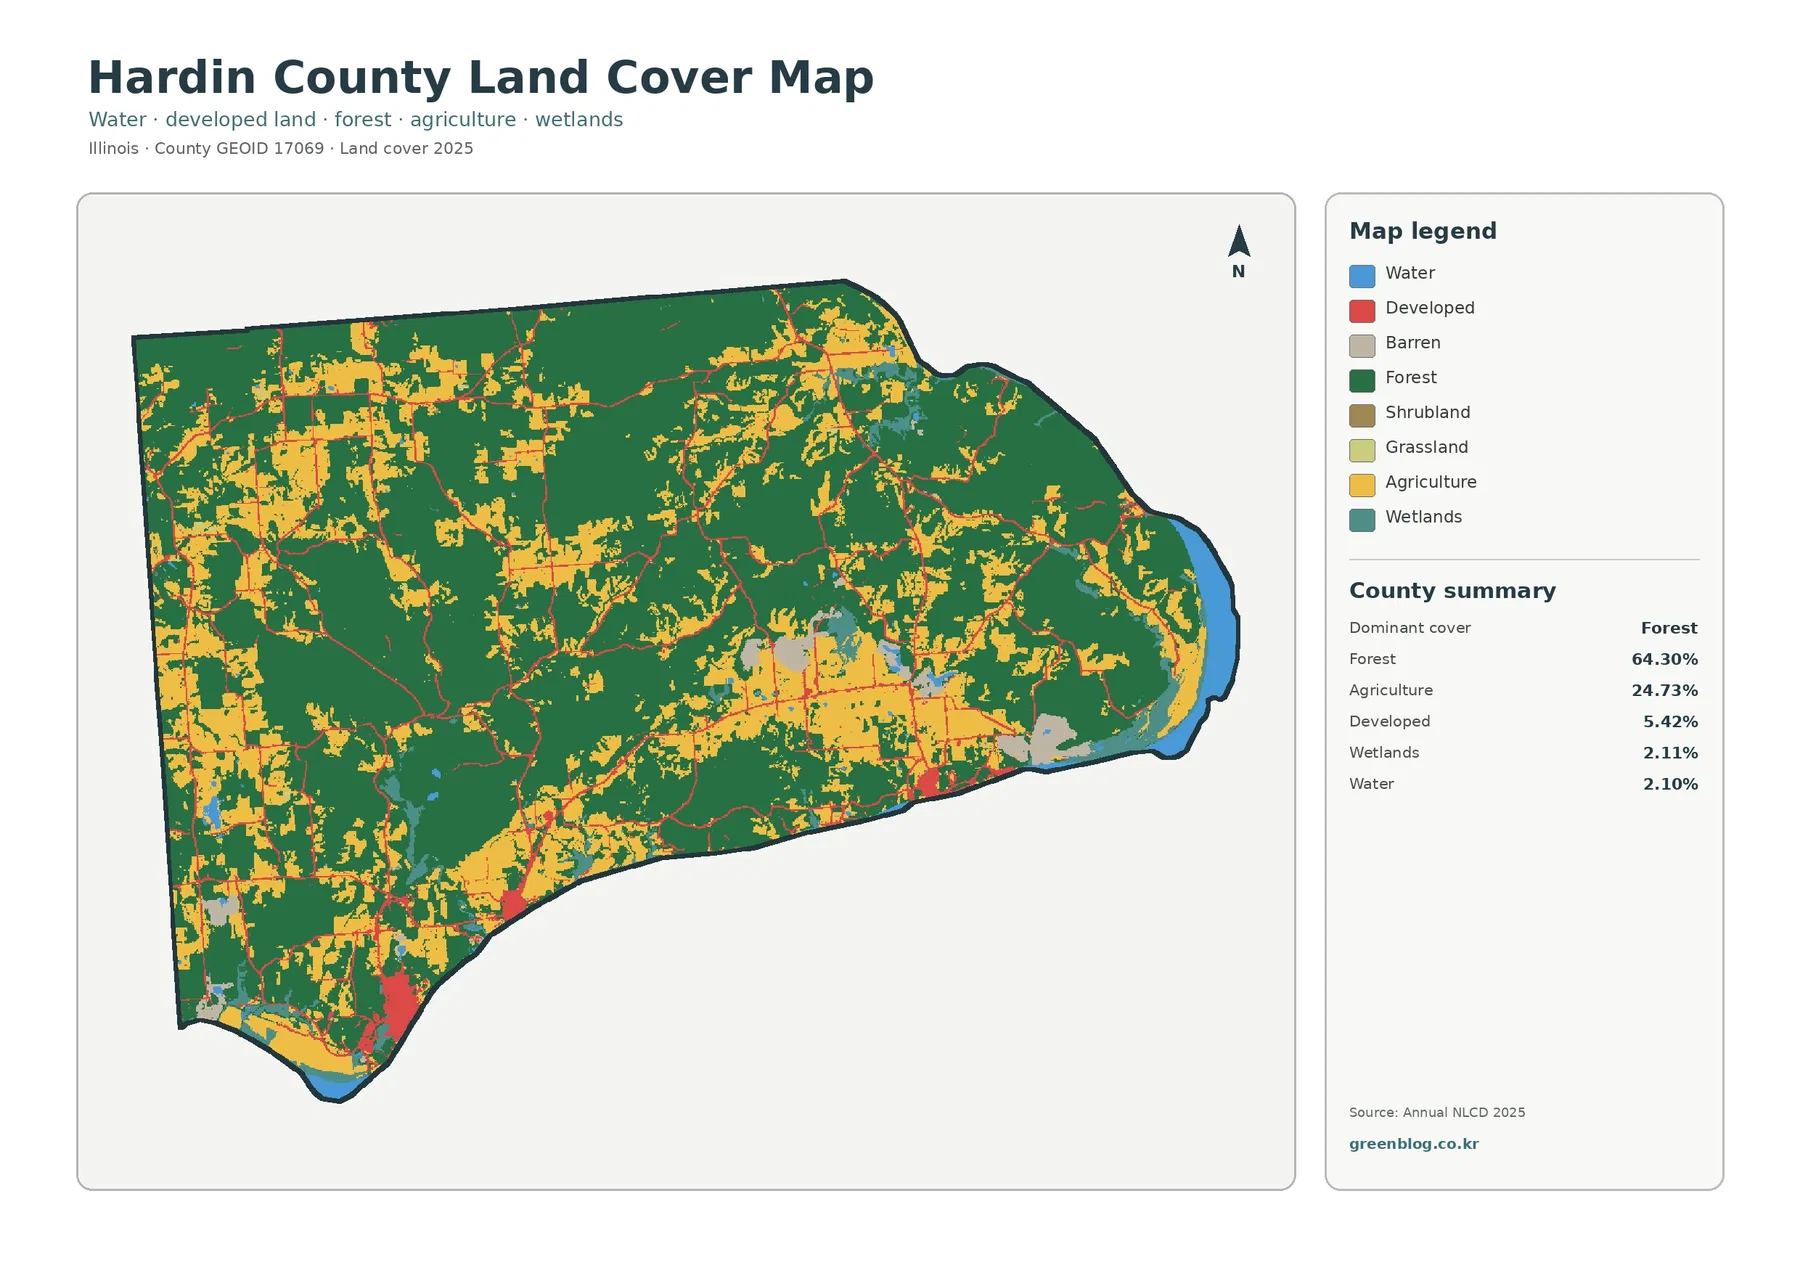
The western side contains several larger agricultural blocks, while farm cover also appears through the south and in parts of the east-central area. Developed land threads through some of these openings as narrow road-shaped lines and small clusters. The strongest developed concentrations are limited in size, so they do not break the broad forest pattern across most of the county.
The forest-and-farmland map reveals where the 24.73% agricultural share is concentrated
Removing much of the developed detail makes the field-and-forest pattern easier to follow. Forest remains broad across the central and northeastern portions of Hardin County. Agricultural cover becomes more noticeable in the west, along parts of the southern side, and in several openings east of center. Rather than dividing the county into a simple forest half and farm half, the map shows agriculture inserted into a much larger wooded framework.
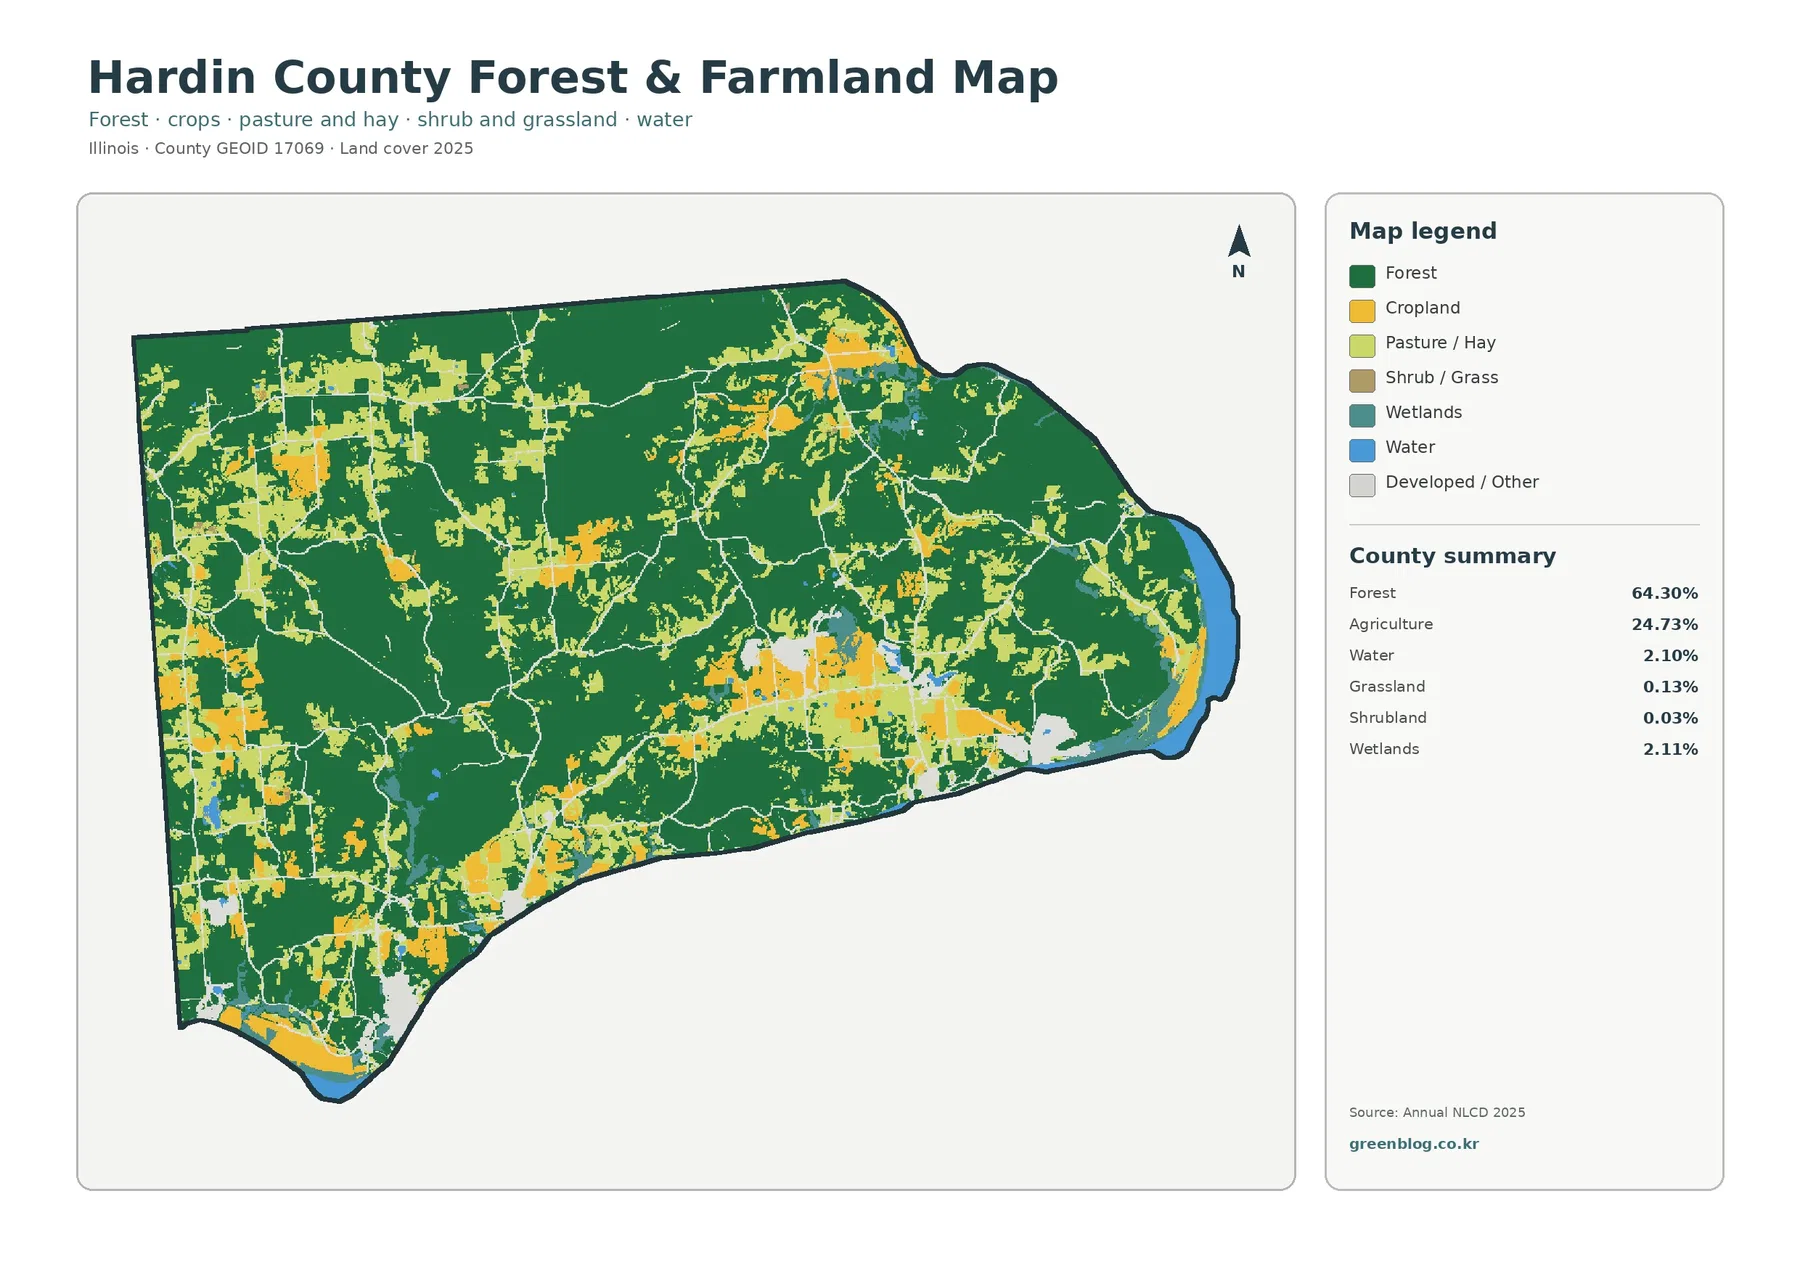
Some agricultural areas form larger, more regular blocks on the western side. Elsewhere, fields are narrower or irregular because they sit between wooded patches. This difference matters when the map is used for a presentation or a county-scale comparison. A single percentage cannot show whether agriculture forms one continuous belt or many separated openings, while the simplified map makes that distinction immediate.
Hard surfaces are sparse countywide and cluster mainly in the southwest and along a few roads
Impervious surface is the share of an area covered by hard materials such as pavement and rooftops that do not readily absorb water. Hardin County has a mean impervious value of 0.85%, and only 0.25% of the mapped area is at least 50% impervious. Those low figures match the visual impression of a county where most of the surface is forest or agriculture rather than dense built cover.
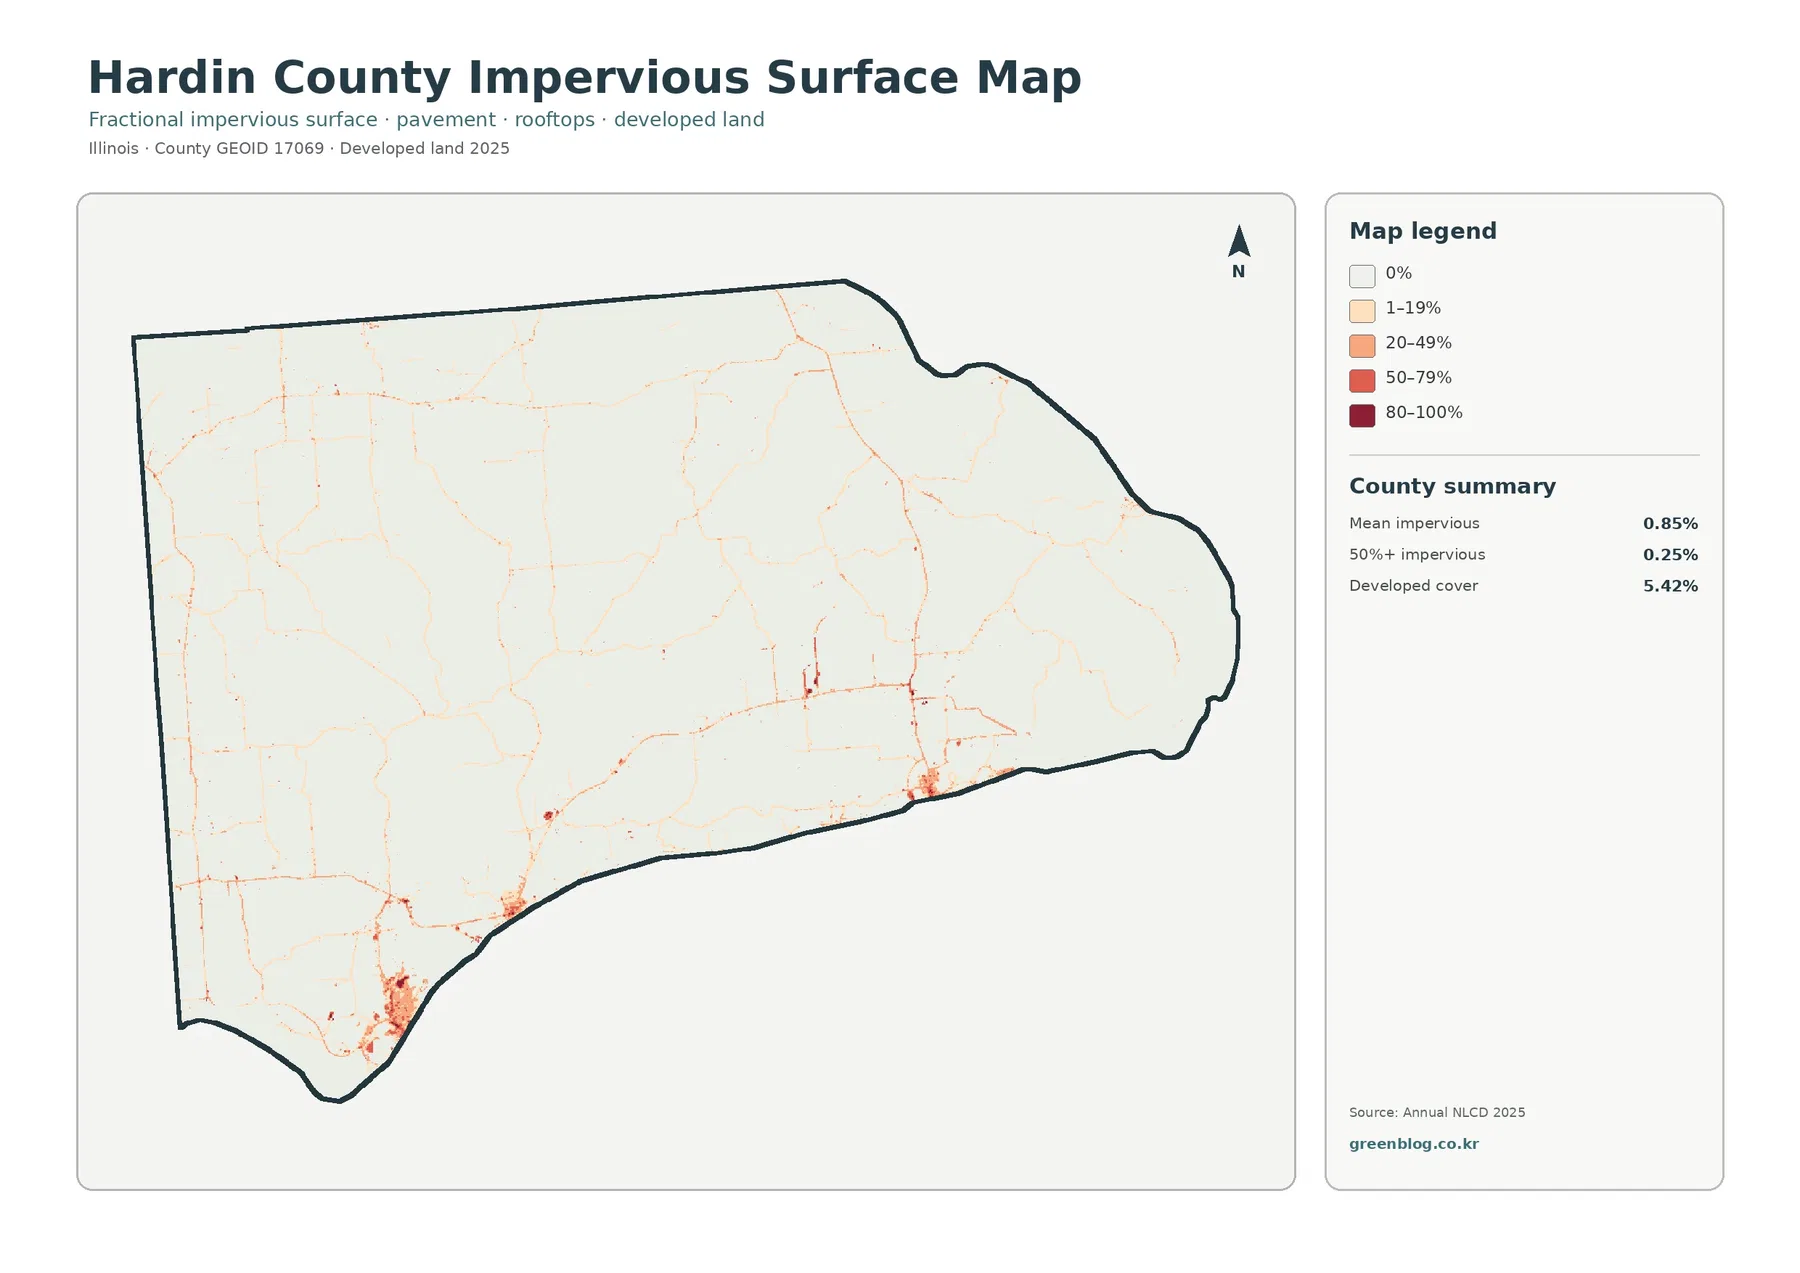
The darkest cluster lies near the southwestern tip. Smaller concentrations appear along the southern half and in the east-central area, connected in places by thin road-like lines. Much of the center and north remains nearly white on the impervious map. That pattern helps explain why developed land can total 5.42% while the mean impervious percentage stays below one percent.
Developed land and impervious cover are related but not identical. A developed land-cover class can include lawns, trees, bare soil, and other permeable surfaces around buildings or roads. Impervious cover measures only the harder surface fraction. Reading both maps together avoids the common mistake of treating the 5.42% developed share as if it were the same thing as the amount of pavement and rooftops.
The 1985–2025 comparison totals 9.13%, with “other” class difference making up the largest share
The change map does not measure one single type of land conversion. It marks cells whose classifications differ between 1985 and 2025. Hardin County has an overall class-difference value of 9.13%. The summary breaks that total into 0.75% classified to developed, 1.42% forest loss, 1.31% agricultural loss, and 5.47% other class difference.
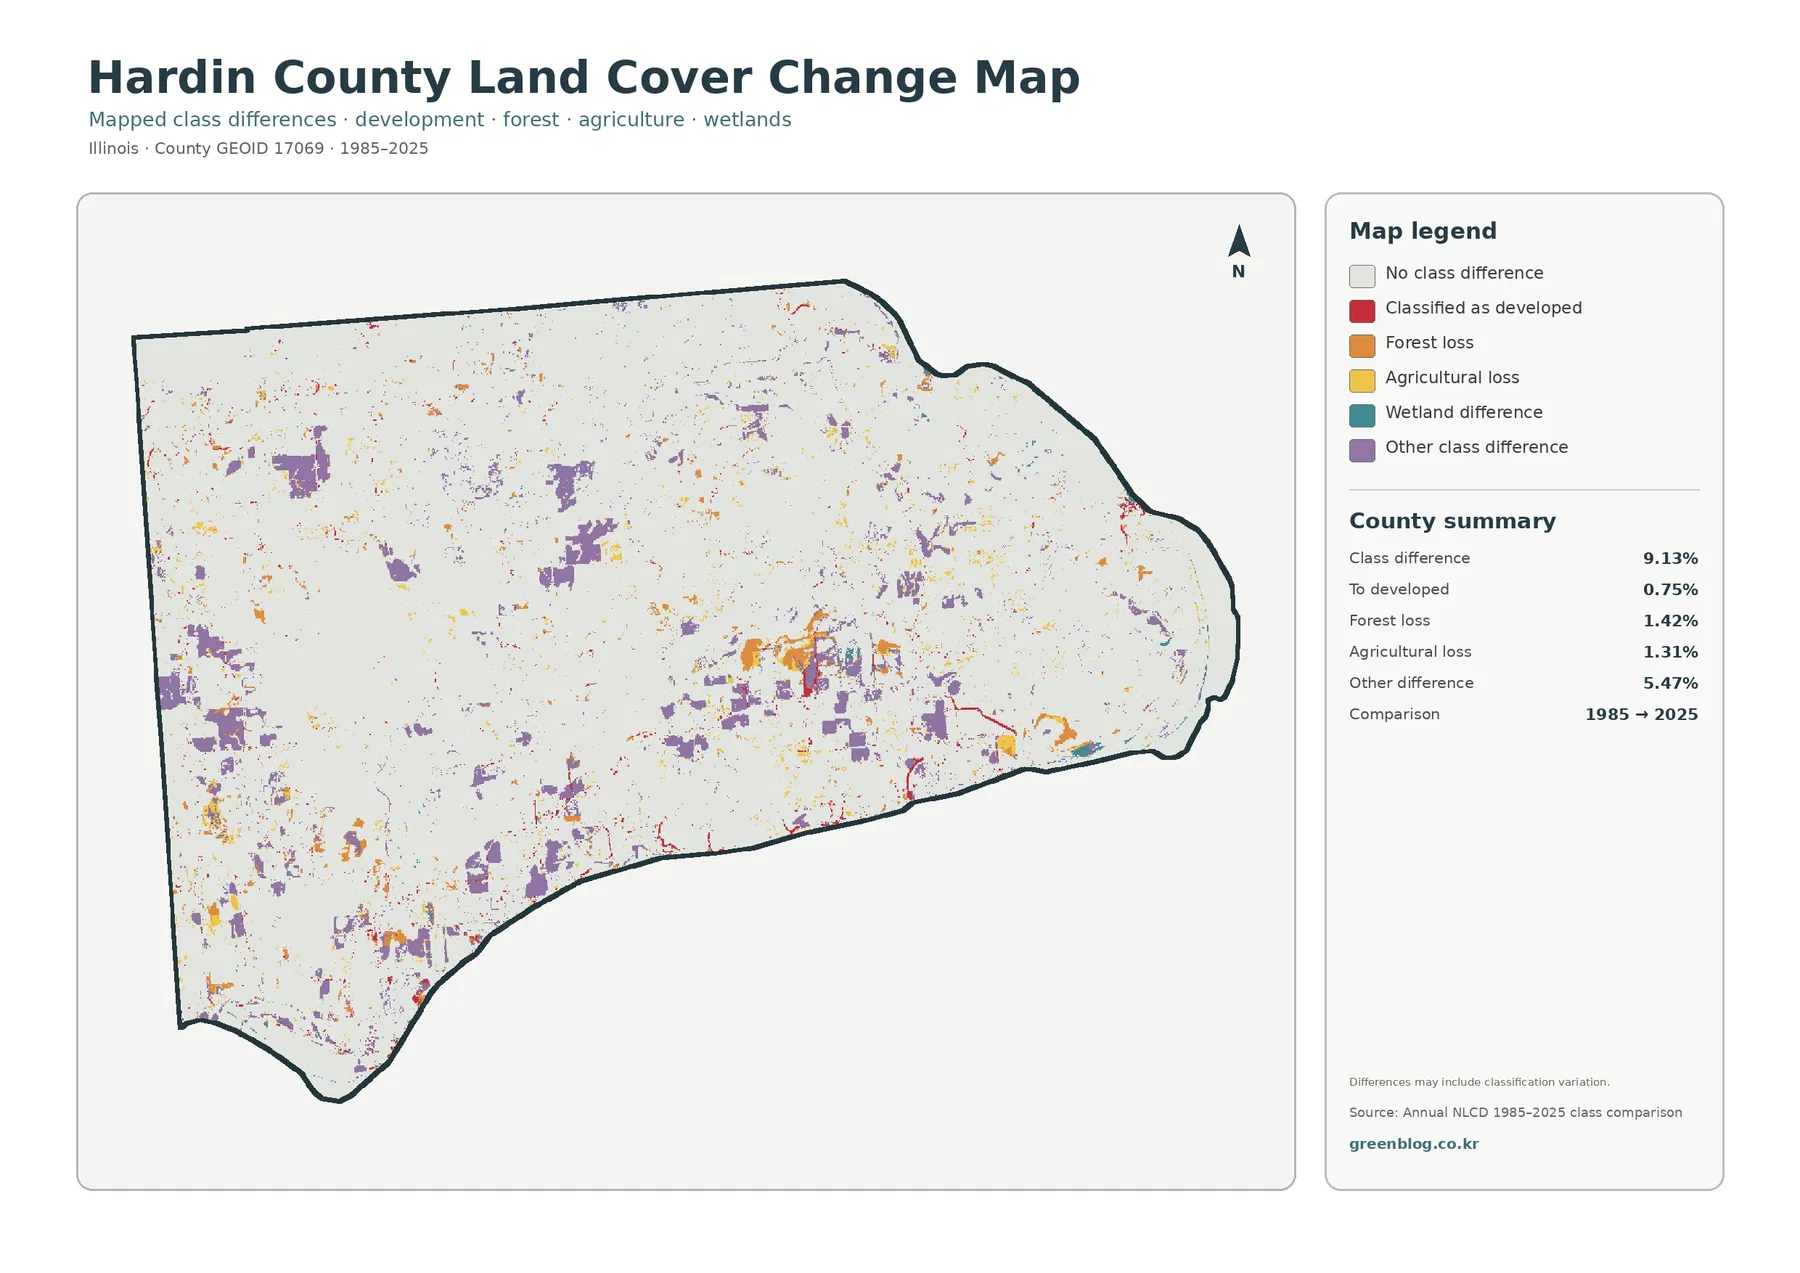
Purple other-difference patches are spread across the west, center, and southwest, with several visible clusters. Orange forest-loss and yellow agricultural-loss cells are smaller and more scattered. Red developed differences are easiest to see near some southern built areas and road connections. The eastern side also contains a mix of small differences near water and wetland cover.
Because the 5.47% other category is the largest component, the 9.13% countywide value should not be summarized as “development” or “forest decline.” Some differences may reflect real surface change, but imagery, vegetation condition, moisture, classification rules, and mixed pixels can also alter how a cell is labeled. The map itself notes that classification variation may be included.
Four map views work best when each is used for a separate question
The general land-cover map is the most useful overview because it places forest, agriculture, developed land, wetlands, and water in one frame. For Hardin County, it quickly establishes the forest-dominant character and the distinctive eastern water boundary. The forest-and-farmland map then simplifies the comparison so the western and southern agricultural openings stand out more clearly.
Raster cells generalize narrow roads, small wetlands, and irregular forest edges
Annual NLCD products are commonly mapped with roughly 30-meter raster cells. A raster divides the ground into a grid and assigns each cell a representative class or value. If one cell contains forest beside a field, a road beside grass, or wetland beside open water, the mapped result simplifies that mixed ground into one label or one impervious percentage.
This matters in Hardin County because many agricultural openings have irregular forest boundaries, roads are narrow compared with the overall county map, and small water or wetland patches occur inside much larger forested areas. The map can make those edges look blockier than they are on the ground. It is a county-scale land-cover reference, not a parcel survey.
Frequently Asked Questions
What is the largest 2025 land-cover class in Hardin County?
Forest is the largest class at 64.30%. Agriculture follows at 24.73%, developed land at 5.42%, wetlands at 2.11%, and water at 2.10%. The broadest forest cover spans much of the center, north, and east.
Why does the eastern side look so different from the rest of the county?
A large water feature follows much of the eastern boundary, creating a strong blue edge beside mostly forested land. Water accounts for 2.10% of the county summary, while wetlands are a separate 2.11% class.
Does the 9.13% 1985–2025 class difference equal confirmed physical land conversion?
Not necessarily. Real surface change may be included, but imagery, vegetation or moisture conditions, classification rules, and mixed pixels can also affect labels. Other class difference is the largest component at 5.47%.
Map File Information
The download combines four original JPG maps for Hardin County: 2025 land cover, forest and farmland, impervious/developed land, and the 1985–2025 land-cover class comparison.
- Included Versions: Land Cover Map, Forest & Farmland Map, Impervious/Developed Land Map, and 1985–2025 Land Cover Change Map
- File Type: One ZIP containing four JPG files
- Intended Use: forest and farm comparison, water and wetland reference, built-surface review, class-change comparison, teaching, and presentations
Related Maps
- Adams County Illinois Land Cover Map
- Alexander County Illinois Land Cover Map
- Bond County Illinois Land Cover Map
Sources and references
- MRLC Annual NLCD Data – official access point for Annual NLCD land-cover and impervious-surface products.
- USGS Annual NLCD Land Cover Classification – official documentation for land-cover classes and raster interpretation.
- U.S. Census Bureau TIGER/Line Shapefiles – official geographic boundary source used to identify Hardin County.
Green Map creates custom-edited map images using open geographic data sources such as geoBoundaries, Natural Earth, OpenStreetMap, and government open data.
These maps are edited visual materials, not raw data files, and are provided for education, documents, presentations, and graphic reference.