Forest covers most of Upson County in the supplied 2025 data, but the county does not read as one continuous green block. The strongest break occurs near the middle, where developed cover and open land gather around the Thomaston area. The Upson County Georgia Land Cover Map summary lists 61.78% forest, 14.44% agriculture, 8.66% developed land, 4.99% grassland, 4.67% shrubland, 4.41% wetlands, and 1.01% water.
This page compares four related views rather than treating one image as the whole story. The WebP maps show current land cover, forest and farmland, impervious surfaces, and 1985–2025 class differences. The four original 2480 × 1754 JPG files are available together in one ZIP near the end of the article, so a reader can choose the version that best fits a report, lesson, county profile, or presentation.
Table of Contents
A forest majority surrounds a much busier middle of the county
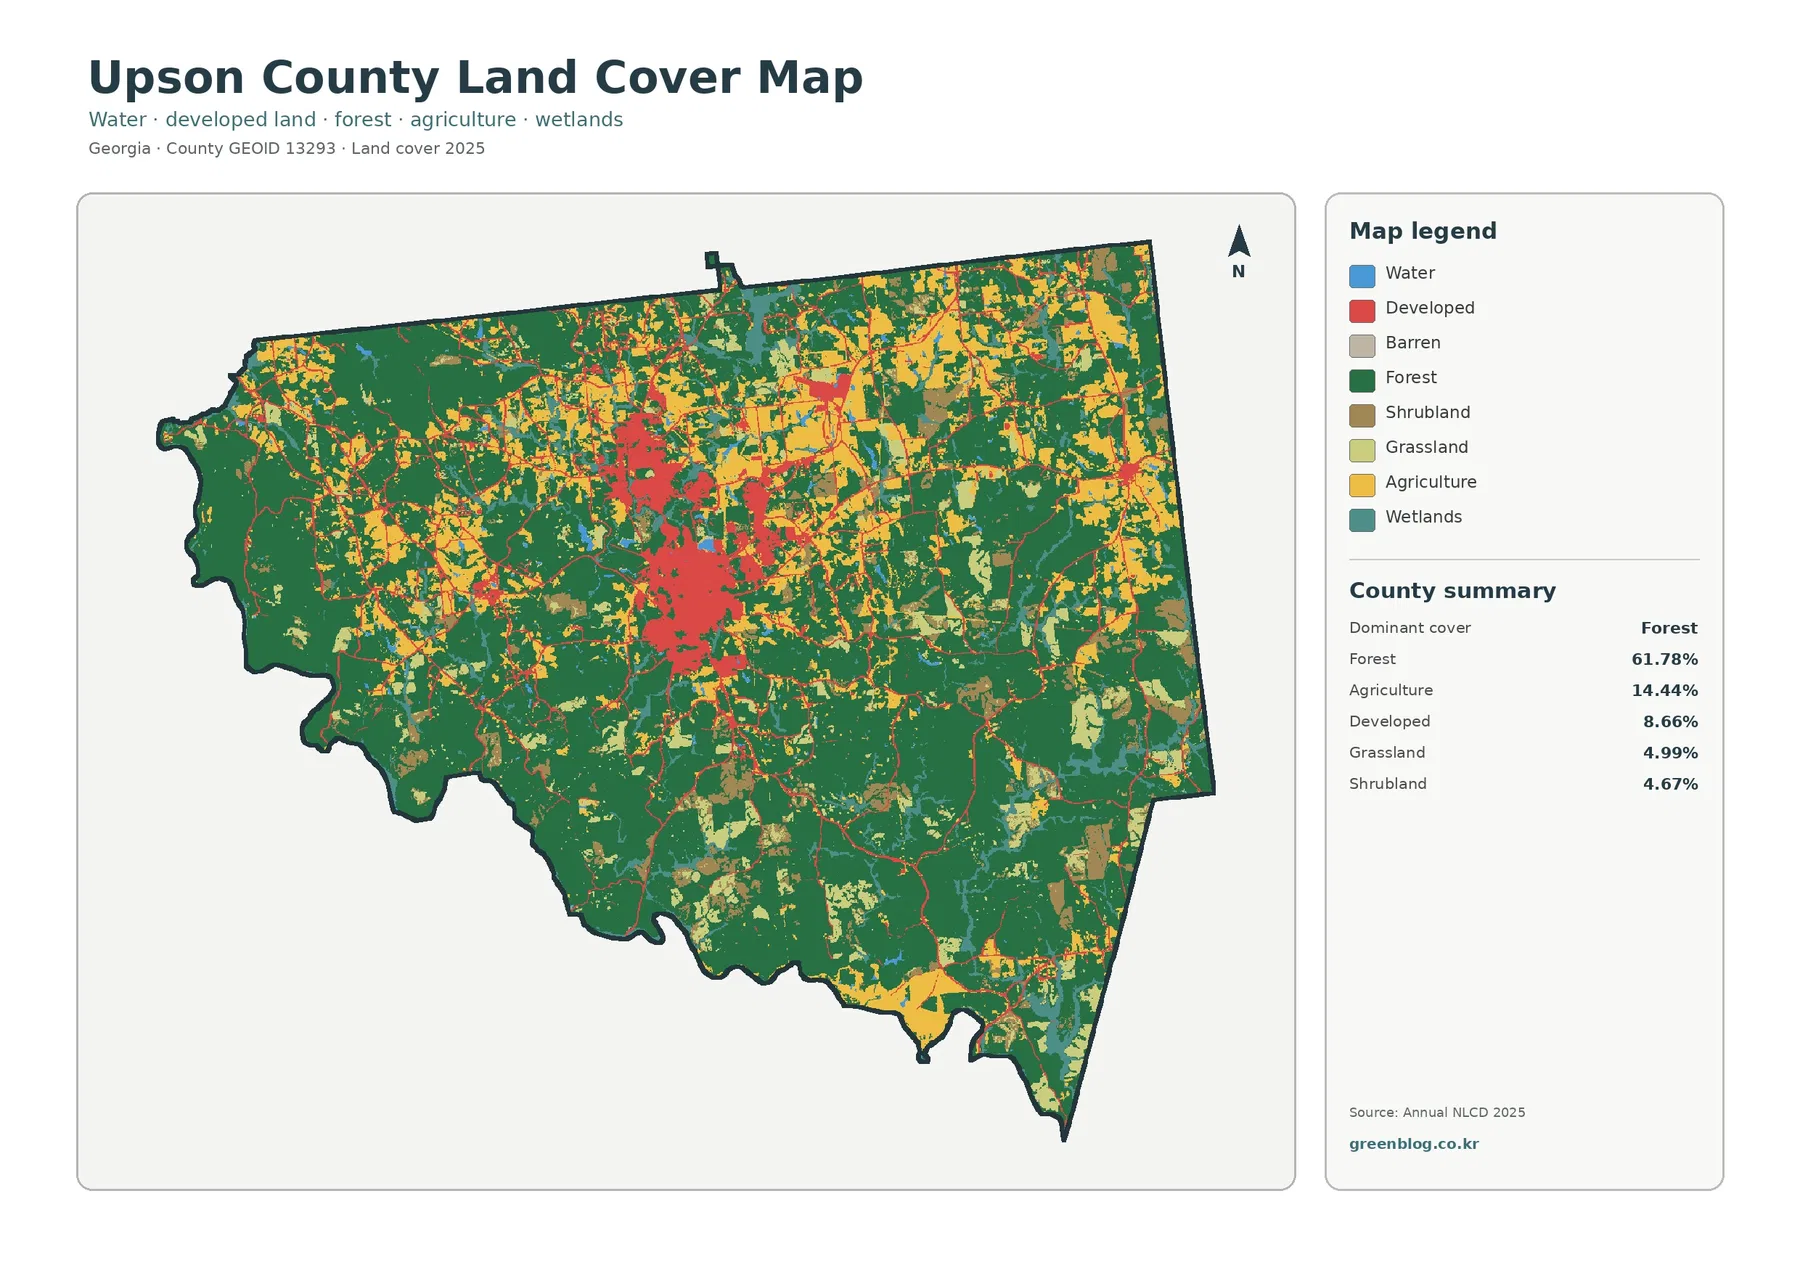
The first thing the countywide image establishes is scale. Dark green forest occupies broad areas in the west, south, and southeast and remains common in the north and east. Yellow agricultural patches and lighter open-cover classes interrupt that forest more often toward the north and east, while the largest red developed concentration sits near the center. Upson therefore has a forest-dominant background with a visibly more complex middle rather than a landscape divided into one forest half and one agricultural half.
Developed land accounts for 8.66% of the supplied summary, and its distribution is far more concentrated than the forest or agricultural classes. Upson County’s official information identifies Thomaston as the county seat and also lists The Rock and Yatesville as incorporated places. The map itself does not label municipal boundaries, so the central red cluster should not be treated as an exact city outline. It does, however, provide a clear county-scale picture of the more built-up area around the county’s main population center.
Agricultural openings are scattered through the forest instead of forming one farm belt
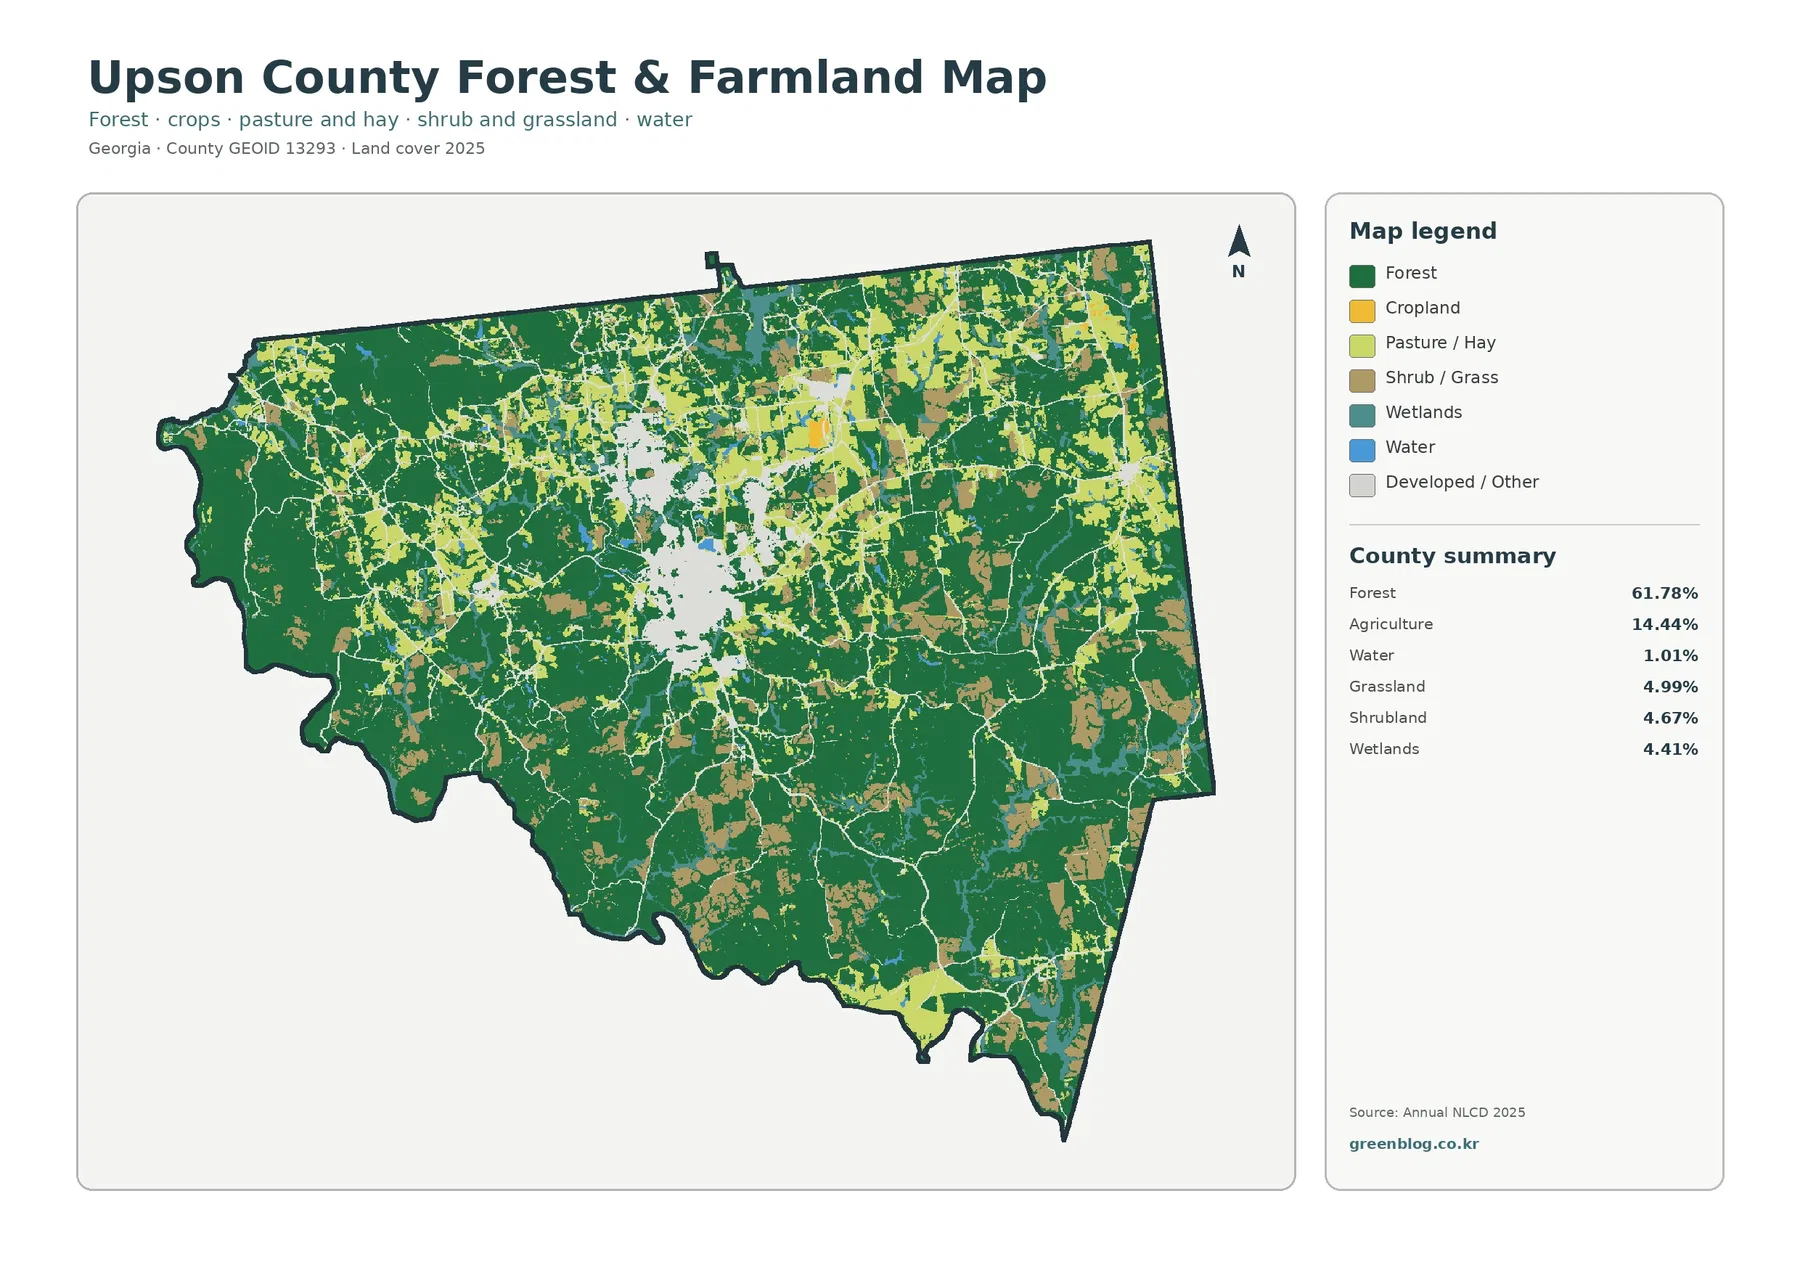
The forest-and-farmland view removes some of the visual complexity of the general map and makes the open-land pattern easier to follow. Forest still fills most of the county, but cropland and pasture or hay appear frequently in the north, northeast, and around the central developed area. The result is a patchwork rather than a simple edge: small and medium openings repeatedly interrupt the green cover, while larger wooded blocks become more continuous toward parts of the south and west.
Wetlands cover 4.41%, more than four times the open-water share. That is a useful reminder that wet environments do not always appear as blue water. Wetland classes may contain vegetation and saturated ground, so teal areas can occur beside forest, agriculture, or open land without looking like lakes. The 4.41% value is a land-cover classification, not a regulatory wetland determination; parcel-level wetland questions require current jurisdictional and site-specific sources.
The hard-surface map isolates a compact Thomaston-area footprint
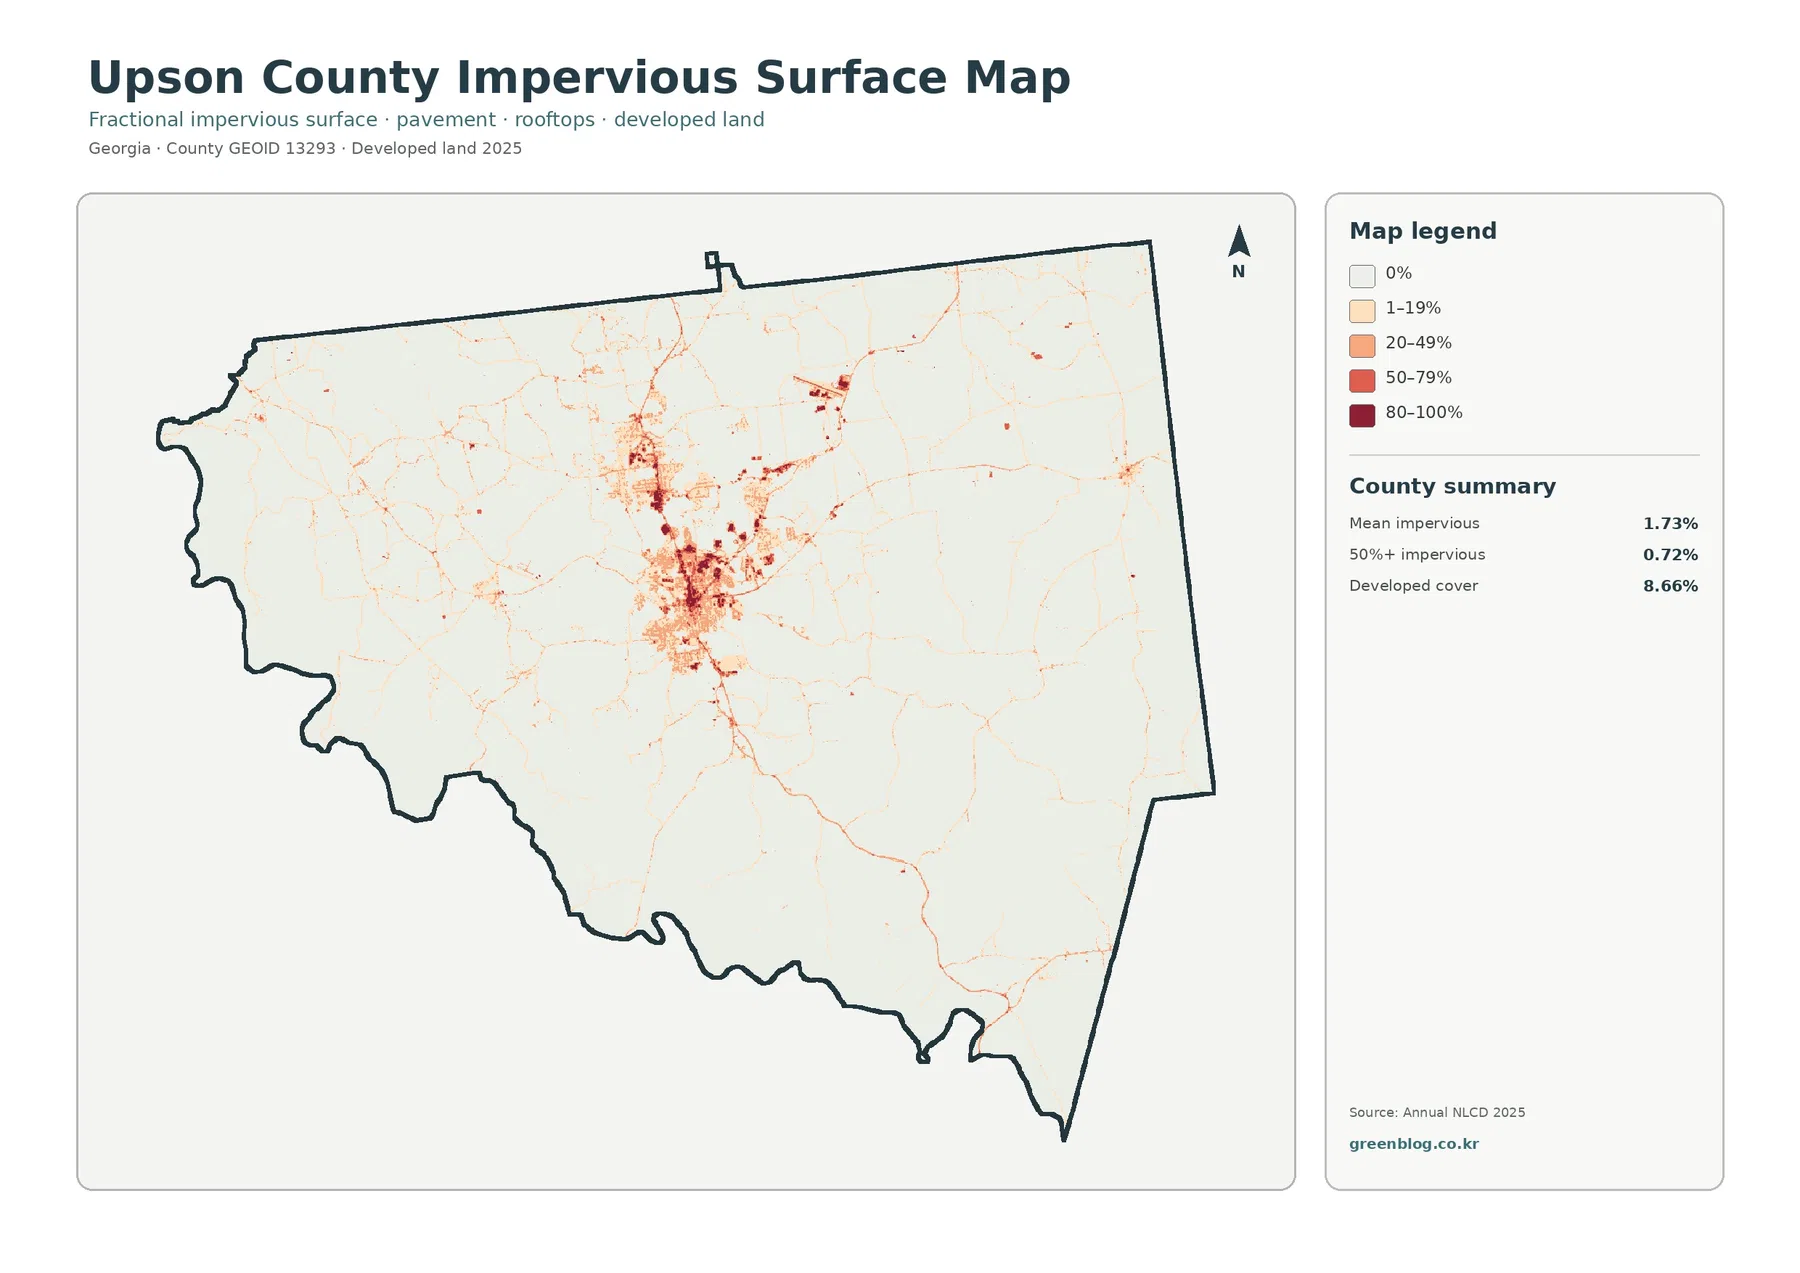
Upson County’s mean impervious value is 1.73%, and only 0.72% of the mapped area is listed at 50% impervious or greater. Those values are much smaller than the 8.66% developed-cover share. The difference is expected because a developed land-cover class can include lawns, trees, bare soil, and other permeable ground around buildings and roads. Impervious percentage focuses much more narrowly on rooftops, pavement, and similar hard surfaces.
The spatial pattern is more striking than the countywide average. Darker cells form a compact central cluster, surrounded by lighter traces that extend outward along a network of narrow corridors. This is the clearest map in the set for showing the hard-surface concentration associated with the Thomaston area. A smaller cluster is visible farther north, while large portions of the south, west, and east remain mostly in the zero or low-impervious classes.
The 1985–2025 endpoint comparison is widespread rather than localized
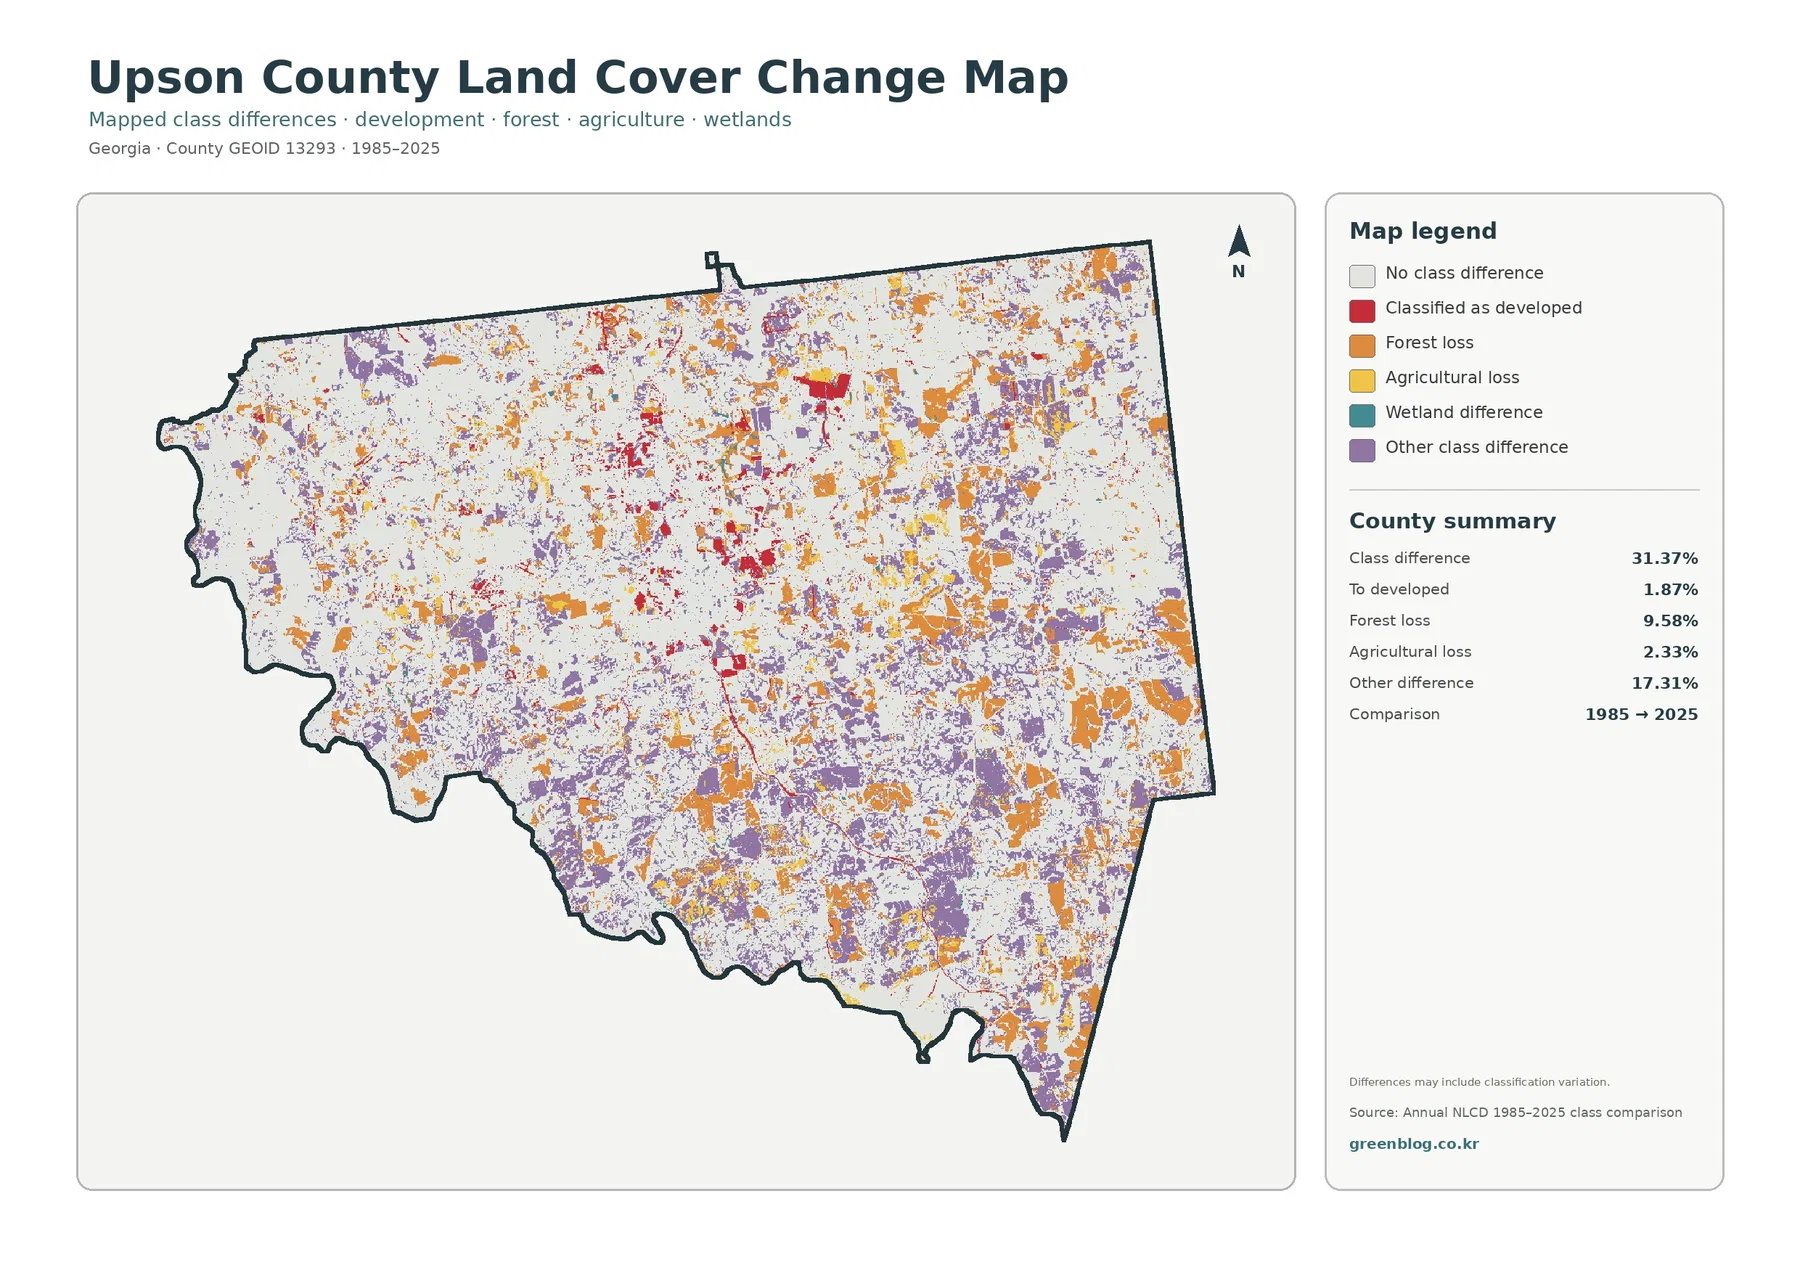
The change map has a very different appearance from the current-cover maps. The supplied summary lists 31.37% of the county as a class difference between 1985 and 2025. It includes 9.58% forest loss, 1.87% classified to developed, 2.33% agricultural loss, and 17.31% other difference. Because the total is nearly one-third of the county, the colored cells appear across many parts of Upson rather than forming one small change zone.
Orange forest-loss patches are especially noticeable in the east and northeast, but they also appear through central, western, and southern sections. Red developed-classification cells are more limited and are more frequent near the already settled middle of the county. Purple other-difference cells are widespread and account for the largest share of the summary. The map therefore does not support a simple claim that most change was urban expansion; the largest reported category is broader and less specific.
Local context helps explain the pattern without turning land cover into land use
The county also maintains Sprewell Bluff Park along the Flint River, where its official material emphasizes river and forest scenery. That information provides a verified local example of the relationship between water and wooded land in Upson County. The land-cover images can show the broader distribution of forest, wetlands, and water, but they do not contain park boundaries, trail routes, fishing access points, or property lines. Those details belong to the park and county reference maps.
This distinction becomes important whenever the maps are used in a report. “Forest” is a surface-cover class, not a statement that the land is publicly owned or protected. “Developed” does not identify a commercial or residential zoning district. “Agriculture” does not draw legal farm parcels. Keeping those concepts separate makes the maps more useful because each layer can be combined with the appropriate boundary or planning data instead of being asked to answer a question it was not designed to answer.
Thirty-meter cells are useful for county patterns, not parcel decisions
Annual NLCD is a raster product that commonly uses 30-meter cells. A single cell may contain trees, a small building, a driveway, grass, and a drainage feature, yet it receives one predominant classification in the land-cover product. That design makes consistent county-scale comparison possible, but it also sets a clear limit on how far the image should be enlarged or interpreted.
The 2025 maps describe the supplied observation year. Construction, logging, vegetation recovery, agricultural rotation, storm effects, or water-level changes after that point may not be present. The change map is also a comparison between 1985 and 2025 rather than a complete annual history. Anyone investigating a current site should check newer aerial imagery, parcel records, field observations, and the relevant official databases.
Each downloadable JPG measures 2480 × 1754 pixels. That size works well for screens, reports, classroom handouts, and many presentation layouts, but the supplied asset manifest does not mark the images as meeting an A3 high-resolution reference. If a large poster is needed, keep the original aspect ratio and print a proof first so the legend, narrow lines, and small color patches remain readable.
Choose one of the four JPGs to match the question
The ZIP contains one original JPG for each view discussed above: 2025 land cover, forest and farmland, impervious surface and developed land, and 1985–2025 land-cover change. The general map is best for overall composition. The vegetation map is clearer for forest, cropland, pasture, wetlands, and open-cover comparison. The impervious map isolates built hard surfaces, while the change layer is suited to screening locations whose endpoint classifications differ.
Frequently Asked Questions
What is the dominant land-cover class in Upson County?
Forest is the largest 2025 class at 61.78%. Agriculture follows at 14.44%, developed land at 8.66%, grassland at 4.99%, shrubland at 4.67%, wetlands at 4.41%, and water at 1.01%. Forest is widespread, but the central Thomaston-area cluster and the many agricultural openings make the county more varied than the forest percentage alone suggests.
Why is developed cover 8.66% when mean impervious cover is only 1.73%?
Developed land can include lawns, trees, bare soil, and other permeable surfaces around buildings and roads. Impervious percentage isolates harder surfaces such as rooftops, pavement, and parking areas. Upson County has a compact central hard-surface cluster, but broad forest and open-land areas keep the countywide impervious mean low.
Does the 31.37% class difference mean that nearly one-third of Upson County was developed?
No. The 31.37% figure is the total share of cells whose representative classes differ between the 1985 and 2025 endpoints. The supplied categories include 1.87% classified to developed, 9.58% forest loss, 2.33% agricultural loss, and 17.31% other difference. The map notes that classification variation may be included and does not identify the timing or cause of every difference.
Sources and Reference Data
- MRLC Annual NLCD Data – official access point for the annual land-cover products used for the 2025 and endpoint-comparison views.
- USGS Annual NLCD Land Cover Classification – official definitions and guidance for forest, developed, agriculture, water, wetland, and related classes.
- U.S. Census Bureau TIGER/Line Shapefiles – official geographic boundary resources used for county mapping and reference.
- Upson County – About – official county information on location, area, Thomaston as county seat, and incorporated communities.
- Upson County – Sprewell Bluff Park – official local information about the Flint River and the park’s river-and-forest setting.
Map File Information
The ZIP contains four original JPG maps for comparing Upson County's forest-dominant 2025 cover, scattered agricultural openings, the Thomaston-area hard-surface cluster, and widespread 1985–2025 class differences.
- Included Files: Use only the versions confirmed in the article and supplied images
- File Type: Use the confirmed download contents
- Intended Use: Printing, education, presentations, and map-based projects
Related Maps
- Appling County Georgia Land Cover Map
- Atkinson County Georgia Land Cover Map
- Bacon County Georgia Land Cover Map
Green Map creates custom-edited map images using open geographic data sources such as geoBoundaries, Natural Earth, OpenStreetMap, and government open data.
These maps are edited visual materials, not raw data files, and are provided for education, documents, presentations, and graphic reference.