Nearly half of Twiggs County is mapped as forest in the 2025 land-cover summary. Forest accounts for 48.54%, while wetlands add another 16.79%. Agriculture, grassland, and shrubland break up the wooded cover, and the broad wetland area along the western side gives the county a very different pattern from a landscape dominated by farms or dense development. Built land is present, but it is concentrated in small nodes and thin road corridors rather than spread evenly across the county.
Four maps on this page separate those patterns into useful views: current land cover, forest and farmland, fractional impervious surface with developed land, and mapped class differences from 1985 to 2025. The body images are WebP previews, while one ZIP contains four original 2480×1754 JPG maps. You can review the maps here first, then use the JPG set for a report, classroom handout, presentation, or county-level comparison.
Table of Contents
A forested county with a broad wetland edge
The dominant visual feature of the current land-cover map is dark green forest. Large wooded blocks appear in the north, center, and south, although roads, agricultural fields, grassland, shrubland, and wetland corridors interrupt them. The 48.54% forest share therefore describes a county where trees are the leading surface cover without implying that the landscape is one continuous forest.
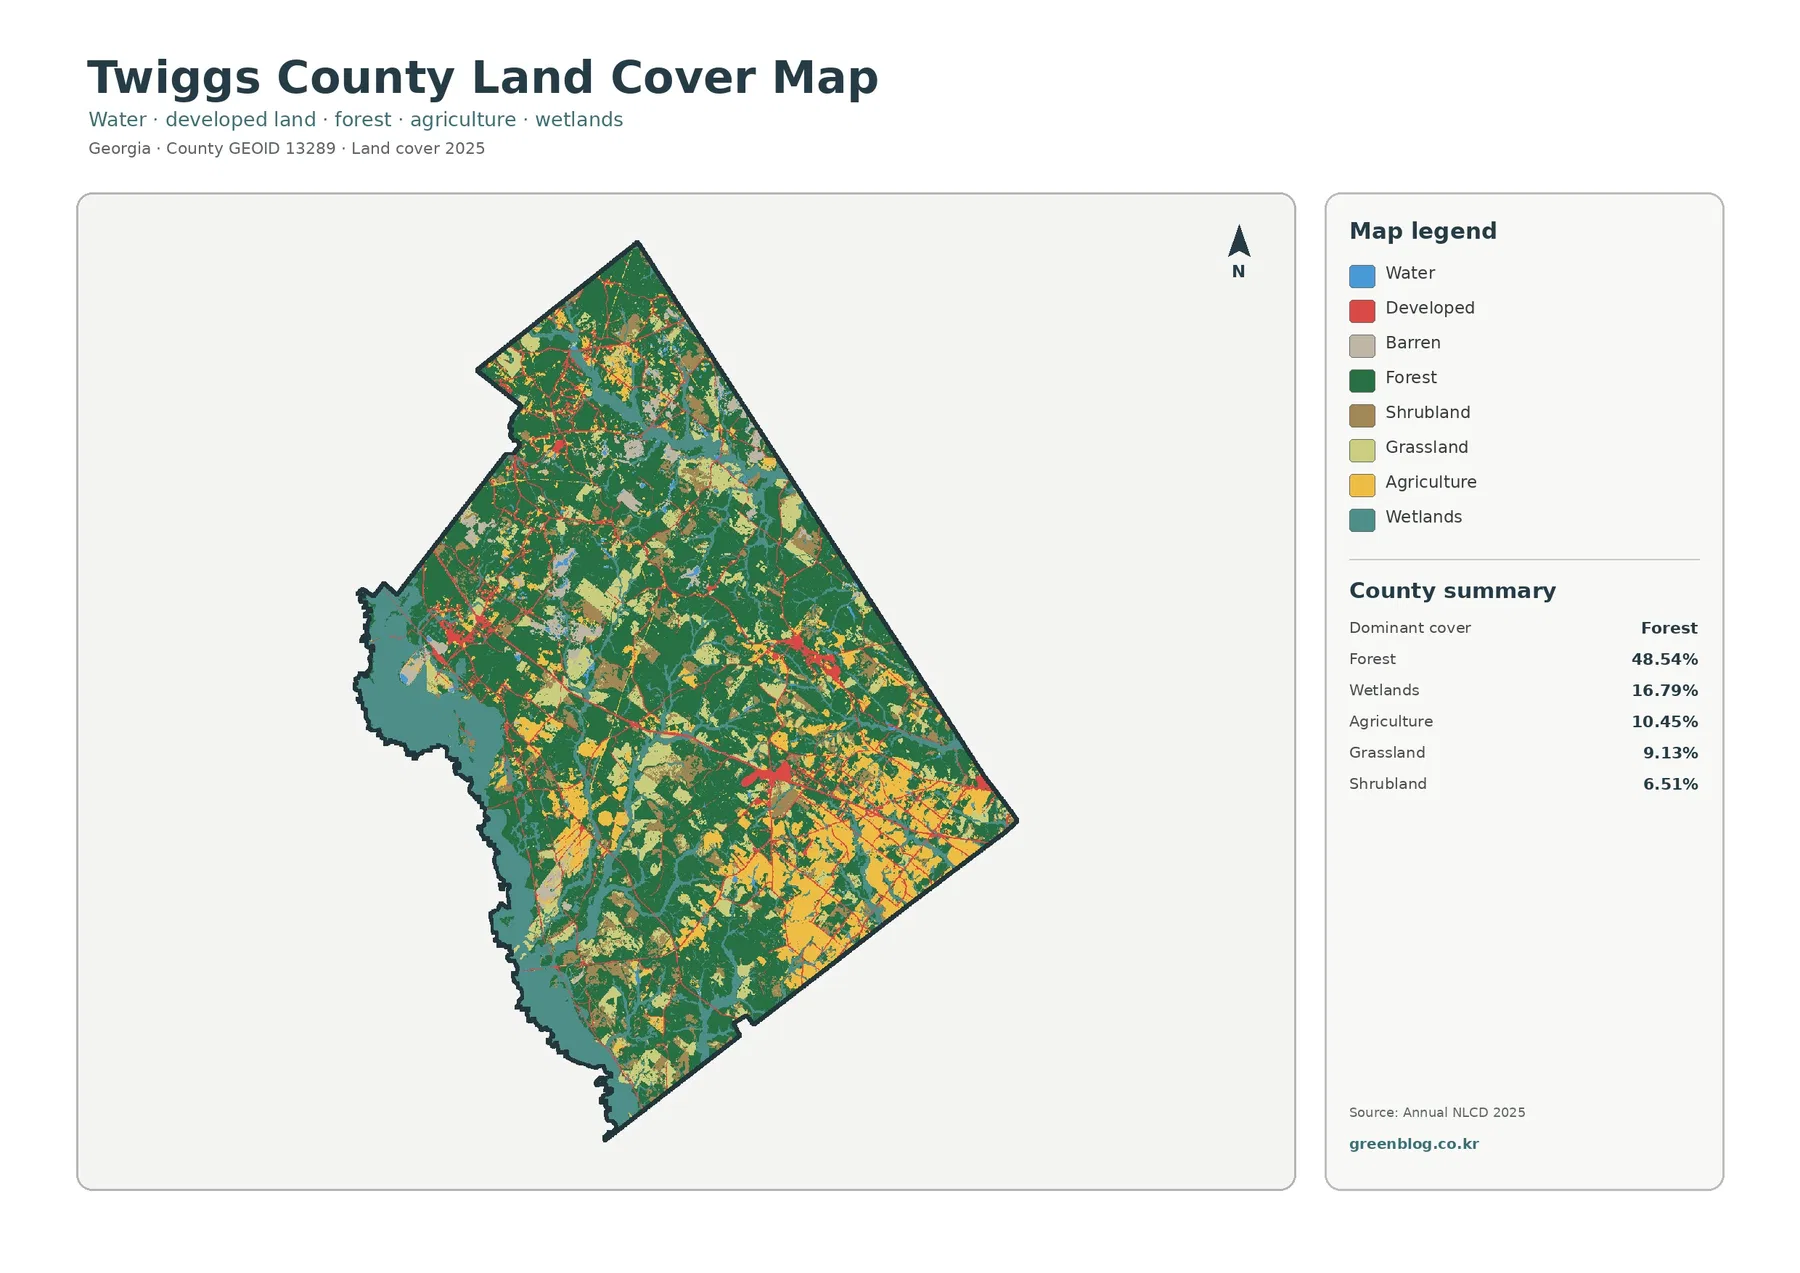
Wetlands cover 16.79%, the second-largest reported category. They are especially prominent along the western edge, where teal areas form a broad band with smaller branches extending inland. Water itself is only 0.75% of the county summary, so the blue and teal areas should not be combined when reading the map. Open water and wetland cover represent different mapped classes even when they occur next to each other.
Agriculture accounts for 10.45%, grassland 9.13%, and shrubland 6.51%. Yellow agricultural areas occur most frequently across the southeastern and south-central portions, with smaller patches elsewhere. Grassland and shrubland add another layer of open cover between forest blocks. Those percentages are useful, but the map adds an important detail: open land is distributed in many separate patches rather than forming one uniform agricultural belt.
| 2025 mapped cover | Share |
|---|---|
| Forest | 48.54% |
| Wetlands | 16.79% |
| Agriculture | 10.45% |
| Grassland | 9.13% |
| Shrubland | 6.51% |
| Water | 0.75% |
Land cover is not the same thing as zoning, parcel ownership, or legal land use. Annual NLCD classifies the visible surface into broad categories derived from satellite information. A forest-colored cell indicates that forest is the mapped surface class; it does not establish a conservation designation. Likewise, an agricultural color does not define a farm parcel or determine what can legally be built there. Parcel questions require local records and zoning information.
The Ocmulgee River corridor adds local context
Twiggs County’s 2023 Joint Comprehensive Plan gives useful context for the strong natural-cover pattern on the western side. The plan identifies the Ocmulgee River corridor as a major conservation area and discusses environmentally sensitive land, stream protection, recreation, and the Ocmulgee National Park and Preserve initiative. That planning document does not replace the land-cover map, but it helps explain why the western edge is important in local natural-resource discussions.
The supplied map does not label the river or draw conservation boundaries, so the teal and green areas should not be treated as exact protected-land limits. They show mapped surface cover. If a project requires the location of a park boundary, a regulated wetland, public river access, or a conservation easement, use the appropriate agency or county records rather than tracing the colors in this image.
For environmental education or a watershed overview, however, the combination is useful. The map makes the forest-wetland relationship visible at county scale, while the official plan provides a named local feature and policy context. Keeping those roles separate avoids turning a visual association into a legal or causal claim.
Forest and farmland are easier to separate in the second view
The forest-and-farmland version removes much of the visual competition from developed classes and groups the landscape around forest, cropland, pasture or hay, shrub and grass, wetlands, and water. That makes the county’s 48.54% forest share easier to see as a connected but interrupted pattern. It also makes the agricultural patches in the southeast and south-central areas stand out more clearly.
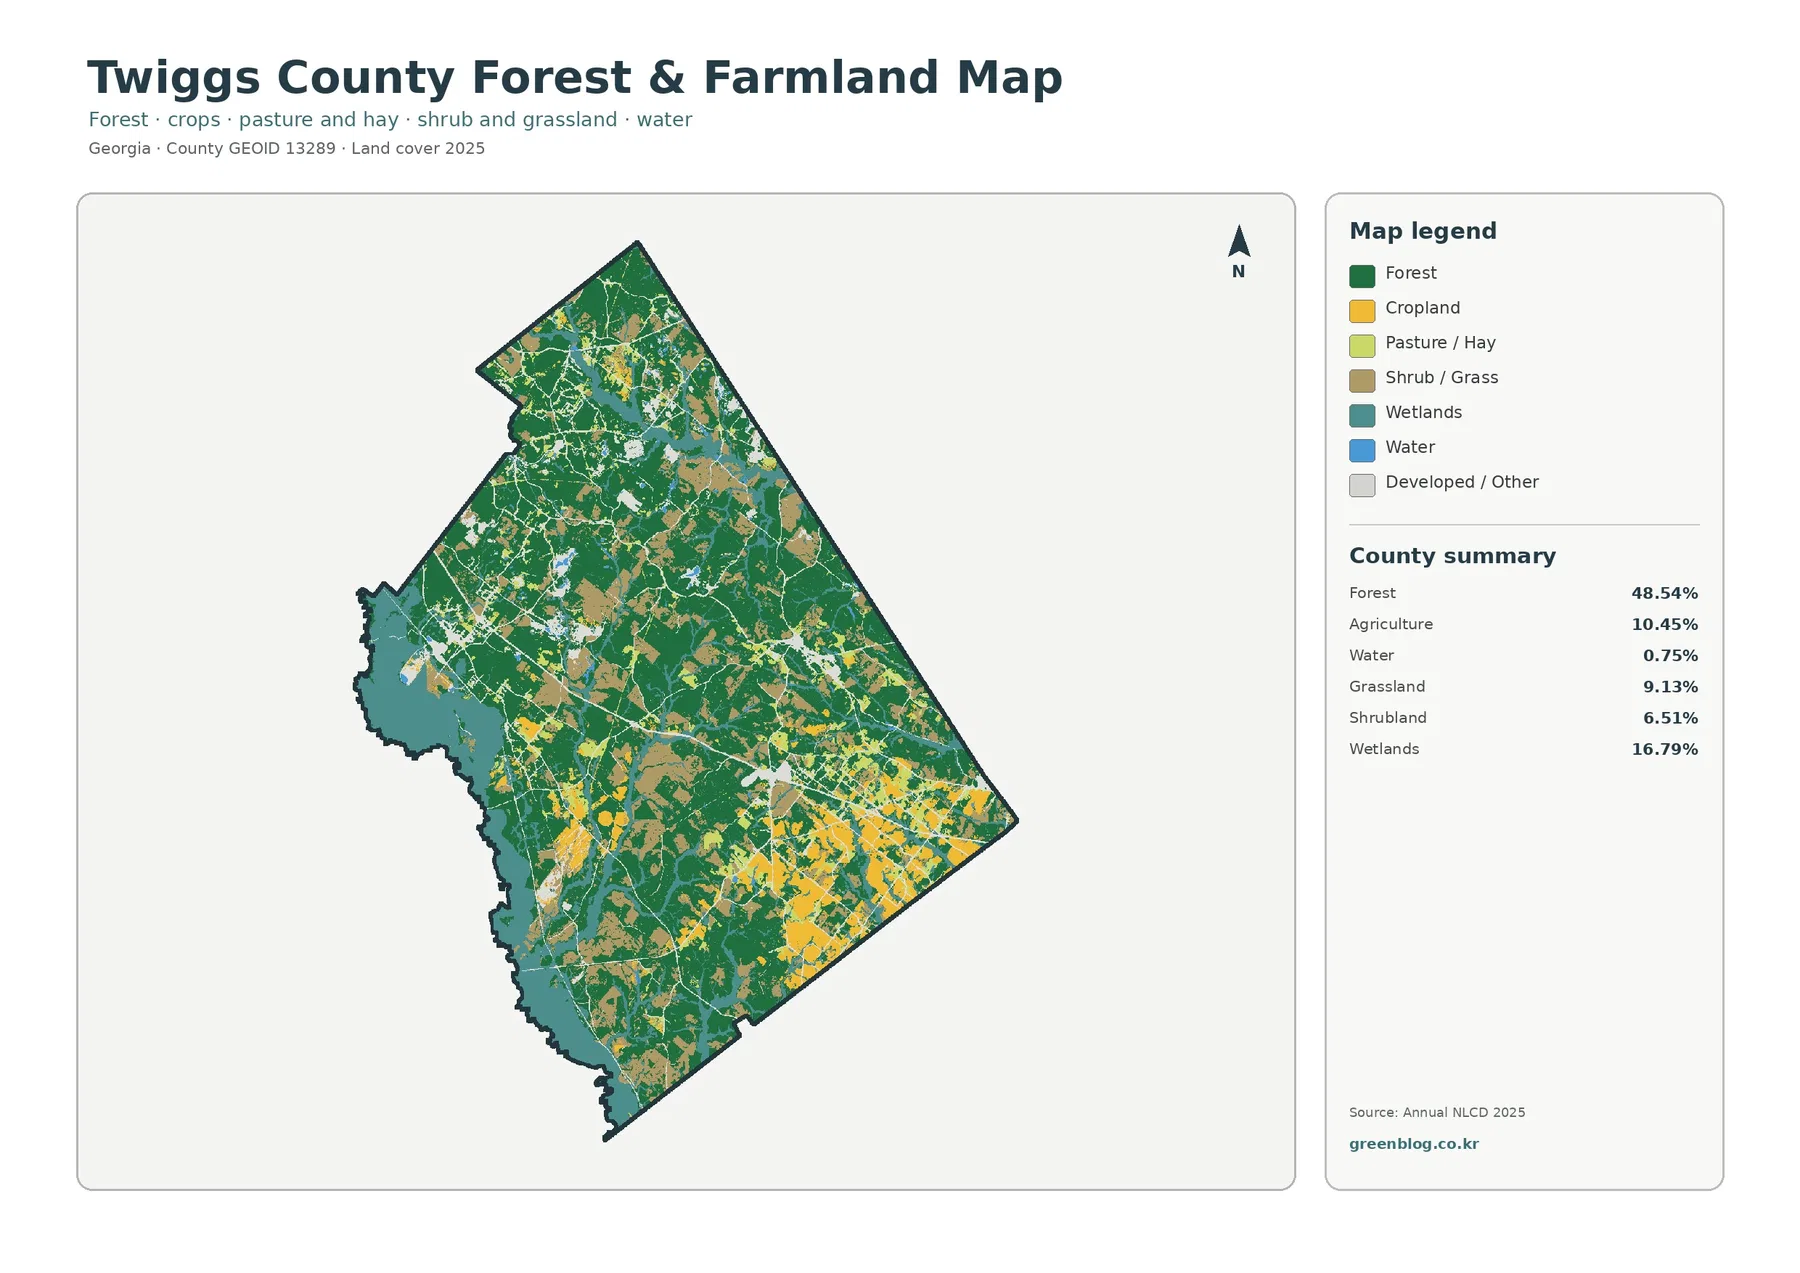
The southern half contains many places where yellow cropland and lighter open-cover colors sit beside dark green woods. Northern Twiggs County generally looks more forested, although open patches are still present. Along the western side, wetlands remain visually important and often border forest. This mixture is more informative than a countywide agricultural percentage alone because it shows where farming is more common and where natural cover remains dominant.
The 2023 comprehensive plan also treats farmland and timberland as resources worth considering in long-term planning. It discusses large-lot patterns, agriculture and forestry preservation, and forest buffers in relevant character areas. Those policies should not be read directly from the map colors, but they provide an official reason to treat forest and farmland as meaningful parts of the county’s planning context rather than as decorative background on a map.
For a school project or a presentation about rural land cover, this is usually the easiest map to explain. A reader can compare wooded and agricultural areas without first learning every developed class. It still does not identify individual farms, crop types, ownership, or active management. The agricultural color is a broad land-cover category, not a cadastral or farm-operation layer.
Built surfaces occupy a small share but form visible nodes
Twiggs County’s developed cover is 5.78%, and the mean impervious value is only 1.17%. Impervious surface means pavement, rooftops, and other hard surfaces that do not readily absorb water. Only 0.36% of the mapped area reaches at least 50% impervious cover, which explains why most of the county appears very light on the fractional impervious map.
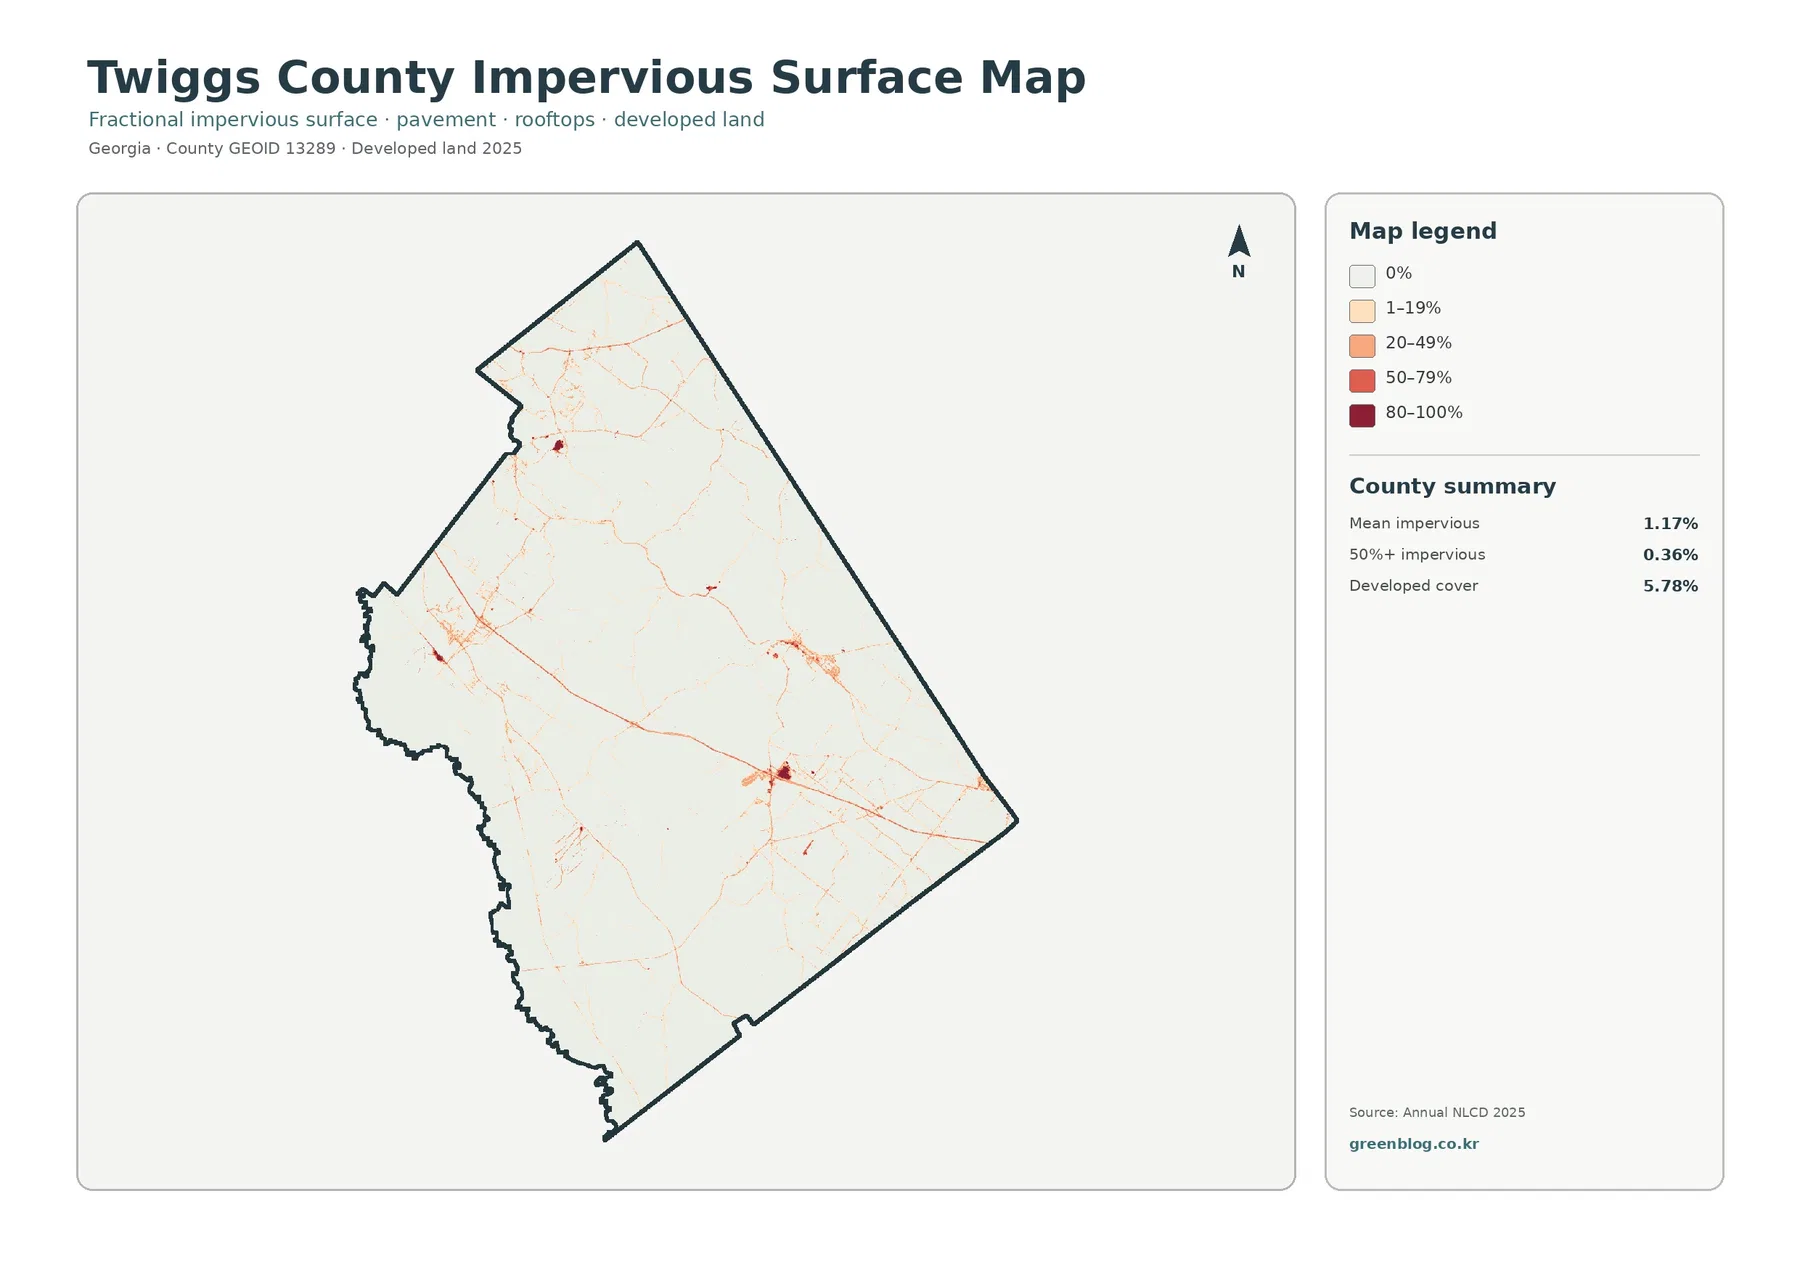
The darker marks are not evenly distributed. Several compact nodes appear along the road network, including a clear concentration in the central-to-southeastern part of the county and another farther west. Thin lines connect many smaller developed locations. The county’s comprehensive plan discusses Jeffersonville and Danville as local centers and also identifies industrial activity near State Route 96 and Interstate 16. Those official references provide useful transportation and settlement context, but the map alone should not be used to draw municipal boundaries around individual red clusters.
Developed cover and impervious percentage answer related but different questions. A low-density developed cell may include buildings and roads mixed with lawn or other vegetation, so it can belong to a developed land-cover class without being mostly hard surface. The 5.78% developed-cover figure therefore should not be substituted for the 1.17% mean impervious value. The two measurements are most useful when read together.
| 2025 development measure | Value |
|---|---|
| Developed cover | 5.78% |
| Mean impervious surface | 1.17% |
| Area at 50%+ impervious | 0.36% |
This map can support a basic discussion of where hard surfaces are concentrated, but it is not a stormwater model. Flooding, runoff volume, drainage performance, and water quality depend on rainfall, elevation, soil, drainage infrastructure, and many other factors. A darker impervious value is evidence of more hard surface within a mapped cell, not proof of a specific flood or pollution outcome.
The 1985–2025 map records class differences, not just development
The change map compares the land-cover class assigned to the same locations in 1985 and 2025. Twiggs County has a 44.19% total class-difference value. That number is much larger than the developed-cover share, and it should not be described as the percentage of the county that urbanized. It combines many kinds of differences between the two mapped years.
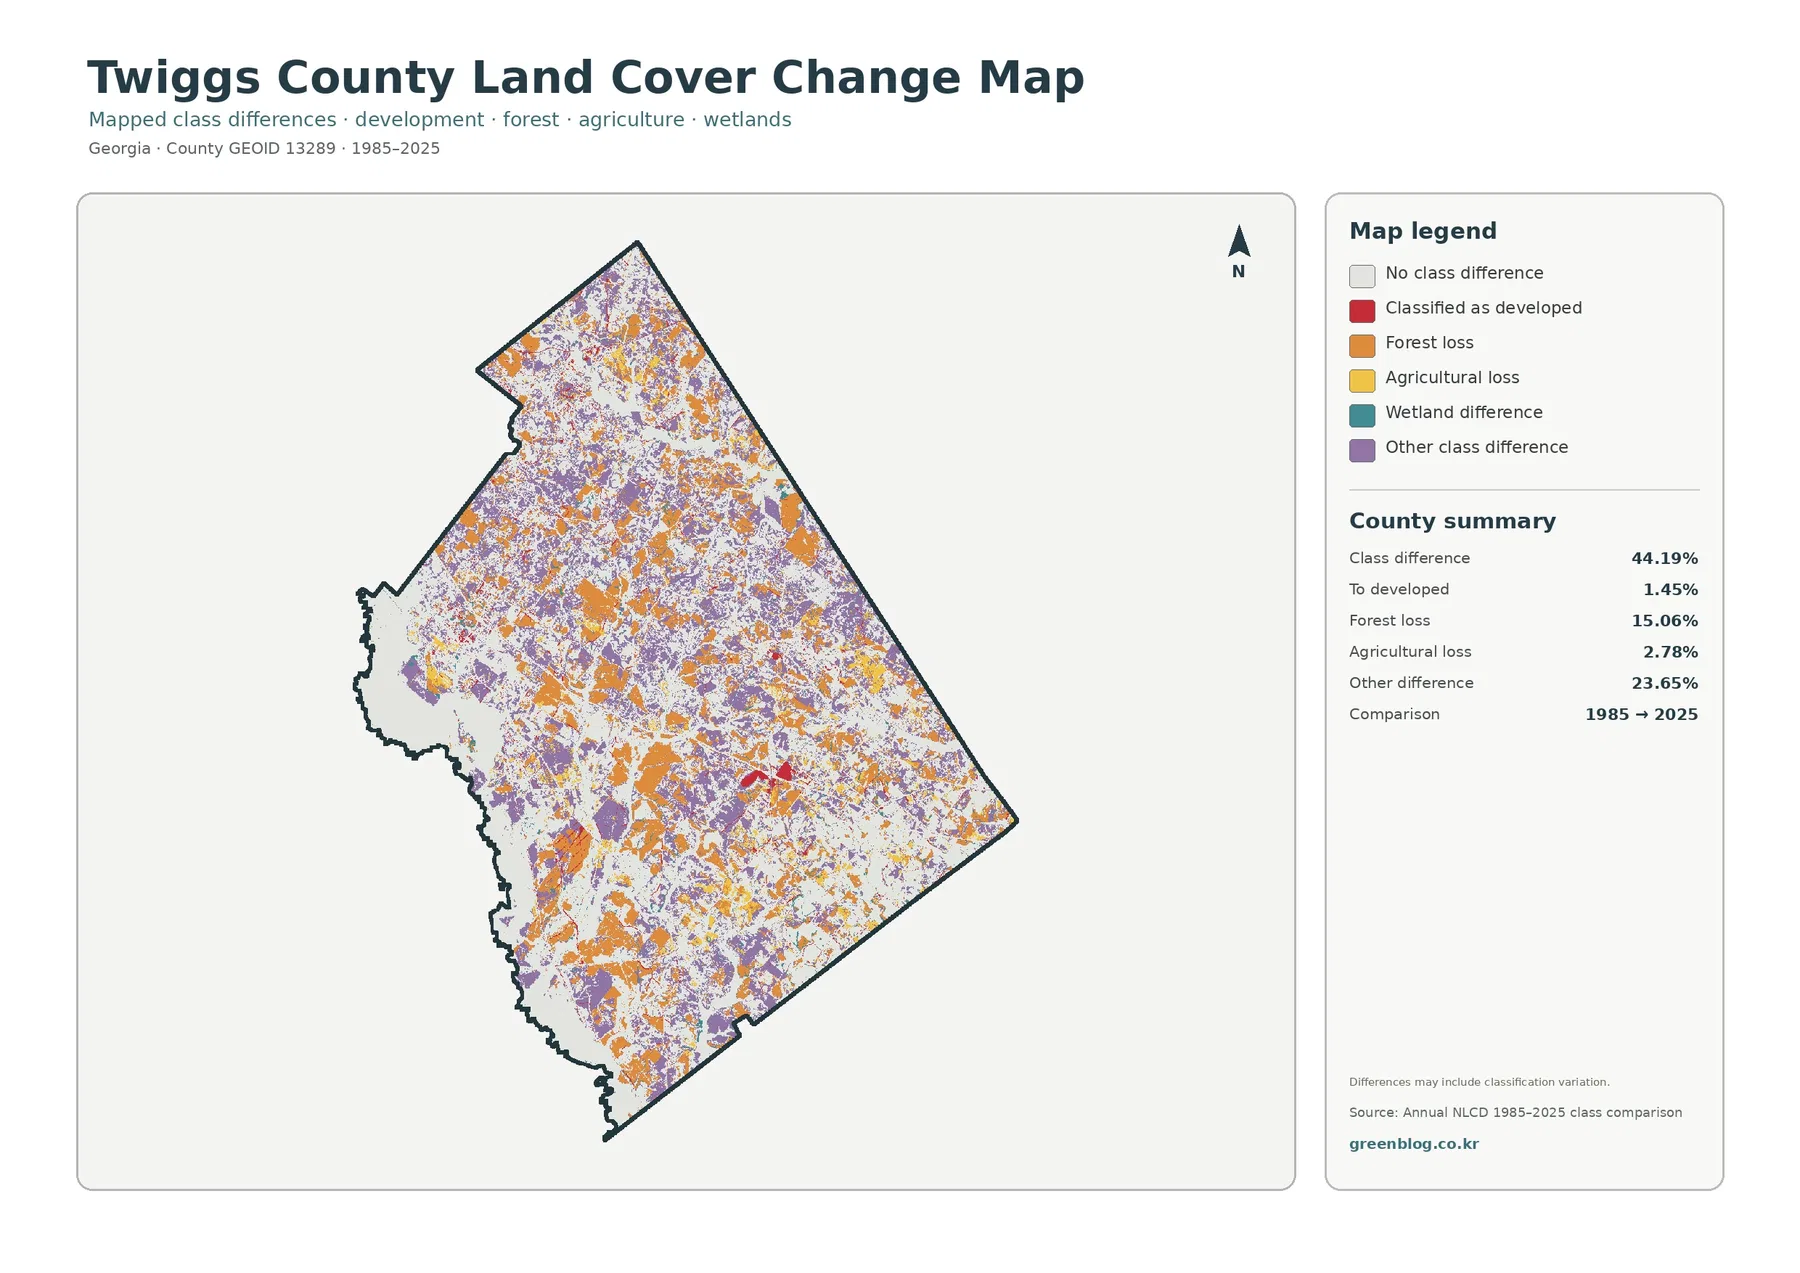
Forest loss accounts for 15.06%, agricultural loss 2.78%, and change to developed 1.45%. The largest named summary category is other class difference at 23.65%. Orange forest-loss patches and purple other-difference areas occur throughout much of the county, while red developed-change areas are comparatively limited. The visual pattern reinforces the statistical point that the 44.19% total represents a broad set of class transitions, not one development trend.
A mapped difference also does not guarantee that every pixel represents a simple real-world conversion from one stable land use to another. Annual NLCD is a classification product derived from remotely sensed data. Boundaries can shift, mixed pixels can be assigned differently, and similar covers can change class between years. The map itself notes that differences may include classification variation. For a site-specific history, compare additional years, aerial imagery, and local records.
| 1985→2025 mapped difference | Share |
|---|---|
| Any class difference | 44.19% |
| Forest loss | 15.06% |
| Agricultural loss | 2.78% |
| Changed to developed | 1.45% |
| Other class difference | 23.65% |
How to read a 30-meter raster map
Annual NLCD products are raster datasets at 30-meter spatial resolution. In simple terms, the landscape is divided into grid cells, and each cell receives a land-cover class or a numeric surface value. That approach is excellent for consistent county, regional, and national comparison, but it generalizes features that are smaller than the cell or mixed within it. A narrow stream, a small building, or several surface types on one parcel may not appear as separate objects.
This is why a color boundary on the map should not be used as a property line. It also explains why the impervious map uses percentage classes instead of trying to draw every rooftop. The same caution applies to wetlands: a mapped wetland class is useful for understanding broad surface patterns, but it is not a substitute for a jurisdictional wetland determination or a field survey.
The maps are strongest when the question is county-scale: Where is forest dominant? Which side has the broadest wetland cover? Where do agricultural patches become more common? Where are hard surfaces concentrated? Those questions match the scale and purpose of the data. Questions about a specific parcel, driveway, drainage ditch, or legal boundary require more detailed sources.
Choosing the right map for a report or classroom
Use the current land-cover map when you need one image that summarizes the whole county. It places forest, wetlands, agriculture, developed land, water, grassland, shrubland, and other mapped classes in a single frame. For a first slide or a county profile, it gives the clearest overall picture of Twiggs County in 2025.
Choose the forest-and-farmland map when the discussion centers on rural land, forestry, agriculture, habitat, or the relationship between open and wooded areas. The reduced legend makes those patterns easier to read. The impervious-surface map is better for transportation and settlement context because small built nodes and road-like hard-surface lines are far more visible there than on the general map.
Use the 1985–2025 change map when the question involves time. It is most effective when paired with the current land-cover map, because the change categories tell you where classifications differ while the current map tells you what the 2025 surface looks like. A change map by itself can be misleading if a reader assumes every colored difference is development.
- County overview: 2025 land-cover map
- Forest and agricultural comparison: forest and farmland map
- Hard surfaces and built clusters: impervious/developed-land map
- Long-term class differences: 1985–2025 land-cover change map
Using the JPG download without overstating resolution
The on-page WebP previews are 1800×1273 pixels. Each original JPG in the download is 2480×1754 pixels. That is useful for common documents, slides, and moderate-size print layouts, but the supplied source dimensions do not meet an A3-at-300-dpi reference size. Enlarging the file in an editor can increase pixel dimensions without adding new map detail, so it is better to test the image at the intended output size.
Keep the legend, year, and source visible whenever possible. This matters especially for the change and impervious maps because similar colors do not have the same meaning across all four images. Cropping away the legend may save space, but it can turn a useful comparison into an ambiguous graphic. If the map is used in a report, a short caption stating “Annual NLCD 2025” or “1985–2025 class comparison” gives readers essential context.
Frequently Asked Questions
What is the largest land-cover class in Twiggs County?
Forest is the largest mapped class in the 2025 summary at 48.54%. Wetlands are second at 16.79%, followed by agriculture at 10.45% and grassland at 9.13%. The map shows forest across all parts of the county, with especially broad wetland cover along the western side and more frequent agricultural patches in portions of the south and southeast.
Does the western wetland area match the Ocmulgee River corridor?
The county’s official 2023 comprehensive plan identifies the Ocmulgee River corridor as an important conservation area. The supplied land-cover map does not label the river or legal conservation boundaries, so it should not be used to trace an exact corridor. The plan is best used as local context for understanding why the broad western natural-cover area matters.
Does 44.19% mean that Twiggs County developed that much?
No. The 44.19% value is the total share of mapped cells whose land-cover class differs between 1985 and 2025. Only 1.45% is summarized as change to developed. Forest loss, agricultural loss, other class differences, and wetland differences make up the rest, so the total is not an urbanization rate. Map File Information The ZIP contains four original JPG maps for Twiggs County: 2025 land cover, forest and farmland, impervious/developed land, and 1985-2025 land-cover change.
Map File Information
Download the map files associated with this page for reference, printing, and compatible visual projects.
- Included Files: Use only the versions confirmed in the article and supplied images
- File Type: Use the confirmed download contents
- Intended Use: Printing, education, presentations, and map-based projects
Related Maps
- Appling County Georgia Land Cover Map
- Atkinson County Georgia Land Cover Map
- Bacon County Georgia Land Cover Map
Sources and references
- MRLC Annual NLCD Data – official access to Annual NLCD land-cover and impervious-surface data.
- USGS Annual NLCD Collection 1.2 – official documentation for the 2025 extension, land-cover products, and 30-meter spatial resolution.
- U.S. Census Bureau TIGER/Line Shapefiles – official boundary and geographic data that can supplement the county maps.
- Georgia DCA – Twiggs County, Danville & Jeffersonville Comprehensive Plan – official local planning context for the Ocmulgee River corridor, farmland and timberland, transportation, and development areas.
- Twiggs County Official Website – county government information and local administrative context.
Green Map creates custom-edited map images using open geographic data sources such as geoBoundaries, Natural Earth, OpenStreetMap, and government open data.
These maps are edited visual materials, not raw data files, and are provided for education, documents, presentations, and graphic reference.