Putnam County is mostly forest, but its developed land has two very different forms: a compact inland center around Eatonton and a more fragmented pattern along the Lake Oconee and Lake Sinclair shorelines. Forest covers 60.16% of the supplied 2025 classification, agriculture 12.43%, and developed land 9.22%. This Putnam County Georgia Land Cover Map helps compare those settlement forms with the wooded interior and smaller farm openings.
The page includes four WebP views for current land cover, vegetation, impervious surface, and the 1985–2025 endpoint comparison. Four original 2480 × 1754 JPG maps are available in one ZIP for county profiles, forest-farm comparisons, lake-edge context, lessons, and presentations.
Table of Contents
Eatonton forms the clearest inland hard-surface center
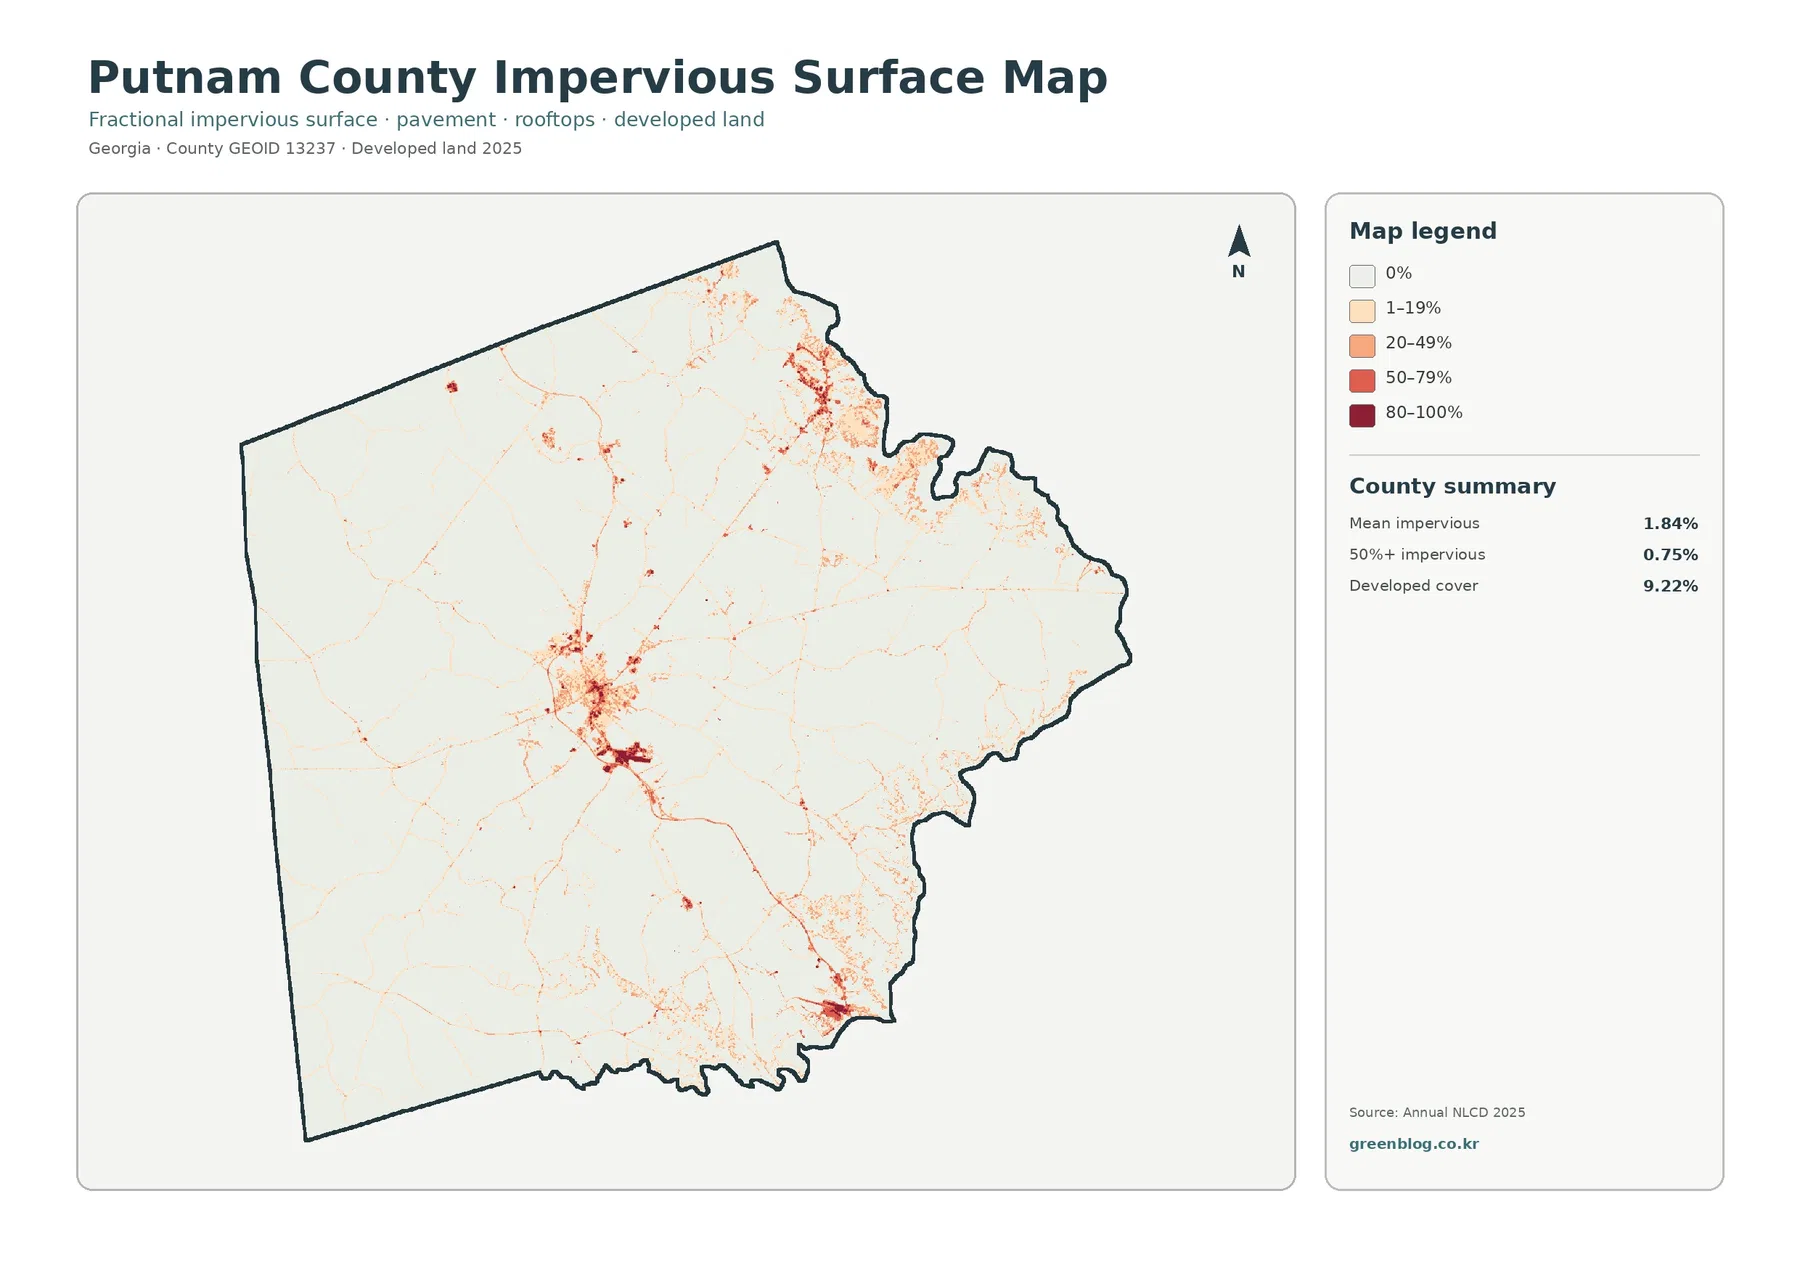
The strongest impervious cluster sits near the center of the county and provides a useful reference for Eatonton, the Putnam County seat. Darker 50–79% and 80–100% cells collect in a compact core, with lower values extending outward along road-shaped lines. The surrounding landscape quickly becomes much less paved.
Mean impervious cover is 1.84%, and only 0.75% of Putnam County reaches 50% impervious surface or higher. Developed land covers 9.22%, a broader class that can include yards, trees, grass, and exposed ground around roads and buildings. The impervious product therefore gives a sharper picture of where the hardest surfaces are concentrated.
The developed footprint is not the Eatonton city boundary. Land cover classifies the physical surface rather than municipal jurisdiction or zoning. Exact city limits, parcel boundaries, and legal land-use decisions require Census or local government mapping.
Forest covers 60.16%, leaving most of the county wooded
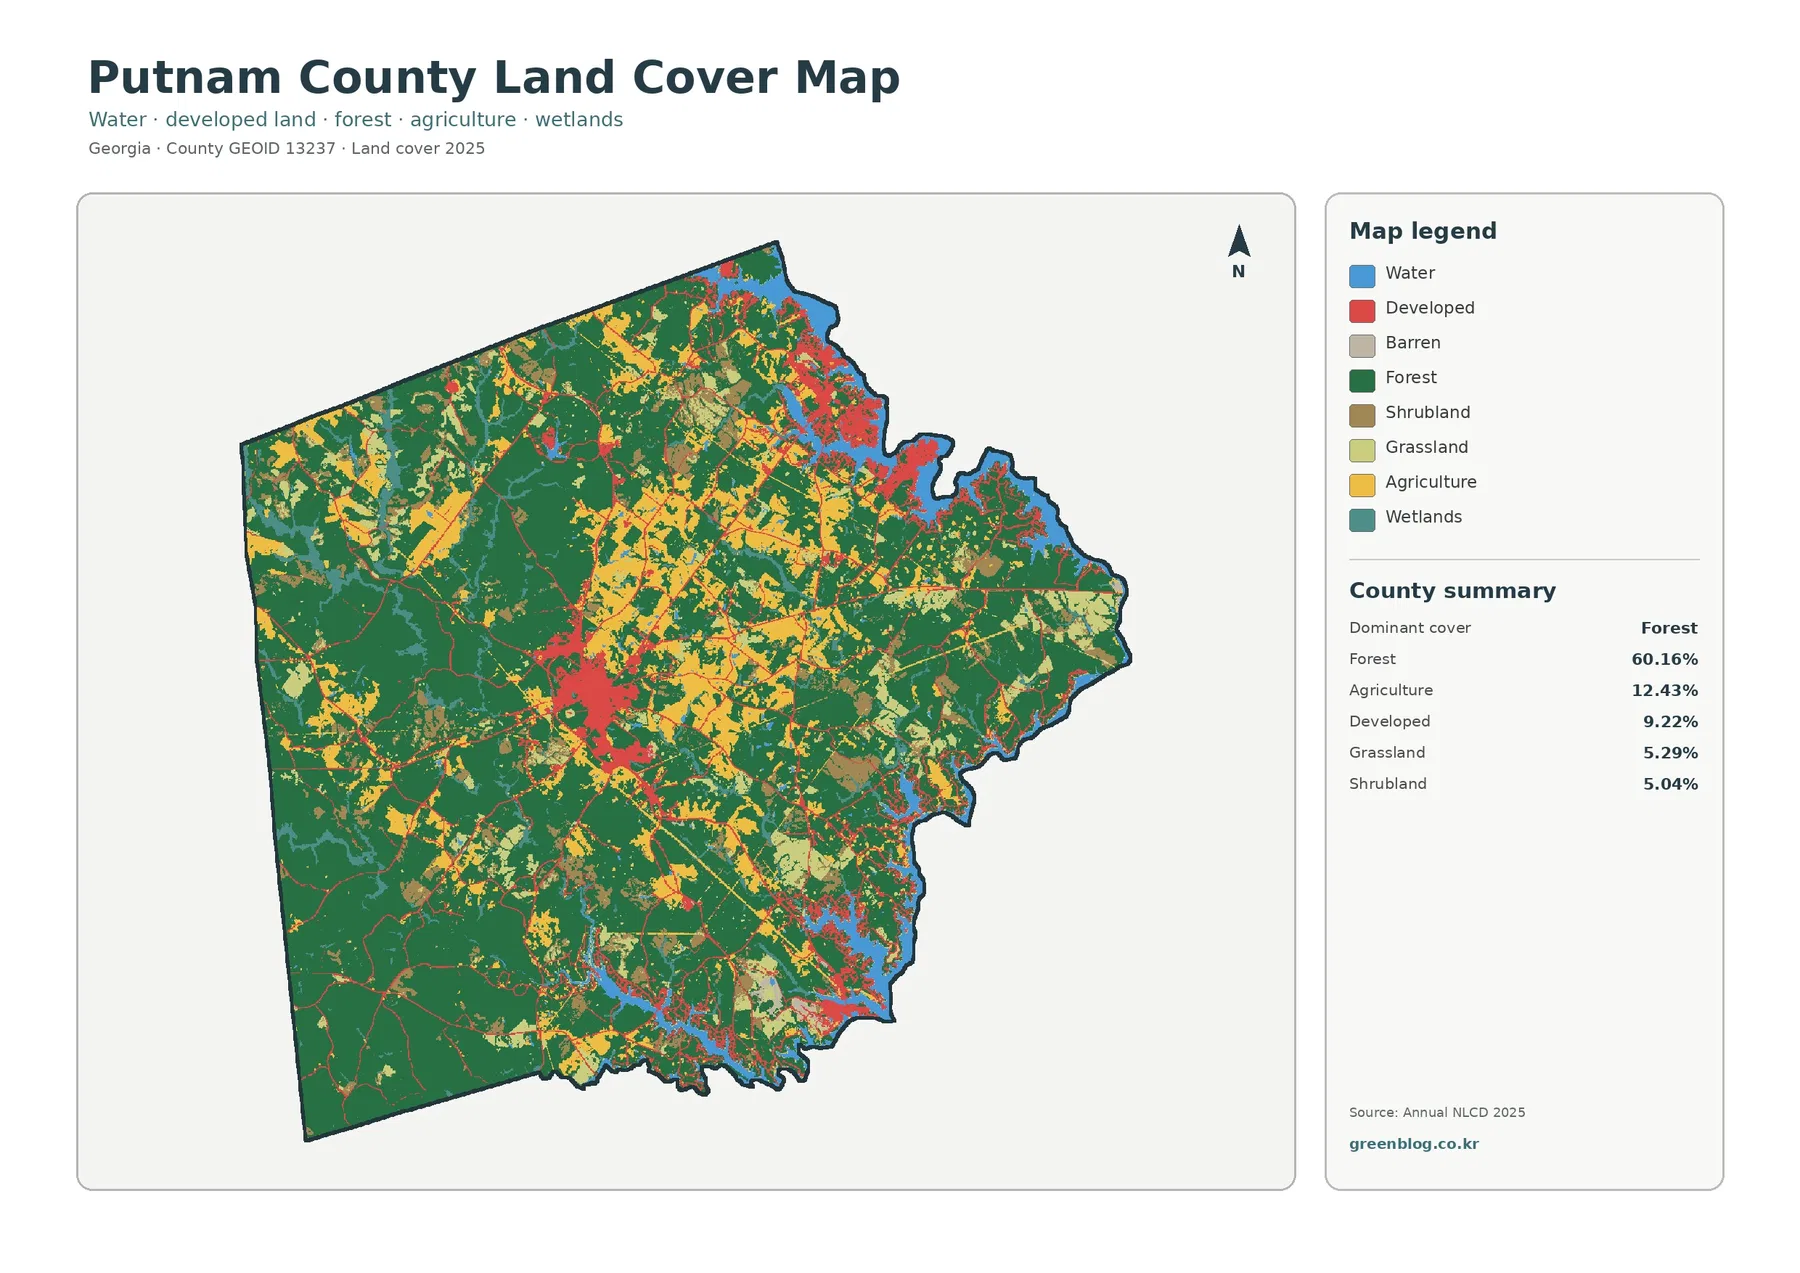
Dark-green forest dominates the west, southwest, and much of the interior. It also remains extensive between the central town and the eastern water edge. At 60.16%, forest is large enough that even areas with farms or development usually sit close to substantial woodland.
Agriculture covers 12.43%. Farm blocks are most noticeable in the north and north-central interior, with smaller openings in the west and south. The pattern is dispersed rather than confined to one agricultural district, and fields often meet forest directly along irregular edges.
Grassland accounts for 5.29% and shrubland 5.04%. Those open classes matter because not every pale or brown rural area is cropland. Wetlands cover 3.04%, while open water reaches 4.58%, making the county’s large eastern and southeastern water features a visible part of the map.
Lake Oconee and Lake Sinclair create a different settlement pattern from Eatonton
Putnam County and Eatonton’s 2022 joint comprehensive plan identifies Lake Oconee and Lake Sinclair as major county resources and says their shorelines are the main population hubs outside Eatonton. The 2025 map likewise shows developed land repeatedly following the northeastern and southeastern shorelines. Unlike the compact Eatonton-area core, these built surfaces are broken into smaller clusters and thin bands that follow the water’s irregular edge. That difference is one of the most useful county-specific patterns in the map set.
Water covers 4.58%, a substantial enough share to shape where settlement appears. The surrounding development does not identify one specific housing type or community, because developed land can include homes, roads, commercial sites, and other built surfaces. The map supports a shoreline-settlement comparison but not a parcel-by-parcel description.
Green shoreline cover only means trees are the predominant surface. It does not identify public access, conservation boundaries, or ownership; those questions require separate parcel and local records.
The vegetation view separates northern farm openings from the wooded west
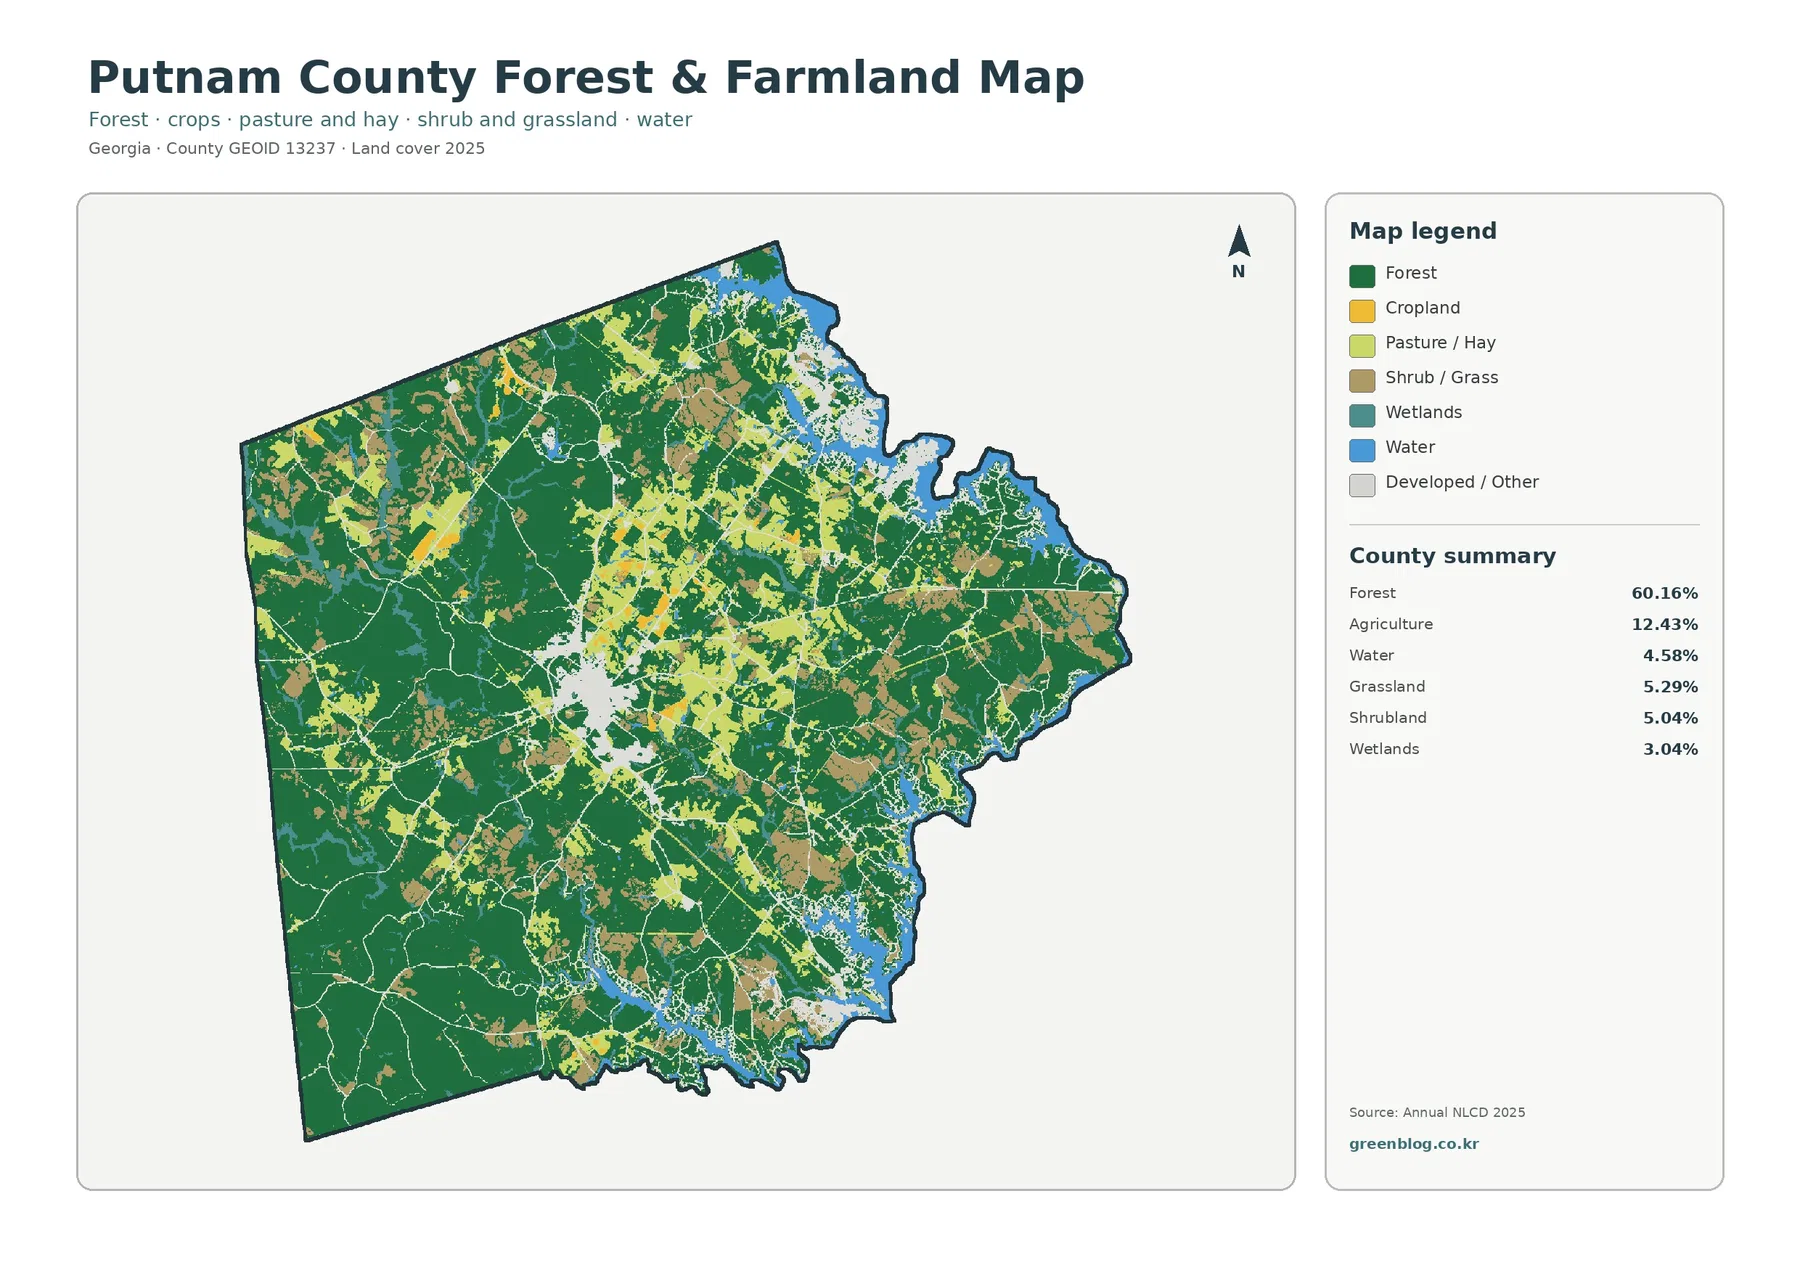
With developed cover muted, the west and southwest become broad wooded areas, while yellow farm blocks stand out more clearly through the north and central interior. Grassland and shrub cover add smaller openings, so the rural landscape is more varied than a simple forest-versus-cropland split.
Putnam County’s agricultural share is modest compared with forest, yet it occupies visible blocks around the county rather than isolated single fields. This makes the vegetation map useful for comparing working land with wooded tracts without allowing settlement colors to dominate the page.
Annual NLCD uses 30-meter raster cells. A field edge, trees, a driveway, grass, and a building can share one square even though the map displays one predominant class. Narrow tree rows, small ponds, mixed rural lots, and shoreline features can therefore look simplified.
The 1985–2025 endpoint map records widespread class differences outside developed areas
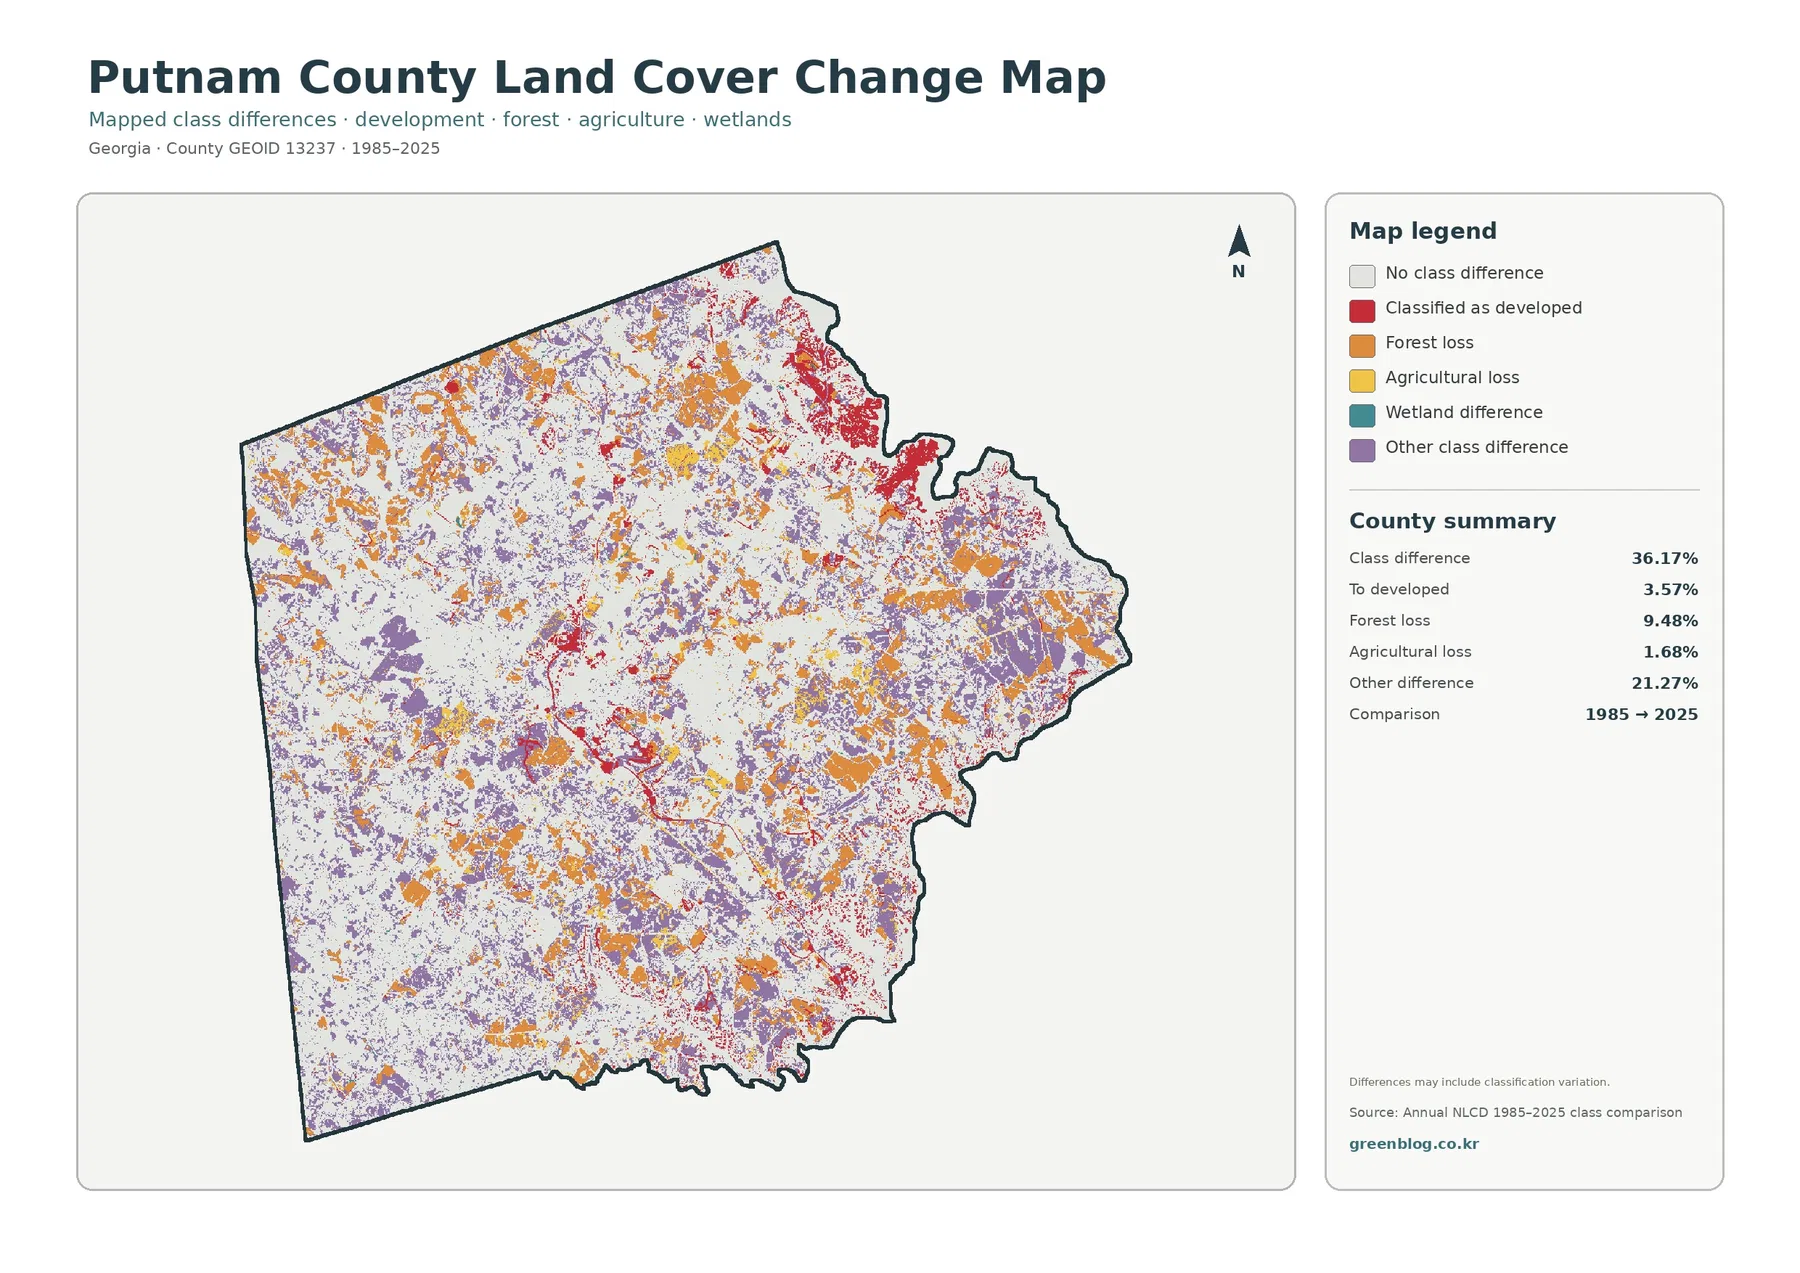
The total endpoint class difference is 36.17%. This number counts raster cells assigned different classes in 1985 and 2025. It is not an urbanization rate and does not mean that 36.17% of Putnam County was damaged or permanently converted.
The printed summary lists 21.27% other difference, 9.48% forest loss, 3.57% classified to developed, and 1.68% agricultural loss. Developed-change red is most obvious around the central settlement and the northeastern and southeastern shoreline areas. Forest-loss orange and other-difference purple are spread much more widely across the county.
Wetland difference appears in the legend without a separately printed percentage. The missing rate should not be reconstructed by subtracting the listed categories from 36.17%. Classification variation may also contribute to some patches, so intermediate imagery and local forestry, farming, or development records are needed before assigning causes.
Impervious cover helps compare settlement intensity, not flood risk
The hard-surface map is especially useful for comparing the compact central core with fragmented shoreline development. Areas that look broadly developed on the land-cover map can still have low impervious percentages because yards, trees, and other permeable surfaces remain inside developed classes.
Impervious cover is not a flood model. Near large water bodies, property-level questions also need elevation, drainage, rainfall, soil, water-level, and hazard data.
Land cover is not zoning, ownership, or shoreline jurisdiction
Blue water does not establish ownership or public access, red developed land does not define a city or zoning district, and green forest does not mark protected land. Yellow agriculture is also not a farm-parcel boundary. The maps describe surface cover, not legal rights or land-management authority.
Because the source uses generalized raster cells, small shoreline coves, narrow roads, isolated buildings, and mixed parcels may be simplified. Parcel surveys, permits, shoreline rules, and exact road or municipal boundaries require current local, state, or federal records.
Choosing the four JPG maps for Putnam County
Start with the 2025 countywide map when the goal is to show the forest majority, agricultural openings, central development, and large water features together. The vegetation view is better for farm-versus-forest comparisons. Choose the impervious map for Eatonton and shoreline hard surfaces, and reserve the endpoint map for a separate discussion of 1985–2025 class differences.
Each JPG measures 2480 × 1754 pixels and works well for reports, lessons, and presentations. The package does not identify the files as meeting an A3 high-resolution reference, so test a proof before large-format printing.
Frequently Asked Questions
What is the dominant land-cover class in Putnam County?
Forest is the largest class in the supplied 2025 summary at 60.16%. Agriculture follows at 12.43% and developed land at 9.22%, leaving most of the county wooded outside the main settlement areas.
Why does development appear along the water even though mean impervious cover is only 1.84%?
Shoreline development is concentrated in relatively small areas, while much of the county remains forested. Developed classes can also include yards and trees, so their total area is larger than the hard-surface percentage.
Does the 36.17% endpoint difference measure urban growth?
No. It counts all cells with different class labels in 1985 and 2025. The summary separately lists 9.48% forest loss, 3.57% classified to developed, 1.68% agricultural loss, and 21.27% other difference.
Sources and Reference Data
- MRLC Annual NLCD Data – official access to annual land-cover and comparison products
- USGS Annual NLCD Land Cover Classification – definitions for forest, agriculture, developed land, water, wetlands, and related classes
- U.S. Census Bureau TIGER/Line Shapefiles – authoritative county, place, and transportation layers for comparison
- Georgia DCA – Putnam County & Eatonton Comprehensive Plan – official planning context for Eatonton, Lake Oconee, Lake Sinclair, and future land use
- Putnam County Government – official county government and Planning & Development reference
- UGA Extension – Putnam County – local agriculture, natural-resource, and community education resources
Map File Information
The ZIP contains four original JPG maps for comparing Putnam County's 60.16% forest cover, agricultural openings, Eatonton development, lake-edge settlement, impervious surfaces, and 1985–2025 class differences.
- Included Files: Use only the versions confirmed in the article and supplied images
- File Type: Use the confirmed download contents
- Intended Use: Printing, education, presentations, and map-based projects
Related Maps
- Appling County Georgia Land Cover Map
- Atkinson County Georgia Land Cover Map
- Bacon County Georgia Land Cover Map
Green Map creates custom-edited map images using open geographic data sources such as geoBoundaries, Natural Earth, OpenStreetMap, and government open data.
These maps are edited visual materials, not raw data files, and are provided for education, documents, presentations, and graphic reference.