Morgan County is evenly split enough between woods and working land that neither can be ignored. Forest covers 50.06% of the supplied 2025 map, agriculture 29.45%, and developed land 8.52%. Madison forms the largest built center near the middle, while smaller settlements and road corridors extend west and southeast. This Morgan County Georgia Land Cover Map makes that rural-to-town contrast easy to compare without treating the county as one continuous suburban area.
The page includes four WebP previews for current land cover, vegetation, impervious surface, and the 1985–2025 endpoint comparison. Four original 2480 × 1754 JPG maps are bundled in one ZIP for reports, classroom use, local planning context, and presentation graphics.
Table of Contents
Madison and the east-west road pattern are the clearest built features
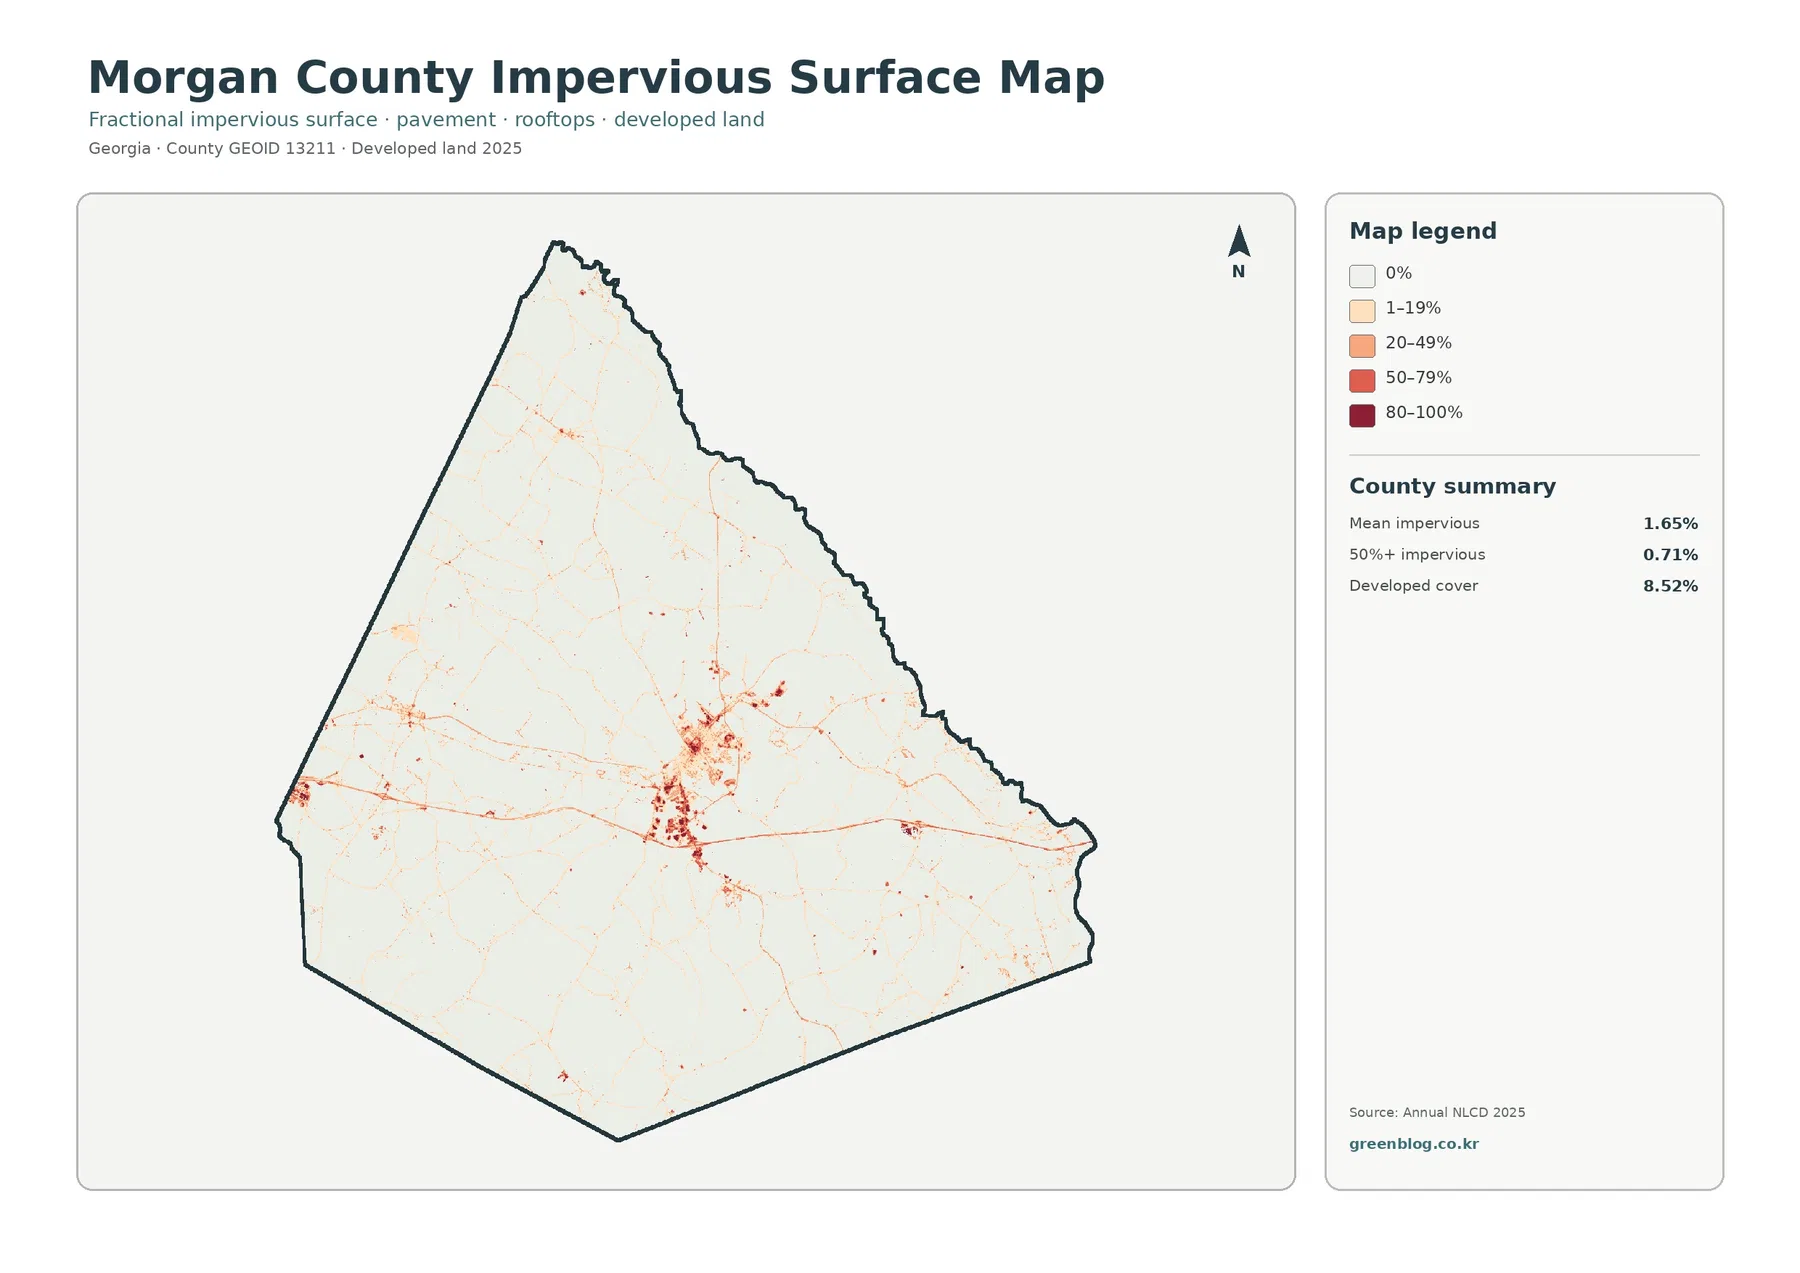
The strongest hard-surface concentration sits near the center of the county. Official Morgan County history identifies Madison as the county seat, and current county planning material places several major routes through the city. The dark central cluster therefore has a clear local reference rather than appearing as an unnamed developed patch.
One long hard-surface line crosses the county from west to east, with other lines meeting it around Madison. County documents identify Interstate 20, U.S. 278, and U.S. 129/441 among the major routes serving the city. The raster cannot label those roads on its own, but the official transportation context helps explain why built surfaces are elongated as well as clustered.
Mean impervious cover is 1.65%, and 0.71% of Morgan County reaches 50% impervious surface or more. Developed land covers 8.52%, which is a broader category. Lawns, trees, yards, and exposed ground can occur inside developed classes, while fractional impervious cover isolates roofs, pavement, parking areas, and other hard surfaces.
Rutledge, Bostwick, and Buckhead keep the settlement pattern multi-centered
Morgan County’s planning pages identify Bostwick, Rutledge, and Buckhead alongside Madison in the county’s joint planning work. Rutledge lies west of Madison, Bostwick to the north, and Buckhead to the southeast. Small developed pockets in those directions fit a county made up of one larger center and several smaller towns rather than one merged urban footprint.
Rutledge is officially described as being close to both U.S. 278 and Interstate 20, while I-20 also passes just south of Buckhead. Those road relationships help explain why some hard-surface traces continue away from Madison toward the western and southeastern sides of the county. Exact town limits still require a municipal boundary layer because the land-cover images contain no political borders.
Forest covers half the county, with agriculture filling much of the space between wooded blocks
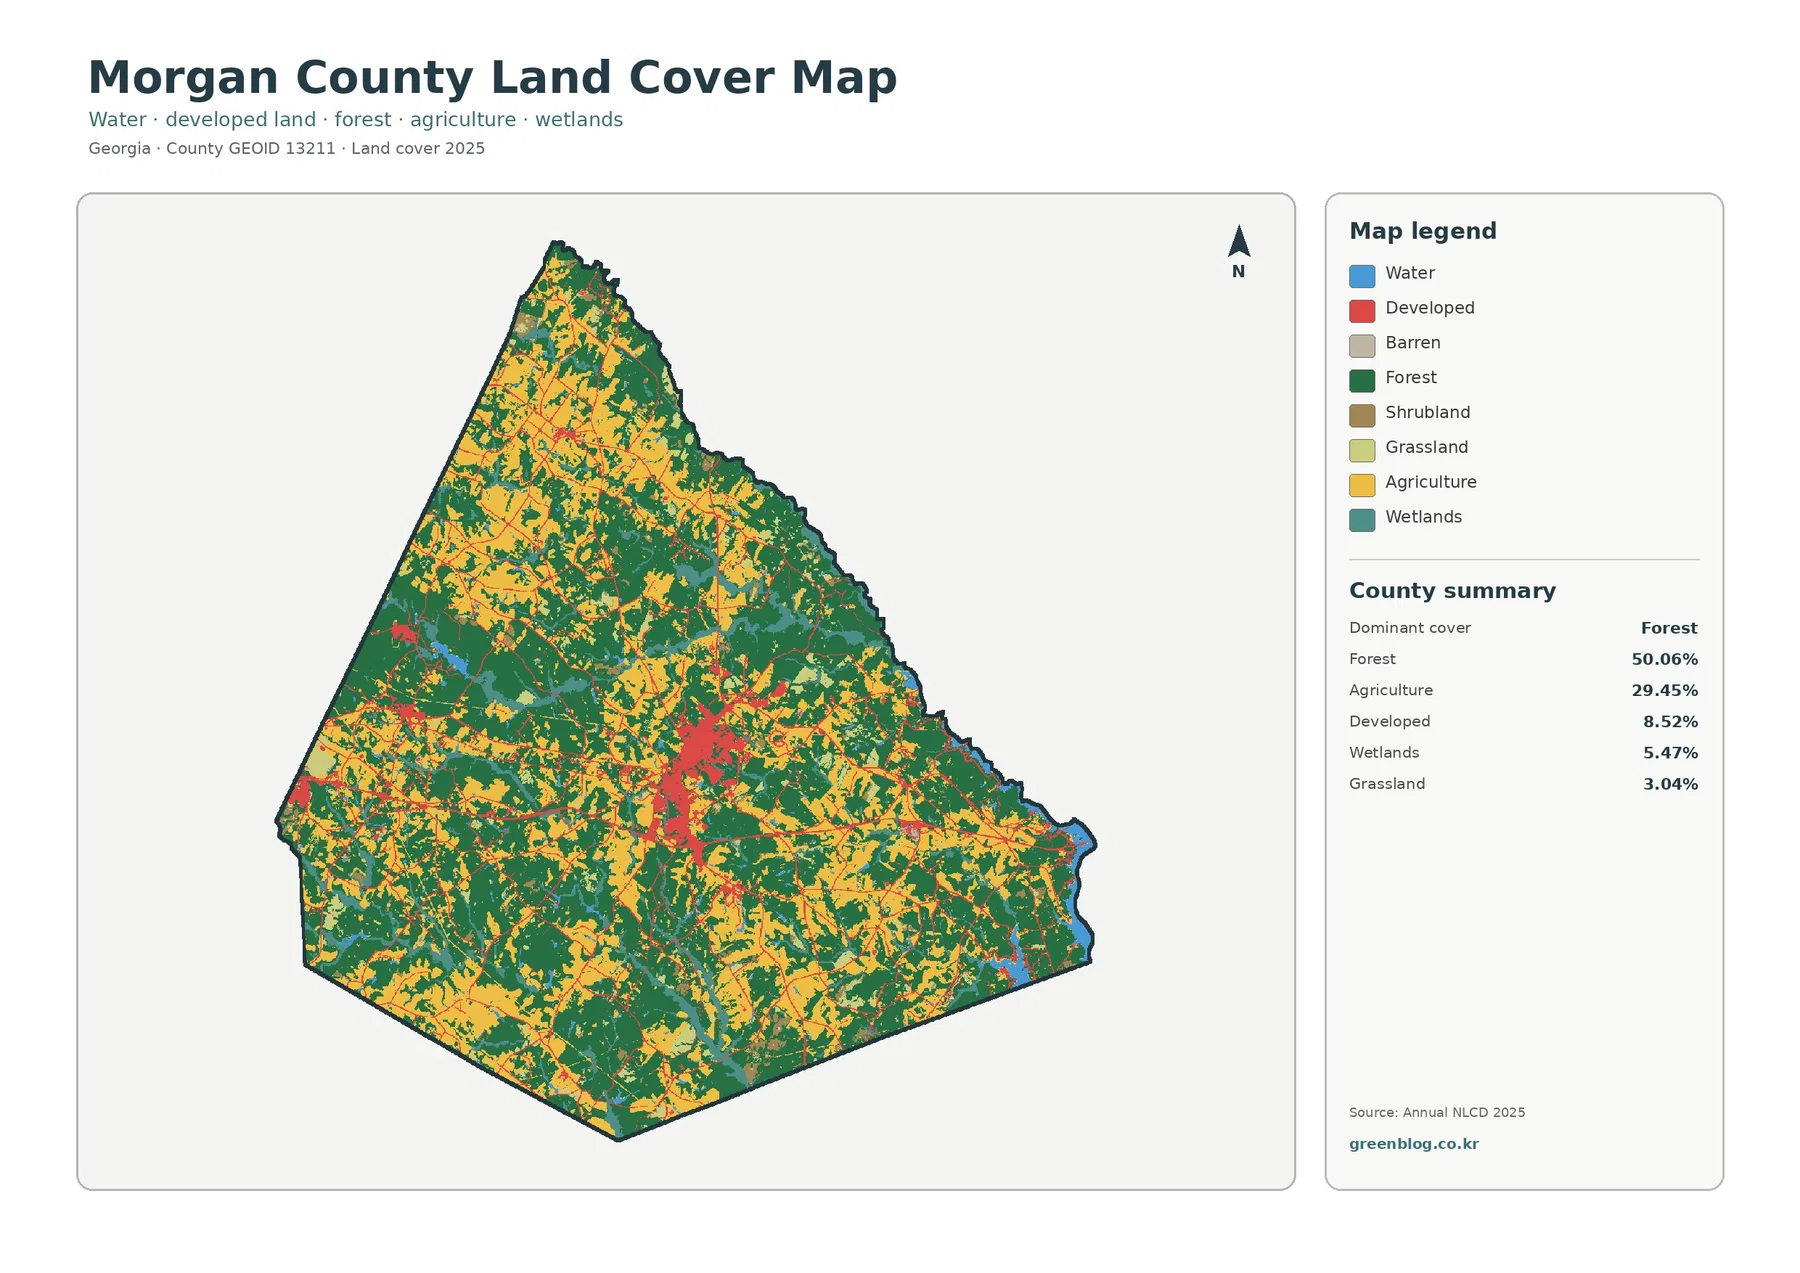
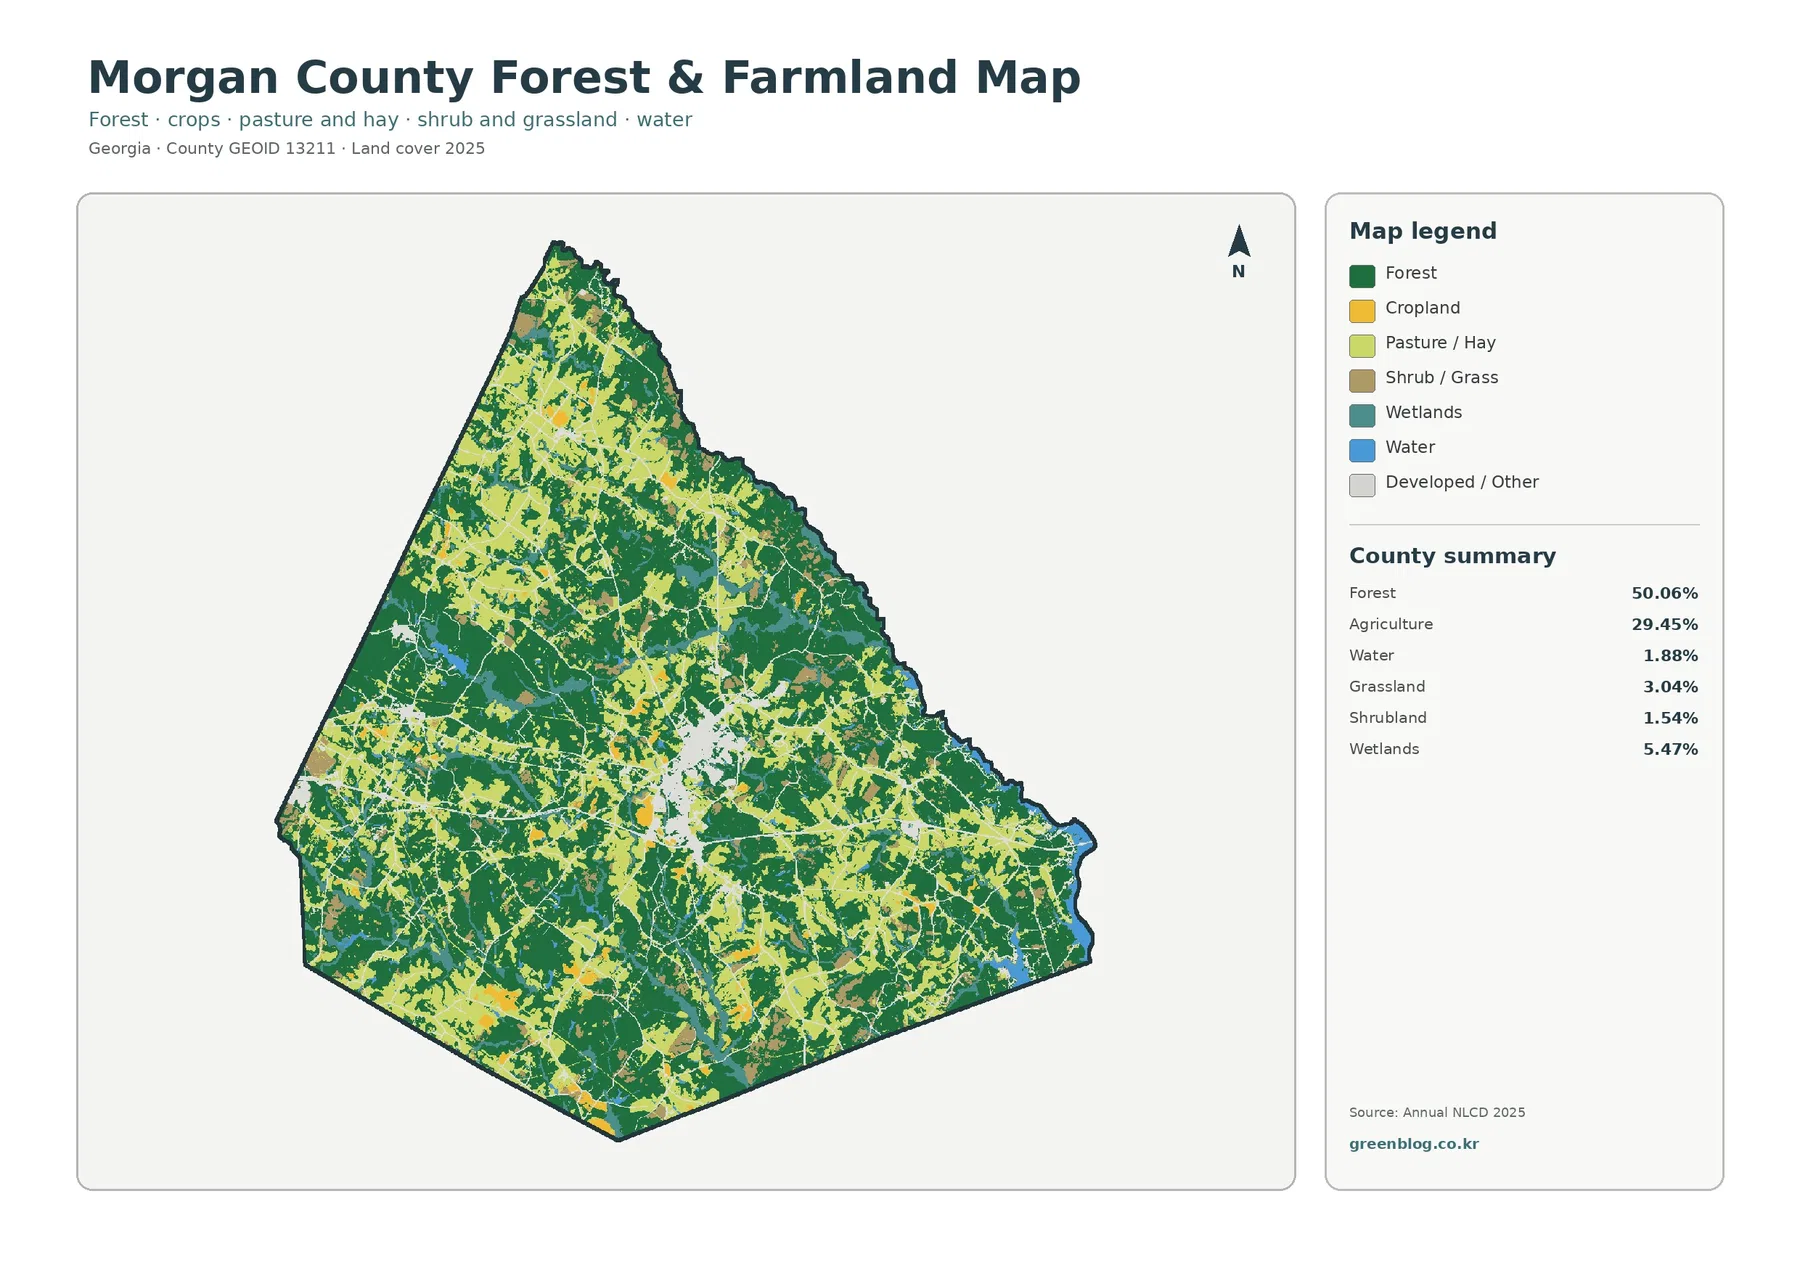
Forest is the dominant class at 50.06%. Large dark-green blocks are easy to find in the southwest, west-central area, and along parts of the eastern side, but forest is not limited to those sections. Green strips and patches continue through the north and around Madison, breaking up farm and settlement areas at many scales.
Agriculture accounts for 29.45%, giving Morgan County a much stronger farm footprint than the forest percentage alone might suggest. Yellow field blocks are especially common in the north and northeast and continue through the center and southeast. The county therefore reads as a forest-and-farm mosaic, with neither category confined to a single edge.
Developed land is 8.52%, wetlands 5.47%, and grassland 3.04%. The vegetation summary adds shrubland at 1.54% and open water at 1.88%. Wet areas appear in narrow and branching shapes through several parts of the county, while open water is much less extensive. Teal wetland cells should not be treated as if they were all exposed streams or ponds.
The vegetation map shows a stronger agricultural presence in the north and northeast
Removing the developed colors makes the north-south contrast easier to see. Agricultural blocks are frequent across the north and northeast, while larger forested sections become more apparent through the southwest and west-central county. The east and southeast remain mixed, with fields and woodland repeatedly alternating rather than forming one broad agricultural belt.
Morgan County’s recent planning material treats agriculture and forestry as major parts of the local rural economy and reports 97,901 acres in farm use in the 2022 Census of Agriculture. UGA Extension’s Morgan County office also provides crop, livestock, soil, and farm-management resources. Those sources give useful local context for the large agricultural share without implying that a yellow pixel identifies a particular crop or owner.
The 1985–2025 comparison spreads well beyond the places that became developed
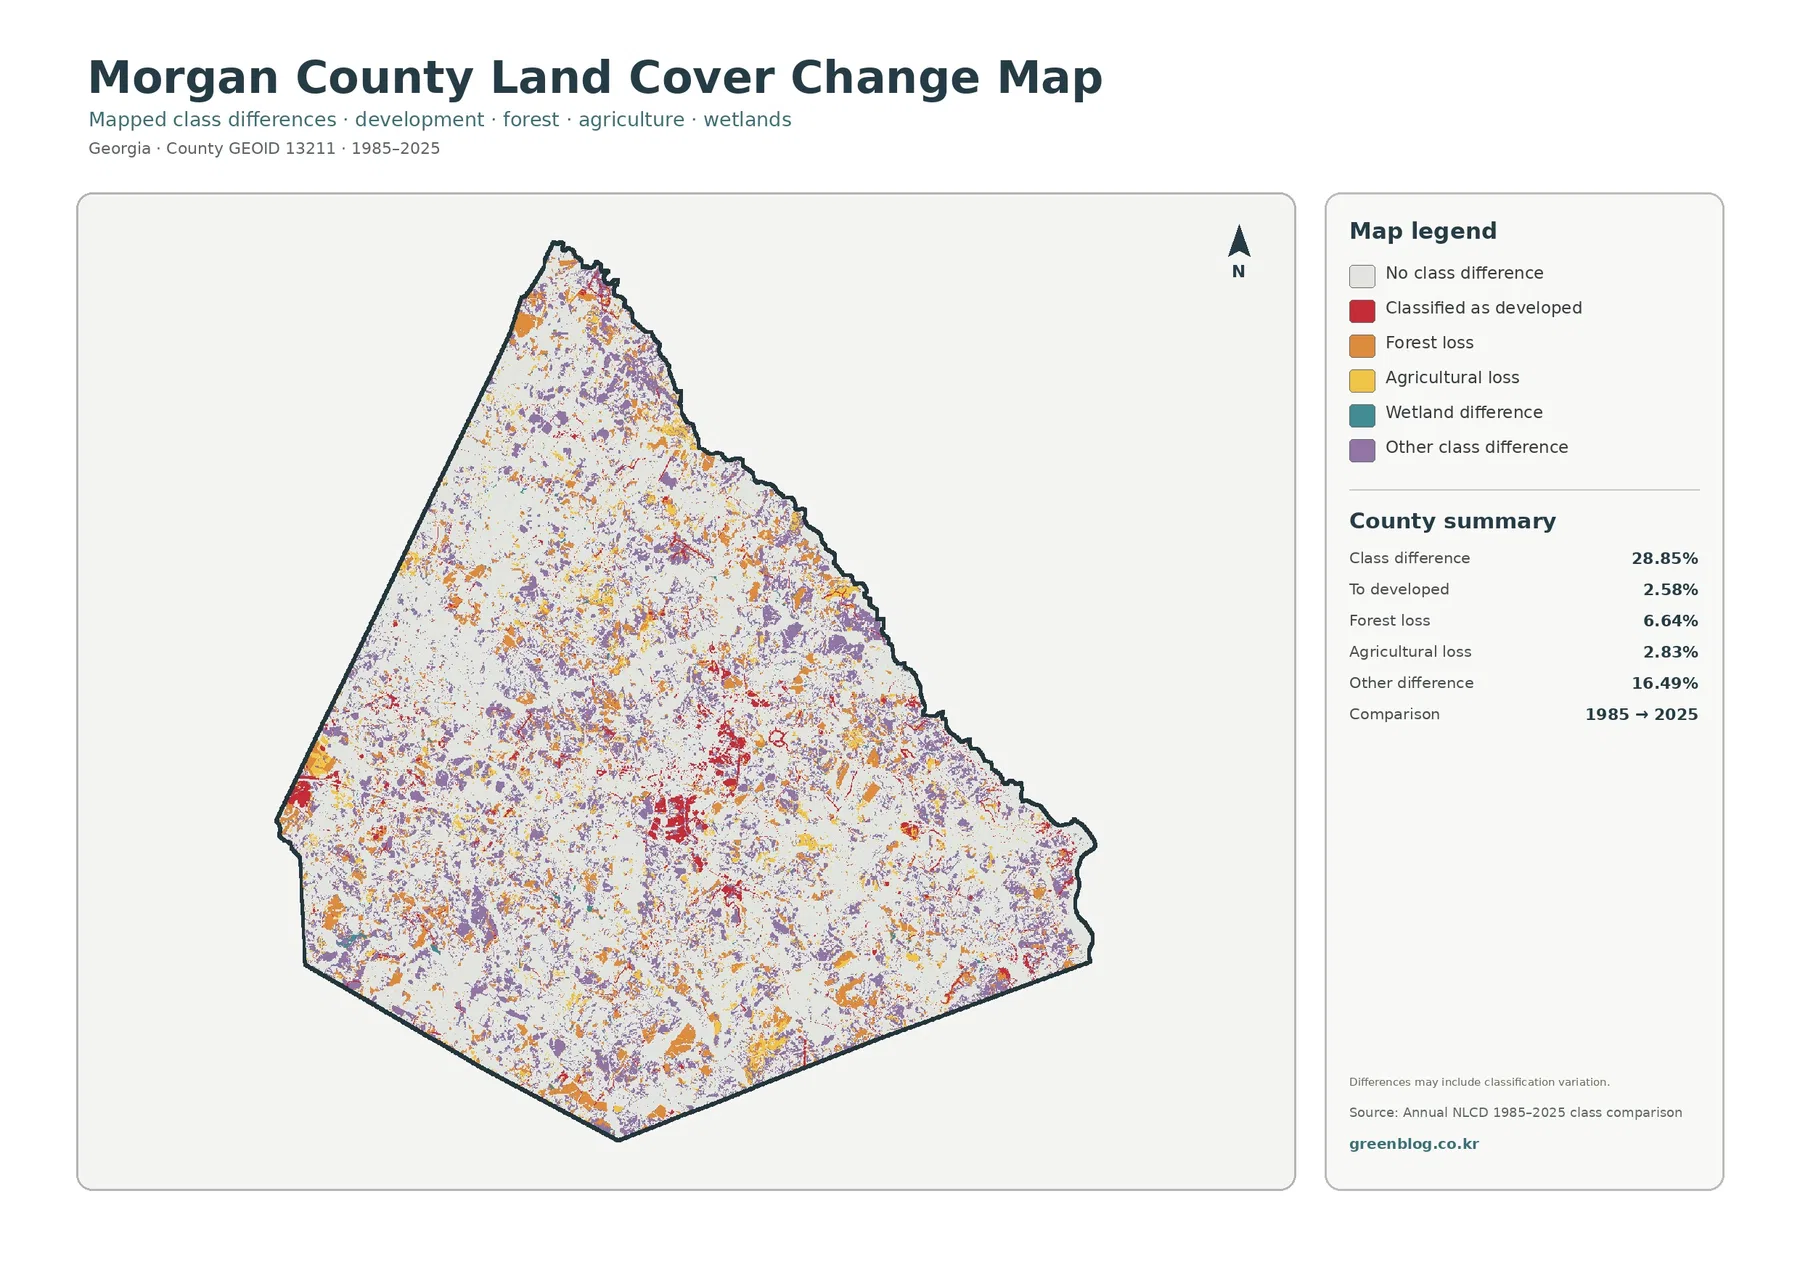
The total endpoint class difference is 28.85%. This figure counts raster cells assigned different categories in 1985 and 2025. It is not an urbanization rate, and it should not be read as the percentage of Morgan County that was damaged or permanently converted. The map itself notes that classification variation may be included.
The printed summary lists 16.49% other difference, 6.64% forest loss, 2.83% agricultural loss, and 2.58% classified to developed. Red developed-change cells are most noticeable around Madison and along several road-oriented areas. Orange forest-loss and purple other-difference cells are much more widely scattered through the north, center, south, and western side.
Wetland difference appears in the legend without its own printed percentage. The missing rate should not be reconstructed by subtraction and presented as an official value. A forest-loss or agricultural-loss label also does not explain the cause; intermediate imagery, land records, or local documentation are needed before assigning a specific reason.
Frequently Asked Questions
Is Morgan County primarily forest or farmland?
Forest is the largest class in the supplied 2025 summary at 50.06%, while agriculture covers 29.45%. Together they account for most of the county and create the mixed wooded-and-farm pattern visible outside Madison and the smaller towns.
Can the impervious map identify I-20 and other highways by name?
No. Road-shaped hard-surface lines are visible, but route names are not part of the raster. Morgan County and Census transportation data are needed to confirm I-20, U.S. 278, U.S. 129/441, and other roads.
Does the 28.85% endpoint difference mean that much of the county was developed?
No. It counts all cells with different class labels in 1985 and 2025. The summary separately lists 2.58% classified to developed, 6.64% forest loss, 2.83% agricultural loss, and 16.49% other difference.
Picking the right JPG for a report or lesson
Use the 2025 countywide map when the goal is to introduce the balance among forest, agriculture, wetlands, and settlement. The vegetation view is better for a closer farm-versus-forest discussion. Choose the impervious map when Madison and the main road corridors are the focus, and reserve the endpoint map for a separate discussion of classification differences through time.
Each original JPG measures 2480 × 1754 pixels and works well for reports, lessons, and presentation graphics. The package does not identify the files as meeting an A3 high-resolution reference, so test a proof before relying on them for large-format printing.
Map File Information
The ZIP contains four original JPG maps for comparing Morgan County's 50.06% forest cover, 29.45% agriculture, Madison and road-oriented development, impervious surfaces, wetlands, and 1985–2025 class differences.
- Included Files: Use only the versions confirmed in the article and supplied images
- File Type: Use the confirmed download contents
- Intended Use: Printing, education, presentations, and map-based projects
Related Maps
- Appling County Georgia Land Cover Map
- Atkinson County Georgia Land Cover Map
- Bacon County Georgia Land Cover Map
Sources and Reference Data
- MRLC Annual NLCD Data – official access to annual land-cover and comparison products
- USGS Annual NLCD Land Cover Classification – definitions for forest, agriculture, developed land, wetlands, and related classes
- U.S. Census Bureau TIGER/Line Shapefiles – authoritative county, place, and transportation layers for comparison
- Morgan County – Comprehensive Plan – official land-use, transportation, agriculture, and community-planning context
- City of Madison – Maps & Data – official city-limit, zoning, and GreenPrint maps for distinguishing planning boundaries from land cover
- UGA Extension – Morgan County Agriculture & Natural Resources – local crop, livestock, soil, farm-management, and natural-resource information
Green Map creates custom-edited map images using open geographic data sources such as geoBoundaries, Natural Earth, OpenStreetMap, and government open data.
These maps are edited visual materials, not raw data files, and are provided for education, documents, presentations, and graphic reference.